Track

Have this cheat sheet at your fingertips
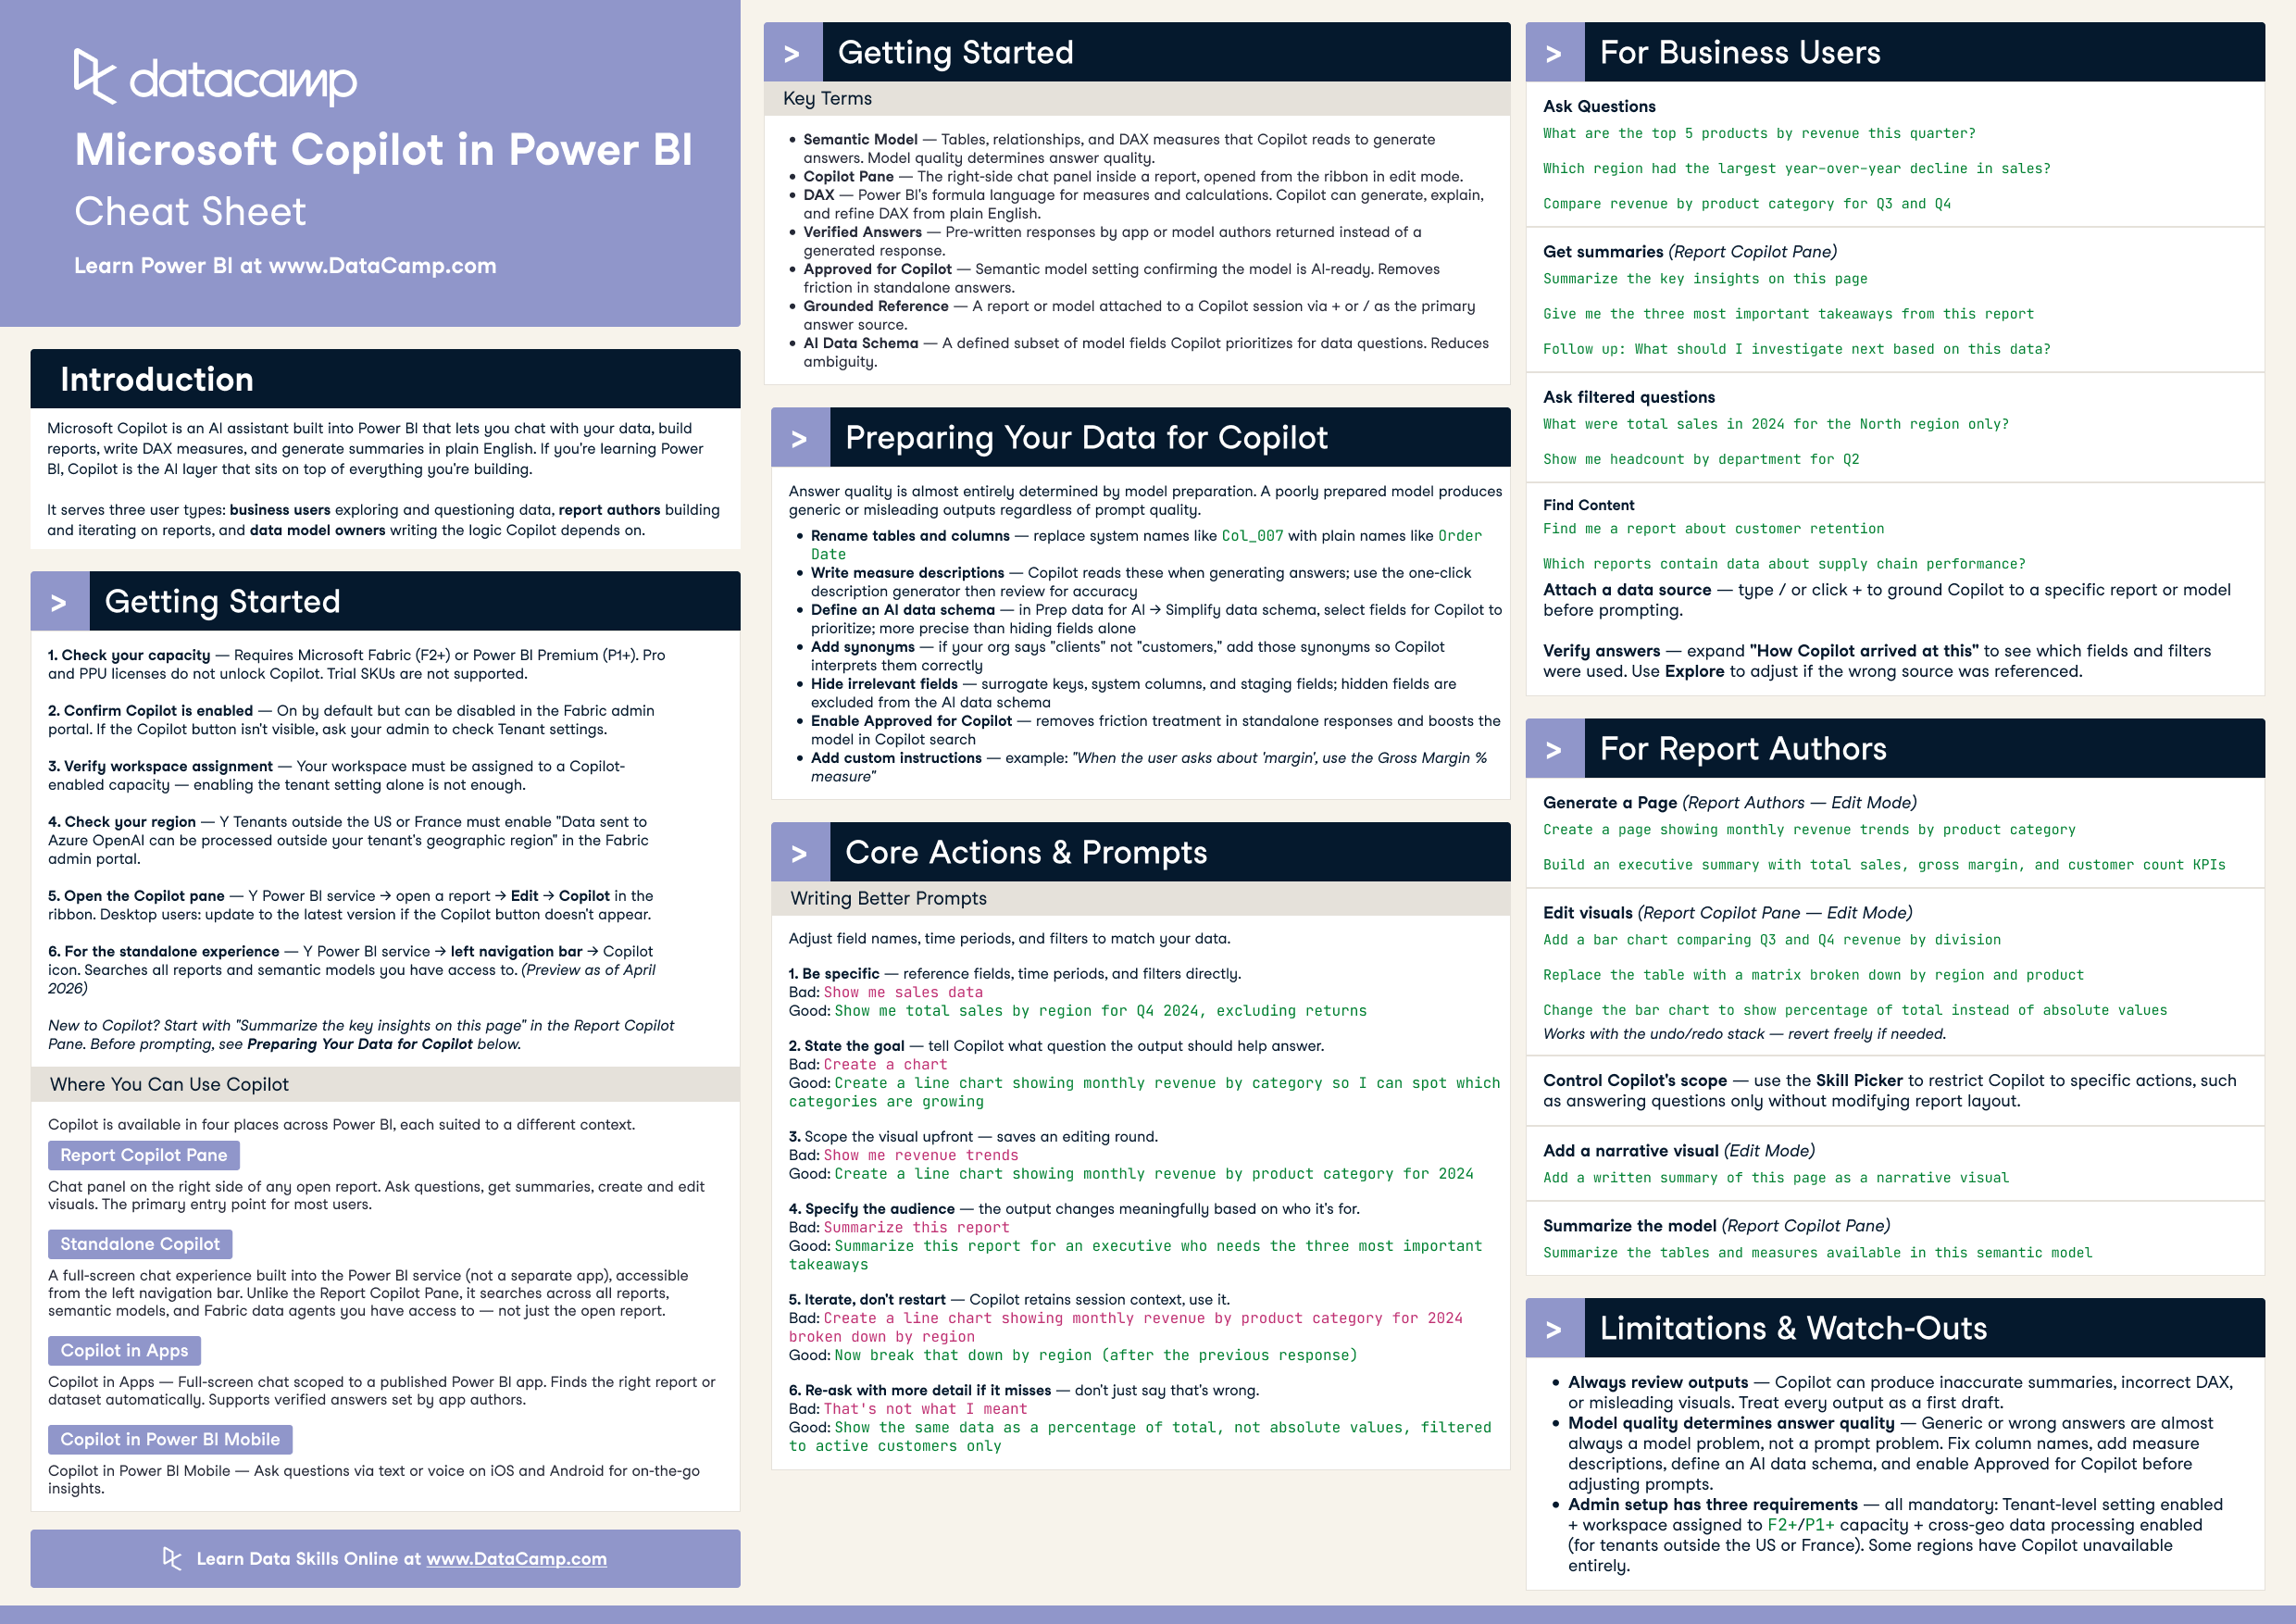
Download PDFMicrosoft Copilot is an AI assistant built into Power BI that lets you chat with your data, build reports, write DAX measures, and generate summaries in plain English. It serves three user types: business users exploring and questioning data, report authors building and iterating on reports, and data model owners writing the logic Copilot depends on.
Getting started
- Check your capacity. Requires Microsoft Fabric (F2+) or Power BI Premium (P1+). Pro and PPU licenses do not unlock Copilot. Trial SKUs are not supported.
- Confirm Copilot is enabled. On by default but can be disabled in the Fabric admin portal. If the Copilot button isn't visible, ask your admin to check Tenant settings.
- Verify workspace assignment. Your workspace must be assigned to a Copilot-enabled capacity — enabling the tenant setting alone is not enough.
- Check your region. Tenants outside the US or France must enable "Data sent to Azure OpenAI can be processed outside your tenant's geographic region" in the Fabric admin portal.
- Open the Copilot pane. Power BI service → open a report → Edit → Copilot in the ribbon. Desktop users: update to the latest version if the Copilot button doesn't appear.
- For the standalone experience. Power BI service → left navigation bar → Copilot icon. Searches all reports and semantic models you have access to.
New to Copilot? Start with "Summarize the key insights on this page" in the Report Copilot Pane. Before prompting, see Preparing your data for Copilot below.
Where you can use Copilot
- Report Copilot Pane — chat panel on the right side of any open report. Ask questions, get summaries, create and edit visuals. The primary entry point for most users.
- Standalone Copilot — full-screen chat experience built into the Power BI service, accessible from the left navigation bar. Searches across all reports, semantic models, and Fabric data agents you have access to — not just the open report.
- Copilot in Apps — full-screen chat scoped to a published Power BI app. Finds the right report or dataset automatically. Supports verified answers set by app authors.
- Copilot in Power BI Mobile — ask questions via text or voice on iOS and Android for on-the-go insights.
Key terms
- Semantic Model — tables, relationships, and DAX measures that Copilot reads to generate answers. Model quality determines answer quality.
- Copilot Pane — the right-side chat panel inside a report, opened from the ribbon in edit mode.
- DAX — Power BI's formula language for measures and calculations. Copilot can generate, explain, and refine DAX from plain English.
- Verified Answers — pre-written responses by app or model authors returned instead of a generated response.
- Approved for Copilot — semantic model setting confirming the model is AI-ready. Removes friction in standalone answers.
- Grounded Reference — a report or model attached to a Copilot session via
+or/as the primary answer source. - AI Data Schema — a defined subset of model fields Copilot prioritizes for data questions. Reduces ambiguity.
Preparing your data for Copilot
Answer quality is almost entirely determined by model preparation. A poorly prepared model produces generic or misleading outputs regardless of prompt quality.
- Rename tables and columns — replace system names like
Col_007with plain names likeOrder Date. - Write measure descriptions — Copilot reads these when generating answers; use the one-click description generator then review for accuracy.
- Define an AI data schema — in Prep data for AI → Simplify data schema, select fields for Copilot to prioritize; more precise than hiding fields alone.
- Add synonyms — if your org says "clients" not "customers," add those synonyms so Copilot interprets them correctly.
- Hide irrelevant fields — surrogate keys, system columns, and staging fields; hidden fields are excluded from the AI data schema.
- Enable Approved for Copilot — removes friction treatment in standalone responses and boosts the model in Copilot search.
- Add custom instructions — example: "When the user asks about 'margin', use the Gross Margin % measure".
Writing better prompts
1. Be specific
Reference fields, time periods, and filters directly.
Bad: Show me sales data
Good: Show me total sales by region for Q4 2024, excluding returns
2. State the goal
Tell Copilot what question the output should help answer.
Bad: Create a chart
Good: Create a line chart showing monthly revenue by category so I can spot which categories are growing
3. Scope the visual upfront
Saves an editing round.
Bad: Show me revenue trends
Good: Create a line chart showing monthly revenue by product category for 2024
4. Specify the audience
The output changes meaningfully based on who it's for.
Bad: Summarize this report
Good: Summarize this report for an executive who needs the three most important takeaways
5. Iterate, don't restart
Copilot retains session context, so use it.
Bad: Create a line chart showing monthly revenue by product category for 2024 broken down by region
Good: Now break that down by region (after the previous response)
6. Re-ask with more detail if it misses
Don't just say "that's wrong."
Bad: That's not what I meant
Good: Show the same data as a percentage of total, not absolute values, filtered to active customers only
Core actions and prompts
Adjust field names, time periods, and filters to match your data.
For business users — ask questions
What are the top 5 products by revenue this quarter?
Which region had the largest year-over-year decline in sales?
Compare revenue by product category for Q3 and Q4
For business users — get summaries (Report Copilot Pane)
Summarize the key insights on this page
Give me the three most important takeaways from this report
Follow up with: What should I investigate next based on this data?
For business users — filtered questions
What were total sales in 2024 for the North region only?
Show me headcount by department for Q2
For business users — find content
Find me a report about customer retention
Which reports contain data about supply chain performance?
Attach a data source — type / or click + to ground Copilot to a specific report or model before prompting.
Verify answers — expand "How Copilot arrived at this" to see which fields and filters were used. Use Explore to adjust if the wrong source was referenced.
For report authors — generate a page (Edit Mode)
Create a page showing monthly revenue trends by product category
Build an executive summary with total sales, gross margin, and customer count KPIs
For report authors — edit visuals (Edit Mode)
Add a bar chart comparing Q3 and Q4 revenue by division
Replace the table with a matrix broken down by region and product
Change the bar chart to show percentage of total instead of absolute values
Works with the undo/redo stack — revert freely if needed.
Control Copilot's scope — use the Skill Picker to restrict Copilot to specific actions, such as answering questions only without modifying report layout.
For report authors — add a narrative visual (Edit Mode)
Add a written summary of this page as a narrative visual
For report authors — summarize the model (Report Copilot Pane)
Summarize the tables and measures available in this semantic model
For data model owners — generate DAX (DAX Query View)
Write a DAX measure for rolling 12-month revenue
Create a measure showing percentage change versus the same period last year
For data model owners — debug DAX
Explain what this DAX measure is doing and whether it is correct
Why might this measure be returning blank for some rows?
Generate measure descriptions — select any measure → click the Copilot description button to auto-generate a plain-English description visible to report creators on hover.
Limitations and watch-outs
- Always review outputs. Copilot can produce inaccurate summaries, incorrect DAX, or misleading visuals. Treat every output as a first draft.
- Model quality determines answer quality. Generic or wrong answers are almost always a model problem, not a prompt problem. Fix column names, add measure descriptions, define an AI data schema, and enable Approved for Copilot before adjusting prompts.
- Admin setup has three requirements — all mandatory. Tenant-level setting enabled + workspace assigned to F2+/P1+ capacity + cross-geo data processing enabled (for tenants outside the US or France). Some regions have Copilot unavailable entirely — check Microsoft's Fabric region availability documentation.