
Kursus
Analisis Data di Excel
3 Hr
151.2K
The CORREL() function in Excel is a powerful statistical tool that helps users determine the relationship between two sets of data. By calculating the correlation coefficient, you can quickly assess whether two variables move together, move in opposite directions, or have no relationship at all.
In this article, I'll will walk you through how to use the CORREL() function in Excel, along with its syntax, and some examples. It's a good starting point for other things, also, as you will see, like regression and things that happen in finance, such as when working with stock returns and interest rates.
The CORREL() function in Excel measures the strength and direction of the linear relationship between two variables. The result, known as the correlation coefficient or, more exactly, the Pearson correlation coefficient, ranges from -1 to 1:
This function is commonly used to quantify relationships—for instance, a strong negative correlation (close to -1) between interest rates and bond prices, or a strong positive one (close to 1) between advertising spend and revenue.
Before using the CORREL() function, it's important to understand its syntax and required arguments. The function requires two ranges of data as input.
=CORREL(array1, array2)array1: The first range of values
array2: The second range of values
Both arrays must have the same number of data points. If they do not, CORREL() will return a #N/A error.
To use the CORREL() function in Excel, follow these steps:
Enter your two data sets in separate columns.
Click on the cell where you want the correlation coefficient to appear.
Type the CORREL() formula, referencing your data ranges.
Press Enter to display the result.
For example, if your data is in columns A and B from rows 2 to 11:
=CORREL(A2:A11, B2:B11)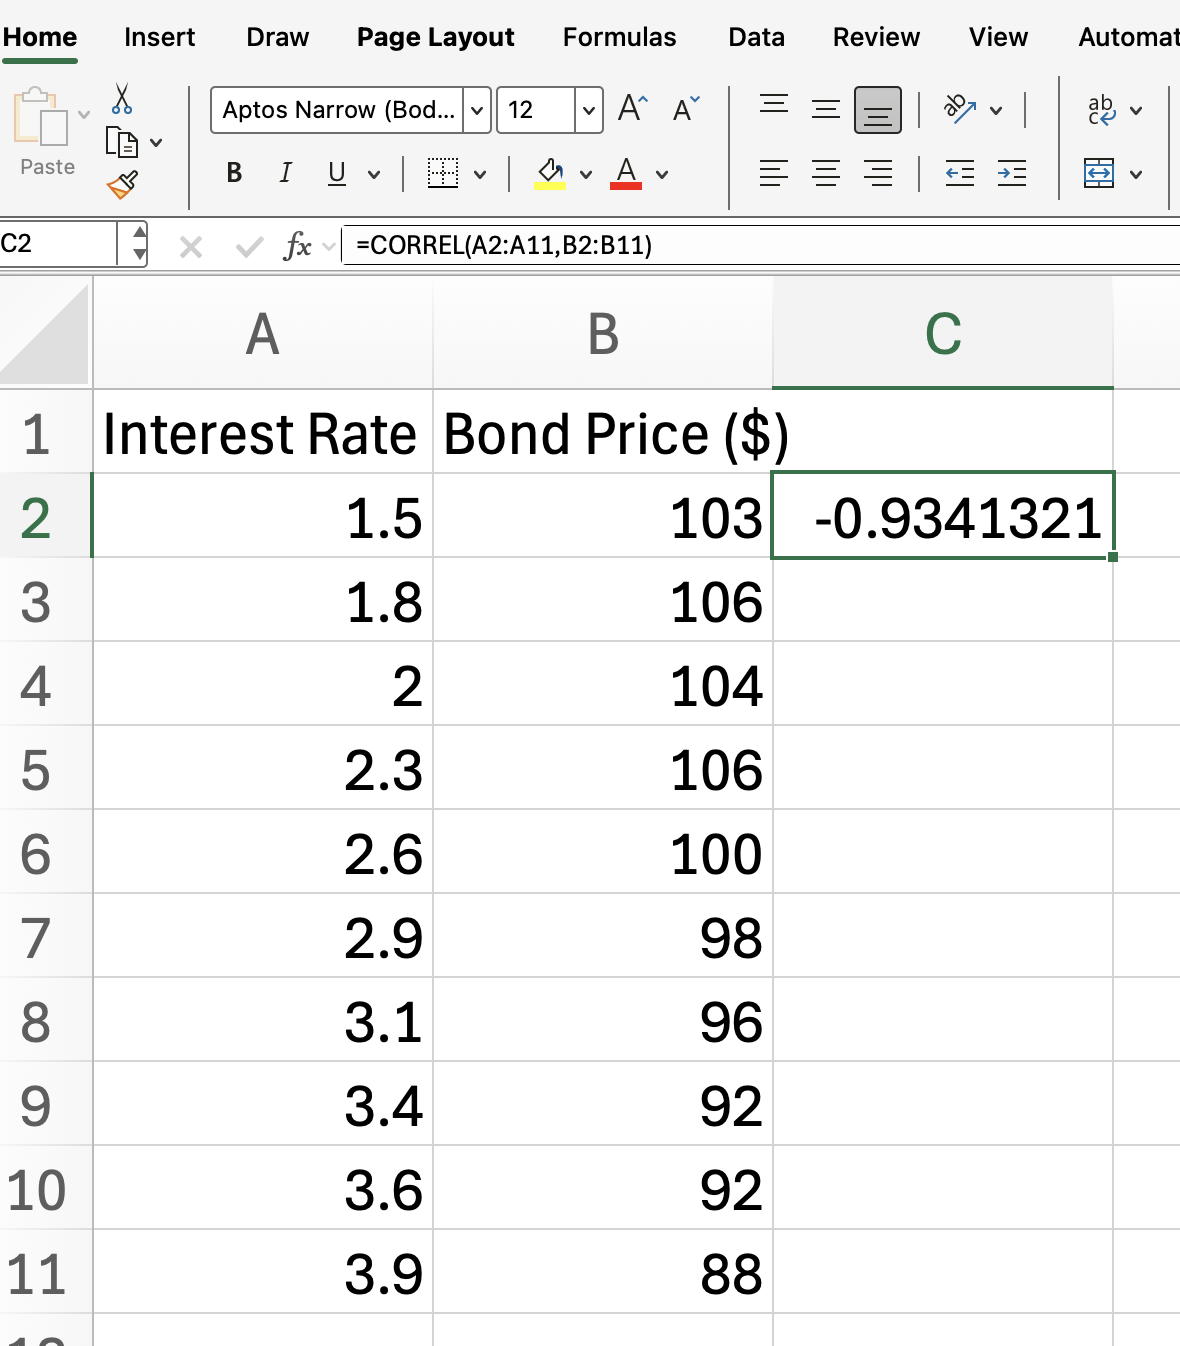
Our formula returns the correlation coefficient between the two data sets.
We expect get a result close to -1, indicating a strong negative correlation between interest rates and bond prices, as this aligns with financial theory, since as interest rates rise, bond prices typically fall.
After calculating the correlation coefficient, it's important to interpret the result correctly. The value you get from CORREL() will fall between -1 and 1:
Keep in mind that correlation does not imply causation. A high correlation coefficient simply indicates a relationship, not that one variable causes the other to change.
When using the CORREL() function in Excel, you may encounter some common errors. Understanding these can help you troubleshoot issues quickly.
N/A error: Occurs if the two arrays have different numbers of data points
DIV/0! error: Happens if either array has less than two data points or if the standard deviation of either array is zero
VALUE! error: Appears if non-numeric values are included in the data ranges
If you make sure that your data ranges are equal in length and contain only numeric values, I think you will avoid all of these errors.
The CORREL() function in Excel is an essential tool for analyzing the relationship between two data sets. Once you are comfortable using the CORREL() function, you may want to explore other statistical functions in Excel. Functions like COVARIANCE.P() and LINEST() are very useful for what they do. And make sure to take our Data Analysis in Excel course to keep learning.
Gain the skills to maximize Excel—no experience required.
Learn Excel with DataCamp
Kursus
Kursus
Kursus
Tutorials
Josef Waples
6 mnt
Tutorials
Amberle McKee
15 mnt
Tutorials
Arunn Thevapalan
9 mnt
Tutorials
Josef Waples
5 mnt
Tutorials
Amberle McKee
10 mnt
Tutorials
Khalid Abdelaty
12 mnt


