Have this cheat sheet at your fingertips
Download PDFOverview
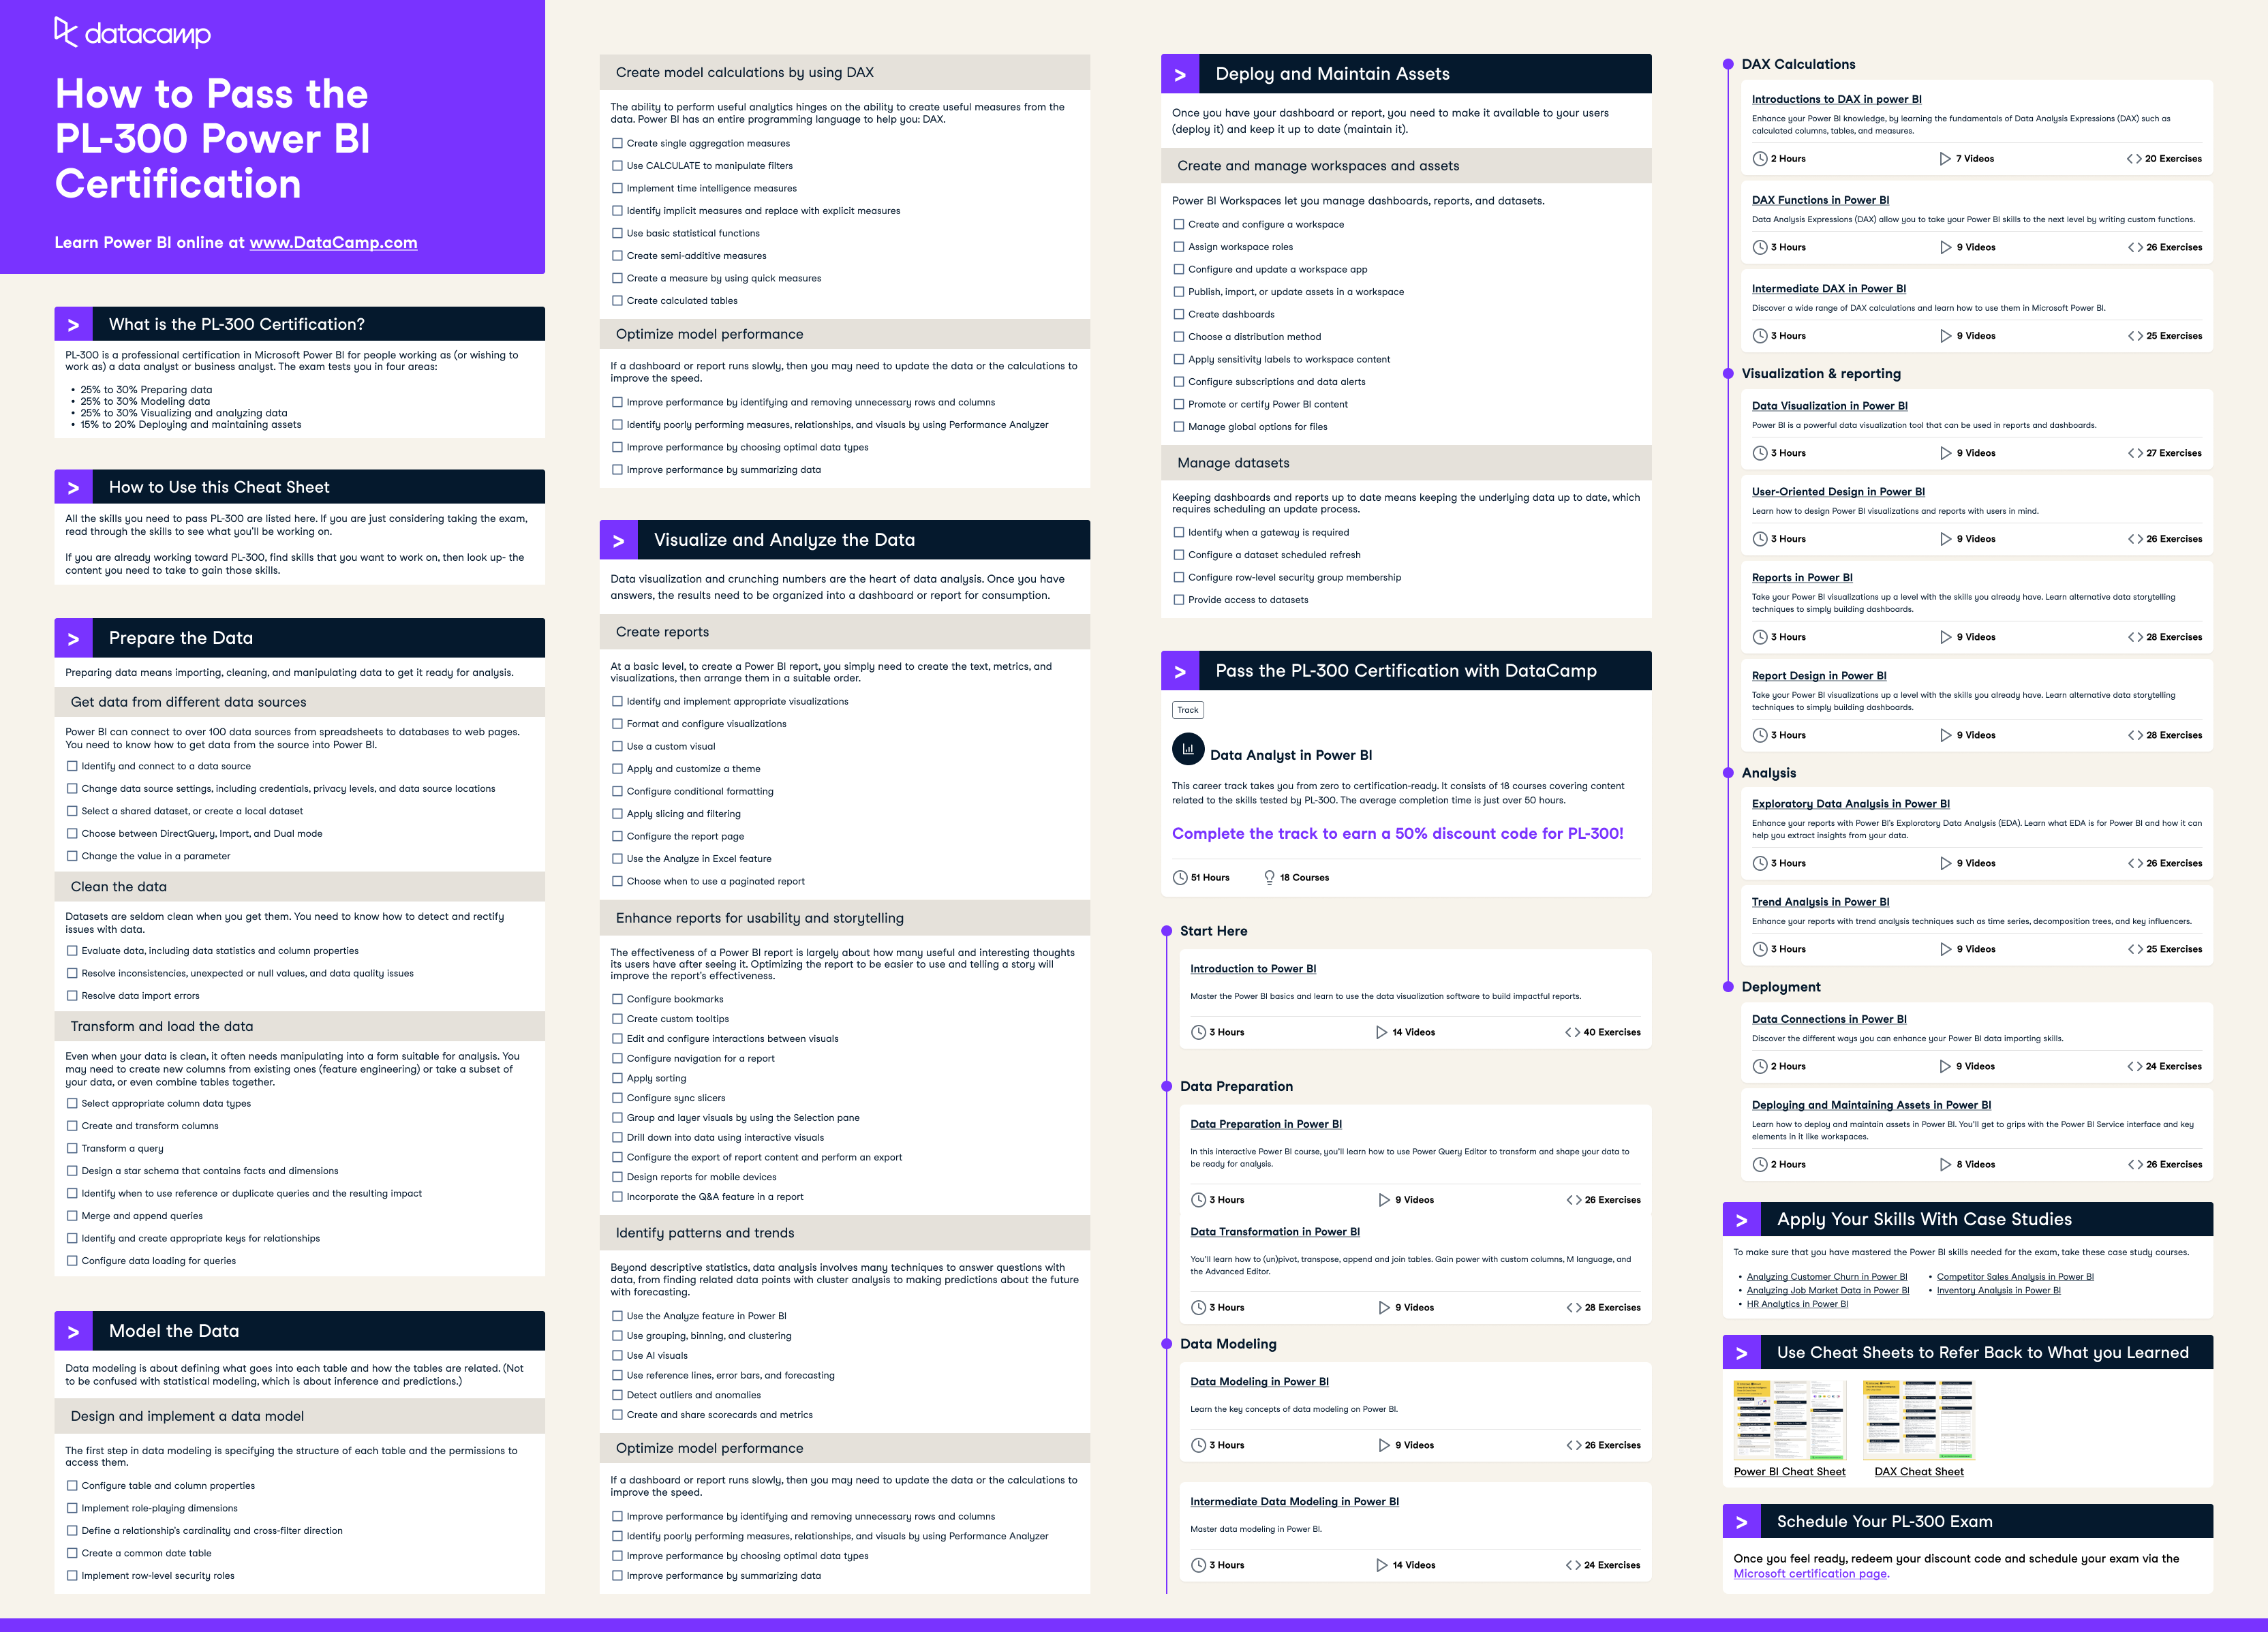
What is the PL-300 Certification?
PL-300 is a professional certification in Microsoft Power BI for people working as (or wishing to work as) a data analyst or business analyst. The exam tests you in four areas:
- 25% to 30% Preparing data
- 25% to 30% Modeling data
- 25% to 30% Visualizing and analyzing data
- 15% to 20% Deploying and maintaining assets
How to use this cheat sheet
All the skills you need to pass PL-300 are listed here. If you are just considering taking the exam, read through the skills to see what you'll be working on.
If you are already working toward PL-300, find skills that you want to work on, then look at the content you need to take to gain those skills.
Prepare the Data
Preparing data means importing, cleaning, and manipulating data to get it ready for analysis.
Get data from different data sources
Power BI can connect to over 100 data sources from spreadsheets to databases to web pages. You need to know how to get data from the source into Power BI.
- Identify and connect to a data source
- Change data source settings, including credentials, privacy levels, and data source locations
- Select a shared dataset, or create a local dataset
- Choose between DirectQuery, Import, and Dual mode
- Change the value in a parameter
Clean the data
Datasets are seldom clean when you get them. You need to know how to detect and rectify issues with data.
- Evaluate data, including data statistics and column properties
- Resolve inconsistencies, unexpected or null values, and data quality issues
- Resolve data import errors
Transform and load the data
Even when your data is clean, it often needs manipulating into a form suitable for analysis. You may need to create new columns from existing ones (feature engineering) or take a subset of your data, or even combine tables together.
- Select appropriate column data types
- Create and transform columns
- Transform a query
- Design a star schema that contains facts and dimensions
- Identify when to use reference or duplicate queries and the resulting impact
- Merge and append queries
- Identify and create appropriate keys for relationships
- Configure data loading for queries
Model the Data
Data modeling is about defining what goes into each table and how the tables are related. (Not to be confused with statistical modeling, which is about inference and predictions.)
Design and implement a data model
The first step in data modeling is specifying the structure of each table and the permissions to access them.
- Configure table and column properties
- Implement role-playing dimensions
- Define a relationship's cardinality and cross-filter direction
- Create a common date table
- Implement row-level security roles
Create model calculations by using DAX
The ability to perform useful analytics hinges on the ability to create useful measures from the data. Power BI has an entire programming language to help you: DAX.
- Create single aggregation measures
- Use CALCULATE to manipulate filters
- Implement time intelligence measures
- Identify implicit measures and replace with explicit measures
- Use basic statistical functions
- Create semi-additive measures
- Create a measure by using quick measures
- Create calculated tables
Optimize model performance
If a dashboard or report runs slowly, then you may need to update the data or the calculations to improve the speed.
- Improve performance by identifying and removing unnecessary rows and columns
- Identify poorly performing measures, relationships, and visuals by using Performance Analyzer
- Improve performance by choosing optimal data types
- Improve performance by summarizing data
Become a Power BI Data Analyst
Master the world's most popular business intelligence tool.
Visualize and Analyze the Data
Data visualization and crunching numbers are the heart of data analysis. Once you have answers, the results need to be organized into a dashboard or report for consumption.
Create reports
At a basic level, to create a Power BI report, you simply need to create the text, metrics, and visualizations, then arrange them in a suitable order.
- Identify and implement appropriate visualizations
- Format and configure visualizations
- Use a custom visual
- Apply and customize a theme
- Configure conditional formatting
- Apply slicing and filtering
- Configure the report page
- Use the Analyze in Excel feature
- Choose when to use a paginated report
Enhance reports for usability and storytelling
The effectiveness of a Power BI report is largely about how many useful and interesting thoughts its users have after seeing it. Optimizing the report to be easier to use and telling a story will improve the report's effectiveness.
- Configure bookmarks
- Create custom tooltips
- Edit and configure interactions between visuals
- Configure navigation for a report
- Apply sorting
- Configure sync slicers
- Group and layer visuals by using the Selection pane
- Drill down into data using interactive visuals
- Configure the export of report content and perform an export
- Design reports for mobile devices
- Incorporate the Q&A feature in a report
Identify patterns and trends
Beyond descriptive statistics, data analysis involves many techniques to answer questions with data, from finding related data points with cluster analysis to making predictions about the future with forecasting.
- Use the Analyze feature in Power BI
- Use grouping, binning, and clustering
- Use AI visuals
- Use reference lines, error bars, and forecasting
- Detect outliers and anomalies
- Create and share scorecards and metrics
Deploy and Maintain Assets
Once you have your dashboard or report, you need to make it available to your users (deploy it) and keep it up to date (maintain it).
Create and manage workspaces and assets
Power BI Workspaces let you manage dashboards, reports, and datasets.
- Create and configure a workspace
- Assign workspace roles
- Configure and update a workspace app
- Publish, import, or update assets in a workspace
- Create dashboards
- Choose a distribution method
- Apply sensitivity labels to workspace content
- Configure subscriptions and data alerts
- Promote or certify Power BI content
- Manage global options for files
Manage datasets
Keeping dashboards and reports up to date means keeping the underlying data up to date, which requires scheduling an update process.
- Identify when a gateway is required
- Configure a dataset scheduled refresh
- Configure row-level security group membership
- Provide access to datasets
Pass the PL-300 Certification with DataCamp
DataCamp’s Data Analyst in Power BI career track takes you from zero to certification-ready. It consists of 18 courses covering content related to the skills tested by PL-300. The average completion time is just over 50 hours, and passing it gets you a 50% discount code on the PL-300!
Prepare for the PL-300 with Courses
Start here
Data modeling
Data preparation
DAX calculations
Visualization and reporting
- Data Visualization in Power BI
- User-Oriented Design in Power BI
- Reports in Power BI
- Report Design in Power BI
Analysis
Deployment
Apply Your Skills With Case Studies
To make sure that you have mastered the Power BI skills needed for the exam, take these case study courses.
- Analyzing Customer Churn in Power BI
- Analyzing Job Market Data in Power BI
- HR Analytics in Power BI
- Competitor Sales Analysis in Power BI
- Inventory Analysis in Power BI
Schedule Your PL-300 Exam
Once you feel ready, redeem your discount code and schedule your exam via the Microsoft certification page.