HomeCode-alongsData Analysis

Analyzing Olympics Data with SQL and Python

Learn how to load data from different sources and perform exploratory analyses.
Feb 7, 2023
Code along with us onCode Along

View Dataset

Learn how to leverage the power of DataLab by combining Python and SQL to load data from different sources, combine them, and perform exploratory analyses.

This training will use an Olympics dataset and then enrich it with country details from a SQL database. Learners will then explore the data, uncovering interesting insights and creating interactive visualizations.

This training is geared towards learners with some background in SQL and some introductory knowledge of Python. It is recommended that they take Joining Data in SQL and Data Manipulation with pandas prior to attending the session.

Key takeaways

  • Combine different data sources using SQL & Python using DataLab

  • Perform basic exploratory analysis using pandas

  • Learn how to use Plotly to easily create interactive visualizations

Materials

Topics
Related

code-along

Exploring World Cup Data in Python

Learn to use a combination of SQL & Python to import, process, and analyze data
Filip Schouwenaars's photo

Filip Schouwenaars

code-along

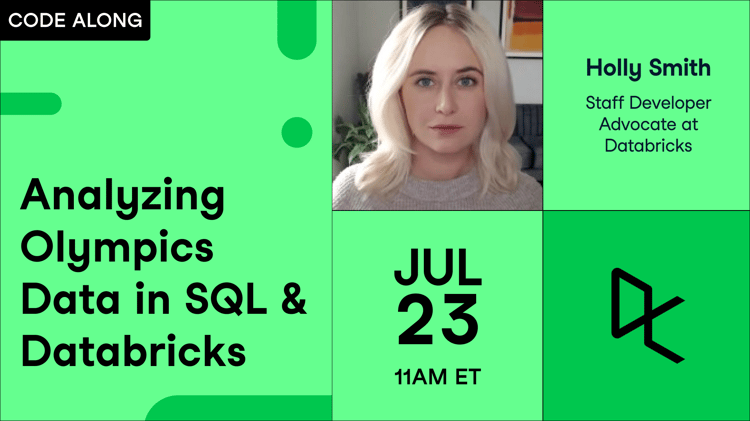
Analyzing Olympics Data in SQL & Databricks

In this session, Holly, a Staff Developer Advocate at Databricks, teaches you how to get started using the Databricks platform while working through an analysis of Olympics sporting data.
Holly Smith's photo

Holly Smith

code-along

Superbowl Analysis in Python

Learn to do exploratory data analysis in Python on historic Super Bowl data.

Eric Eager

code-along

Get Started Analyzing Survey Data with SQL & Python

In this introductory session, you'll explore a survey on business innovation. The focus will be on principles of analyzing survey data, and you'll write some simple SQL for calculations and simple Python for data visualizations.
Richie Cotton's photo

Richie Cotton

code-along

Exploratory Data Analysis in SQL for Absolute Beginners

Learn the basics of exploring new datasets using SQL.
Jasmin Ludolf's photo

Jasmin Ludolf

code-along

Analyzing Students’ Mental Health in SQL

Perform SQL querying and visualize results using Python Plotly.
Jasmin Ludolf's photo

Jasmin Ludolf

See MoreSee More