Data Visualization courses
Data visualization courses focus on techniques and tools for representing data graphically to communicate information clearly and efficiently. Build your visualization skills with tools such as Python, R, Tableau, Power BI and Excel.
Create Your Free Account
or
By continuing, you accept our Terms of Use, our Privacy Policy and that your data is stored in the USA.Training 2 or more people?
Try DataCamp for BusinessRecommended for Data Visualization beginners
Build your Data Visualization skills with interactive courses, curated by real-world experts
Course
Data Visualization in Power BI
BasicSkill Level
3 hours
9.9K
Track
Data Analyst in Power BI
50 hours
29.7K
Not sure where to start?
Take an AssessmentBrowse Data Visualization courses and tracks
Course
Introduction to Power BI
BasicSkill Level
4 hours
50K
Course
Introduction to Tableau
BasicSkill Level
6 hours
10K
Course
Data Visualization in Power BI
BasicSkill Level
3 hours
9.9K
Course
Understanding Data Visualization
BasicSkill Level
2 hours
8.6K
Course
Case Study: Analyzing Customer Churn in Power BI
BasicSkill Level
3 hours
6.6K
Course
Introduction to Data Visualization with Seaborn
BasicSkill Level
4 hours
6.5K
Course
Introduction to Data Visualization with Matplotlib
BasicSkill Level
4 hours
5.8K
Course
Introduction to Data Visualization with ggplot2
BasicSkill Level
4 hours
5.3K
Course
Data Visualization in Excel
BasicSkill Level
3 hours
4.1K
Course
Reports in Power BI
IntermediateSkill Level
3 hours
3.8K
Course
Report Design in Power BI
IntermediateSkill Level
3 hours
3.1K
Course
Analyzing Data in Tableau
BasicSkill Level
8 hours
2.6K
Course
Creating Dashboards in Tableau
BasicSkill Level
3 hours
2K
Course
Dashboard Design Concepts
BasicSkill Level
2 hours
1.9K
Course
Intermediate Data Visualization with ggplot2
IntermediateSkill Level
4 hours
1.7K
Course
Data Visualization in Tableau
BasicSkill Level
6 hours
1.3K
Course
Case Study: Analyzing Customer Churn in Tableau
BasicSkill Level
3 hours
904
Course
Data Visualization in Google Sheets
BasicSkill Level
4 hours
870
Course
Communicating with Data in the Tidyverse
BasicSkill Level
4 hours
787
Course
Introduction to Data Visualization with Plotly in Python
BasicSkill Level
4 hours
748
Course
Intermediate Data Visualization with Seaborn
IntermediateSkill Level
4 hours
719
Course
Calculations in Tableau
AdvancedSkill Level
6 hours
708
Course
Data Visualization in Databricks
BasicSkill Level
3 hours
690
Course
User-Oriented Design in Power BI
IntermediateSkill Level
2 hours
589
Course
Visualizing Geospatial Data in Python
IntermediateSkill Level
4 hours
535
Course
Case Study: Analyzing Healthcare Data in Power BI
IntermediateSkill Level
4 hours
527
Course
Case Study: Analyzing Job Market Data in Tableau
BasicSkill Level
3 hours
525
Course
Visualization Best Practices in R
BasicSkill Level
4 hours
511
Course
Improving Your Data Visualizations in Python
IntermediateSkill Level
4 hours
441
Course
Building Dashboards with Dash and Plotly
IntermediateSkill Level
4 hours
384
Related resources on Data Visualization
blog
Exploring 12 of the Best Data Visualization Tools in 2023 With Examples
There are many data visualization tools available. In this article, we have prepared a comprehensive list of some of the most useful data visualization tools in data science.
Javier Canales Luna
13 min
cheat sheet
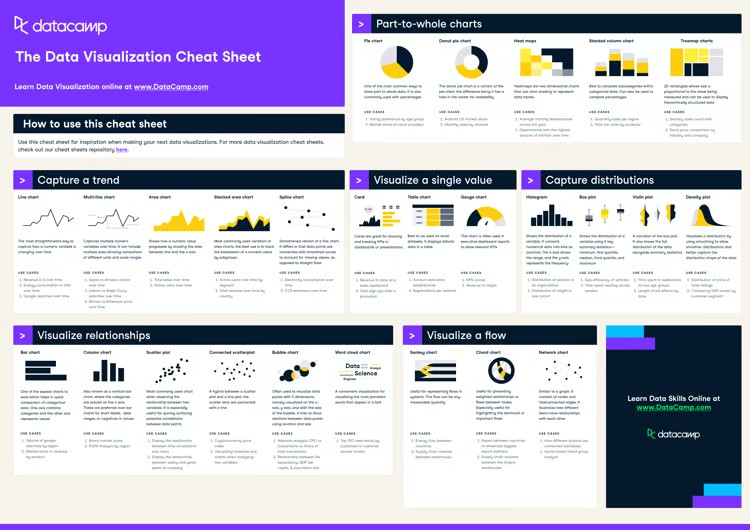
Data Visualization Cheat Sheet
In this data visualization cheat sheet, you'll learn about the most common data visualizations to employ, when to use them, and their most common use-cases.
Richie Cotton
5 min
Tutorial
Visualizing Data in Excel
Learn about Excel's various data visualization options that can help you analyze and interpret your data.
Jess Ahmet
12 min
