Track
डेटा विश्लेषक in R
36 घंटा
क्या आपने कभी t-परीक्षण चलाया, अजीब p-मूल्य मिला, और बाद में पता चला कि आपका डेटा सामान्य वितरण के पास भी नहीं था?
ऐसा कभी-न-कभी सभी के साथ हुआ है। t-परीक्षण की समस्या यह है कि यह मान लेता है कि आपका डेटा सामान्य वितरण का पालन करता है। जब ऐसा नहीं होता, तो परिणाम भ्रामक हो सकते हैं। टेढ़ा (skewed) डेटा और छोटे सैंपल आकार सामान्यता की उस धारणा का उल्लंघन करते हैं। और वास्तविक दुनिया का डेटा शायद ही कभी वैसे व्यवहार करता है जैसा पाठ्यपुस्तकें बताती हैं।
Mann-Whitney U परीक्षण इस समस्या को सुलझाने आता है। यह t-परीक्षण का एक नॉन-पैरामीट्रिक विकल्प है जो माध्य (means) के बजाय रैंकों के आधार पर दो समूहों की तुलना करता है, इसलिए इसे आपके वितरण के आकार की परवाह नहीं होती।
इस लेख में, मैं बताऊंगा कि Mann-Whitney U परीक्षण क्या है, इसे कब उपयोग करना चाहिए, इसका गणित कैसे काम करता है, और Python तथा R में इसे चलाकर परिणामों की व्याख्या कैसे करें।
पर t-परीक्षण है क्या? यदि आपके मन में यह प्रश्न है, तो हमारा Introduction to Python T-Tests ब्लॉग पोस्ट पढ़ें - यह आपके सभी प्रश्नों का उत्तर देगा।
Mann-Whitney U परीक्षण दो स्वतंत्र समूहों की तुलना के लिए उपयोग किया जाने वाला एक नॉन-पैरामीट्रिक सांख्यिकीय परीक्षण है।
t-परीक्षण के विपरीत, यह यह नहीं मानता कि आपका डेटा सामान्य वितरण का पालन करता है। यह कच्चे मानों को रैंकों में बदलकर और उनका विश्लेषण करके दो समूहों के वितरणों की तुलना करता है। यह तब एक अच्छा विकल्प बन जाता है जब आपका डेटा टेढ़ा हो, उसमें आउट्लायर हों, या किसी भी अन्य तरीके से सामान्यता की शर्त पूरी न करता हो।
आप इसे Wilcoxon रैंक-सम परीक्षण के नाम से भी देखेंगे। व्यावहारिक रूप से ये समानार्थी हैं।
Mann-Whitney U परीक्षण के लिए कुछ विशिष्ट शर्तें होती हैं। इसे तभी उपयोग करें जब ये सभी लागू हों:
आइए एक उदाहरण देखते हैं।
मान लीजिए आपके पास दो कक्षाएं हैं जिन्हें अलग-अलग तरीकों से पढ़ाया गया, और आप जानना चाहते हैं कि किसमें परीक्षा परिणाम बेहतर रहे। आप स्कोर प्लॉट करते हैं और दिखता है कि वे सामान्य रूप से वितरित नहीं हैं—एक कक्षा में कुछ आउट्लायर वितरण को दाहिने खींच रहे हैं। t-परीक्षण समूह माध्यों की तुलना करता है, इसलिए वे आउट्लायर माध्य को ऊपर खींचते हैं और कक्षा को वास्तविकता से बेहतर दिखाते हैं।
वह टेढ़ा माध्य t-परीक्षण की गणना में चला जाता है, और जो p-मूल्य लौटता है, वह समूहों के बीच के अंतर को परिलक्षित नहीं करता। Mann-Whitney U परीक्षण यह समस्या नहीं दिखाता क्योंकि यह कच्चे स्कोर के बजाय रैंकों के साथ काम करता है। कोई भी एक आउट्लायर अधिकतम उच्चतम रैंक ही ले सकता है, इसलिए वह परिणाम को वैसे नहीं बिगाड़ सकता जैसे माध्य को करता है।
यह क्रमिक डेटा के साथ काम करते समय भी एक पसंदीदा विकल्प है, जैसे 1-5 स्केल पर सर्वे प्रतिक्रियाएँ। वे मान वास्तव में सतत नहीं होते, इसलिए माध्य निकालना विशेष अर्थ नहीं रखता।
यह परीक्षण प्रत्येक समूह के लिए दो U सांख्यिकी देता है। सूत्र यह है:
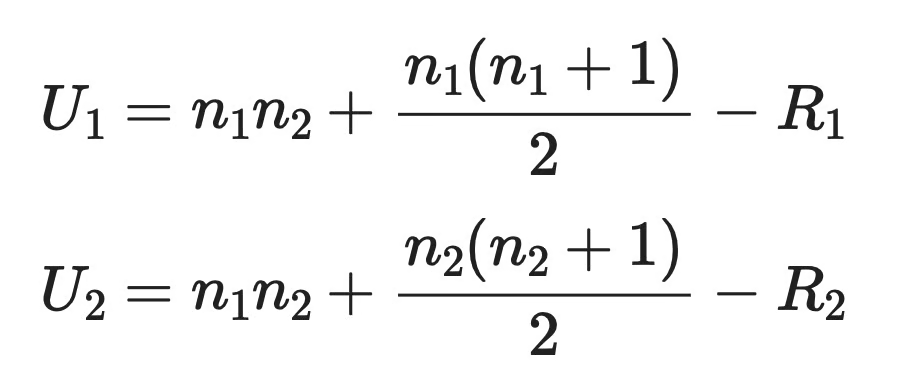
Mann-Whitney U परीक्षण का सूत्र
जहाँ:
n1 और n2 क्रमशः समूह 1 और समूह 2 के सैंपल आकार हैं
R1 और R2 प्रत्येक समूह के रैंक सम (rank sums) हैं—प्रत्येक समूह के प्रेक्षणों को दी गई रैंकों का योग
रैंक सम निकालने के लिए दोनों समूहों के सभी मानों को मिलाया जाता है, उन्हें न्यूनतम से अधिकतम तक क्रमबद्ध किया जाता है, और प्रत्येक मान को एक रैंक दी जाती है। सबसे छोटा मान रैंक 1 लेता है, अगला रैंक 2, और इसी तरह। फिर आप अलग-अलग प्रत्येक समूह से संबंधित रैंकों का योग करते हैं।
परीक्षण सांख्यिकी U1 और U2 में से छोटी होती है। फिर आप इसे एक क्रिटिकल मान से तुलना करते हैं या p-मूल्य निकालने के लिए उपयोग करते हैं।
अच्छी खबर यह है कि आपको यह हाथ से नहीं निकालना पड़ता। Python और R दोनों आपके लिए यह कर देते हैं, जिसे मैं अभी दिखाऊंगा।
Mann-Whitney U परीक्षण t-परीक्षण से अधिक लचीला है, लेकिन फिर भी इसकी तीन धारणाएँ हैं जिनका पालन करना आवश्यक है:
तीसरी धारणा अधिकतर लोगों को उलझाती है।
Mann-Whitney U परीक्षण को अक्सर मध्यकों के परीक्षण के रूप में बताया जाता है, लेकिन यह तभी सत्य है जब दोनों वितरणों के आकार समान हों। यदि वे समान नहीं हैं, तो परिणाम कुछ अधिक सामान्य बात बताता है—क्या एक समूह के मान दूसरे समूह के मानों से ऊँचे रहने की प्रवृत्ति रखते हैं।
Python के scipy.stats मॉड्यूल में Mann-Whitney U परीक्षण के लिए एक फ़ंक्शन है। यहाँ दो कक्षाओं के परीक्षा स्कोर का एक सरल उदाहरण है।
from scipy.stats import mannwhitneyu

class_a = [72, 85, 90, 65, 78, 88, 95, 70, 83, 76]
class_b = [60, 55, 74, 68, 80, 58, 63, 71, 66, 59]

stat, p_value = mannwhitneyu(class_a, class_b, alternative="two-sided")

print(f"U statistic: {stat}")
print(f"P-value: {p_value:.4f}")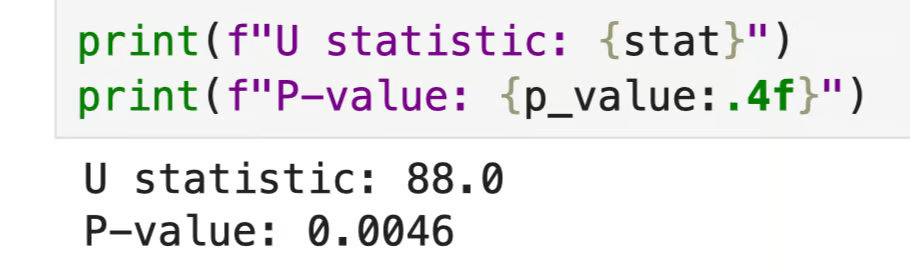
Python में Mann-Whitney U परीक्षण
आर्ग्युमेंट alternative="two-sided" परीक्षण को बताता है कि आप देख रहे हैं कि क्या दोनों समूह किसी भी दिशा में भिन्न हैं। आप पहले से यह नहीं मान रहे कि एक समूह दूसरे से अधिक स्कोर करेगा। यदि आपके पास दिशात्मक परिकल्पना होती, तो आप "less" या "greater" का उपयोग करते।
यहाँ p-मूल्य 0.0046 है, जो 0.05 की मानक सीमा से कम है। इसका अर्थ है कि आप शून्य परिकल्पना को अस्वीकार कर सकते हैं, क्योंकि दोनों कक्षाओं के स्कोर वितरणों में सांख्यिकीय रूप से महत्वपूर्ण अंतर है।
U सांख्यिकी अपने आप में संदर्भ के बिना बहुत कुछ नहीं बताता। आप p-मूल्य पर ध्यान केंद्रित कर सकते हैं यह तय करने के लिए कि अंतर सांख्यिकीय रूप से महत्वपूर्ण है या नहीं, और उस अंतर की दिशा समझने के लिए कच्चे डेटा या मध्यकों को देखें।
R में Mann-Whitney U परीक्षण wilcox.test() फ़ंक्शन से चलता है। मैं पहले वाले परीक्षा स्कोर उदाहरण का ही उपयोग करूँगा।
class_a <- c(72, 85, 90, 65, 78, 88, 95, 70, 83, 76)
class_b <- c(60, 55, 74, 68, 80, 58, 63, 71, 66, 59)

wilcox.test(class_a, class_b, alternative = "two.sided")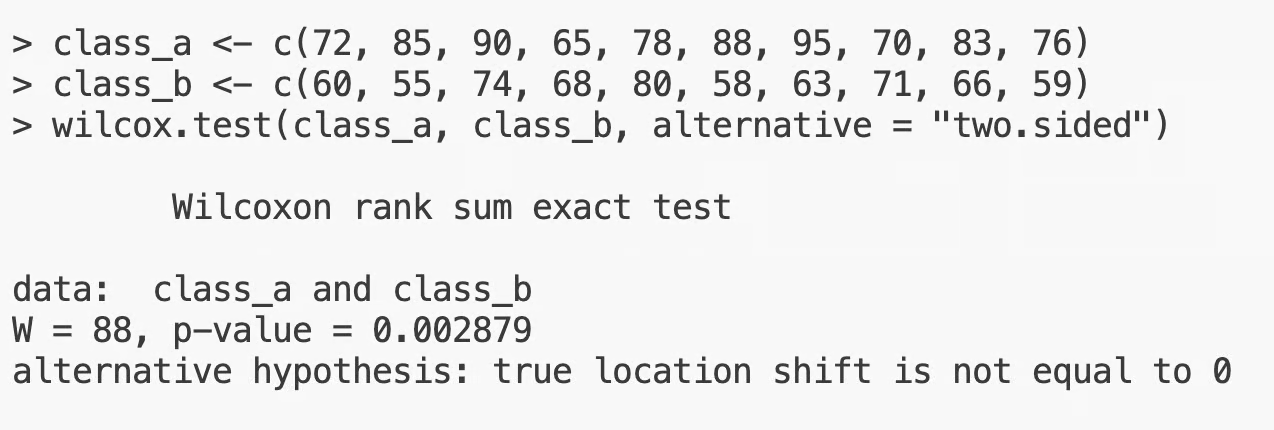
R में Mann-Whitney U परीक्षण
यहाँ W सांख्यिकी U सांख्यिकी के समान ही है—R बस लेबल अलग देता है। व्याख्या Python जैसी ही है: 0.0029 का p-मूल्य 0.05 से कम है, इसलिए दोनों समूहों के बीच सांख्यिकीय रूप से महत्वपूर्ण अंतर है।
आप अपने डेटा में टाईज़ के बारे में एक चेतावनी भी देख सकते हैं।
यह तब होता है जब दोनों समूहों में दो या अधिक मान समान होते हैं, जो रैंकों के आवंटन को प्रभावित करता है। R यह आपके लिए संभाल लेता है, लेकिन यदि बहुत अधिक टाईज़ हैं, तो यह जाँचना उचित है कि आपका डेटा परीक्षण की धारणाओं को पूरा करता है या नहीं।
Mann-Whitney U परीक्षण की शून्य परिकल्पना यह है कि दोनों समूह एक ही वितरण से आते हैं—दूसरे शब्दों में, उनके बीच कोई अंतर नहीं है। आपका कार्य इसके खिलाफ साक्ष्य ढूँढना है।
आप यह p-मूल्य से करते हैं:
ध्यान रखें कि Mann-Whitney U परीक्षण वितरणों की तुलना करता है। एक महत्वपूर्ण परिणाम बताता है कि एक समूह के मान दूसरे समूह के मानों की तुलना में ऊँची रैंक लेने की प्रवृत्ति रखते हैं—यह नहीं कि औसत अधिक है। यदि आप अंतर की दिशा बताना चाहते हैं, तो समूहों के मध्यकों को देखें, माध्यों को नहीं।
ये दोनों परीक्षण एक ही समस्या (दो समूहों की तुलना) हल करते हैं, लेकिन अलग तरीके से, और गलत परीक्षण चुनना आपके परिणामों को प्रभावित करेगा।
t-परीक्षण दो समूहों के माध्यों की तुलना करता है। यह इस धारणा पर बना है कि आपका डेटा सामान्य वितरण का पालन करता है, और जब यह सत्य है, यह अच्छा परीक्षण है।
समस्या उस धारणा में है। यदि आपका डेटा टेढ़ा है या छोटा नमूना है जहाँ सामान्यता की पुष्टि कठिन है, तो t-परीक्षण के परिणाम अविश्वसनीय हो सकते हैं। माध्य चरम मानों से खिंच जाता है, और p-मूल्य यह दिखाता है।
t-परीक्षण का उपयोग करें जब:
Mann-Whitney U परीक्षण माध्यों के बजाय वितरणों की तुलना करता है। यह दोनों समूहों के सभी मानों को साथ रैंक करता है और जाँचता है कि क्या एक समूह लगातार दूसरे से ऊँची रैंक लेता है। क्योंकि यह रैंकों के साथ काम करता है, आउट्लायर और टेढ़ापन परिणाम को उसी तरह नहीं बिगाड़ते।
जब आपका डेटा वास्तव में सामान्य रूप से वितरित हो, t-परीक्षण अंतर को अधिक विश्वसनीय रूप से पकड़ता है। Mann-Whitney U परीक्षण अधिक लचीला है, लेकिन आप कुछ संवेदनशीलता छोड़ते हैं।
Mann-Whitney U परीक्षण का उपयोग करें जब:
यहाँ दोनों का एक त्वरित तुलना चार्ट है:
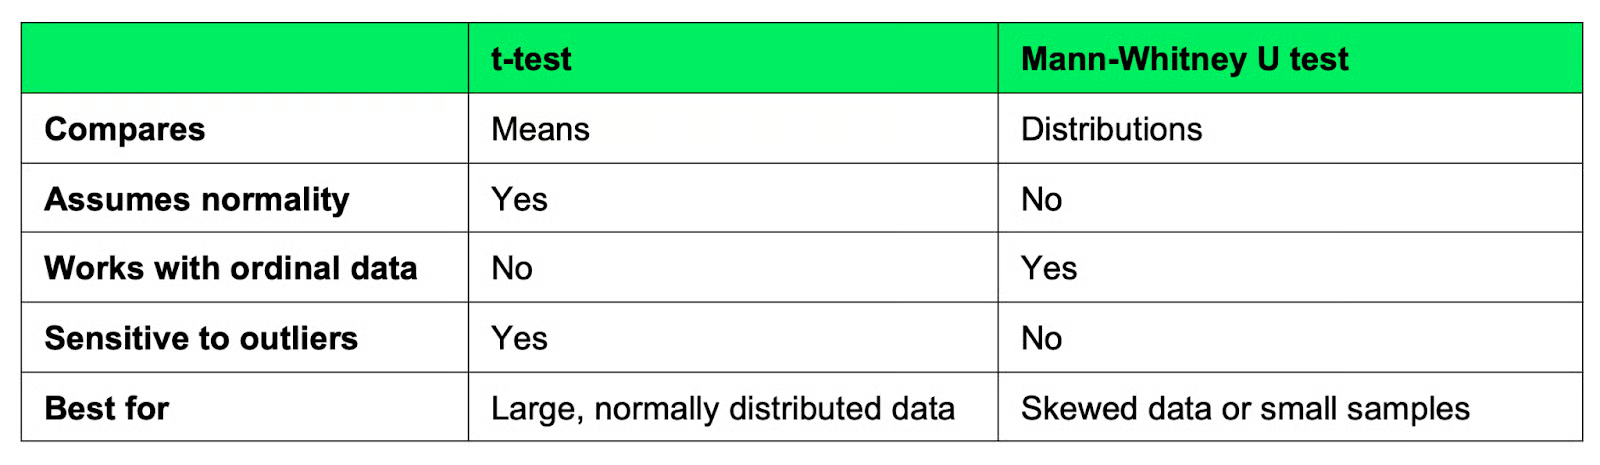
t-परीक्षण बनाम Mann-Whitney U परीक्षण
संदेह होने पर, पहले अपना वितरण जाँचें। यदि वह कुछ हद तक सामान्य है, तो t-परीक्षण लें। यदि नहीं, तो Mann-Whitney U परीक्षण अधिक सुरक्षित विकल्प है।
इस परीक्षण से जुड़ी अधिकतर गलतियाँ इस बात को न समझने से आती हैं कि यह वास्तव में करता क्या है। यहाँ वे हैं जो सबसे अधिक दिखती हैं।
यह सबसे आम है। Mann-Whitney U परीक्षण वितरणों की तुलना करता है, माध्यों की नहीं। एक महत्वपूर्ण परिणाम बताता है कि एक समूह के मान ऊँची रैंक लेने की प्रवृत्ति रखते हैं—यह नहीं कि औसत अधिक है। यदि आपको अंतर का वर्णन करना हो, तो माध्यों के बजाय मध्यकों की रिपोर्ट करें।
यदि दोनों समूहों के वितरण आकार अलग हैं—एक दाएँ टेढ़ा है, दूसरा सममित—तो आप परिणाम की व्याख्या मध्यकों की तुलना के रूप में नहीं कर सकते। परीक्षण चलता है, पर आउटपुट समग्र वितरणों में अंतर दिखाता है, केंद्र में शिफ्ट नहीं। मध्यकों पर निष्कर्ष निकालने से पहले अपने वितरणों की जाँच करें।
0.05 से कम p-मूल्य का अर्थ है कि दोनों समूहों के वितरणों के बीच सांख्यिकीय रूप से महत्वपूर्ण अंतर है। यह नहीं बताता कि अंतर कितना बड़ा है या व्यावहारिक रूप से मायने रखता है या नहीं। इसके लिए, आपको प्रभाव आकार (effect size) अलग से निकालना होगा और प्रत्येक समूह के मध्यकों को देखना होगा।
Mann-Whitney U परीक्षण दो स्वतंत्र समूहों के लिए है। यदि आपका डेटा युग्मित है—एक ही विषयों को दो बार मापा गया, या मेल खाते जोड़े—तो आपको इसके बजाय Wilcoxon signed-rank परीक्षण की आवश्यकता है।
Mann-Whitney U परीक्षण हर स्थिति के लिए सही उपकरण नहीं है। यहाँ वे परिस्थितियाँ हैं जब आपको कुछ और अपनाना चाहिए।
यदि वही विषय दोनों समूहों में आते हैं—पहले और बाद के माप, या मेल खाते जोड़े—तो दोनों नमूने स्वतंत्र नहीं हैं। Mann-Whitney U परीक्षण स्वतंत्रता मानता है, इसलिए यहाँ इसका उपयोग प्रेक्षणों के संबंध को नजरअंदाज कर देता है और अविश्वसनीय परिणाम देता है। इसके बजाय Wilcoxon signed-rank परीक्षण का उपयोग करें।
Mann-Whitney U परीक्षण एक समय में केवल दो समूहों की तुलना करता है। यदि आप तीन या अधिक समूहों की तुलना कर रहे हैं, तो Kruskal-Wallis परीक्षण का उपयोग करें, जो एक-मार्ग ANOVA का नॉन-पैरामीट्रिक समकक्ष है और कई समूहों को संभाल सकता है।
Mann-Whitney U परीक्षण का मुख्य लाभ यह है कि यह सामान्यता नहीं मानता। यदि आपका डेटा सामान्य रूप से वितरित है और आपका सैंपल इतना बड़ा है कि इसे पुष्टि कर सके, तो t-परीक्षण बेहतर विकल्प है। ऐसी स्थिति में इसकी सांख्यिकीय शक्ति अधिक होती है, यानी वास्तविक अंतर होने पर उसे पकड़ने की संभावना अधिक होती है।
जब आपका डेटा सामान्य रूप से वितरित नहीं होता, तब Mann-Whitney U परीक्षण एक बेहतरीन समाधान है, जबकि t-परीक्षण वहाँ उपयुक्त नहीं होता।
यह कच्चे मानों के बजाय रैंकों के साथ काम करता है, इसलिए वे धारणाएँ टाल देता है जो टेढ़े या छोटे सैंपल वाले डेटा पर पैरामीट्रिक परीक्षणों को अविश्वसनीय बनाती हैं। यही इसे वास्तविक-जीवन विश्लेषण के लिए अच्छा परीक्षण बनाता है, जहाँ डेटा शायद ही मनमुताबिक व्यवहार करता है।
यहाँ बड़ा सबक है—परीक्षण का चयन। कोई एक परीक्षण हर डेटासेट पर काम नहीं करता। हमेशा पहले अपने डेटा की जाँच करें—उसका वितरण, संरचना और सैंपल आकार—और इन्हीं विशेषताओं के आधार पर चुनाव करें। सही परीक्षण वही है जो आपके डेटा के अनुरूप हो।
यदि आप सांख्यिकी में नए हैं या विषय में गहराई से जाना चाहते हैं, तो हमारा Statistician in R ट्रैक आपको केवल 52 घंटों की सामग्री में नौकरी-तैयार बना देगा।
DataCamp के साथ सीखें
Track
course
course