While grouping by a single column is common, grouping by multiple columns allows you to summarize large datasets by grouping rows that share common values, making it easier to identify patterns, trends, and outliers.
In this guide, I will explain how the GROUP BY clause works, advanced grouping methods, and best practices. If you are new to SQL, consider starting with our Introduction to SQL course or Intermediate SQL course to build a strong foundation. Also, I find the SQL Basics Cheat Sheet, which you can download, is a helpful reference because it has all the most common SQL functions.
Fundamentals of GROUP BY in SQL
Before I explain how to group by multiple columns in SQL, let’s first understand the basic concepts of the GROUP BY clause.
Basic principles of GROUP BY
The GROUP BY clause in SQL organizes identical data into groups. It scans rows in a database and then clusters rows with the same values in the specified columns, enabling data aggregation within these groups.
You can use the GROUP BY clause with aggregate functions such as COUNT(), SUM(), AVG(), MIN(), and MAX() to perform calculations for summaries on each group of rows.
Suppose you're analyzing sales data and want to know the total revenue per region. GROUP BY allows you to group sales by region and compute the sum for each in a single query.
Transitioning from single-column to multiple-column grouping
The database processes the GROUP BY clause on a single column by scanning through the rows and segmenting them according to the distinct values in that column. Each distinct value forms a group, and aggregation functions calculate results within each group.
However, when you introduce multiple columns, SQL groups the data based on every unique combination of those columns. This means the database partitions the data into smaller, more refined groups defined by all specified column values.
This partitioning approach allows for multidimensional aggregation. This is useful for detailed business intelligence and analytics. It enables in-depth analysis by summarizing data at the intersection of several dimensions. For example, you can group sales by region and product category.
Understanding Multiple Column Grouping
As you have seen, grouping data by multiple columns lets you get more insights. Now let’s look at how SQL handles this grouping.
Mechanics of multiple column grouping
When you group by more than one column in SQL, the database engine treats the column combination as composite keys. Each of these unique combinations forms a distinct group. For example, grouping sales data by region and product_type generates a separate group for each unique pair, such as ('West', 'Electronics'), ('East', 'Furniture'), and so on.
This leads to a hierarchical pattern of subgrouping, where the first column creates the primary groups, the second column segments those primary groups further into subgroups, and so forth. This layered grouping enhances data granularity by breaking information into detailed categories.
You should also note that there is a difference between hierarchical and non-hierarchical grouping. Hierarchical grouping follows the column grouping and subgrouping of the columns following a specific sequence. On the other hand, non-hierarchical grouping takes each column as another dimension, and does not follow an inherent hierarchy. Still, non-hierarchical grouping creates useful combinations for analysis, like when you want to group product sales by season.
Importance and implications of column order
In SQL, the order in which you list columns in a GROUP BY clause really matters. When you group by multiple columns, SQL treats those columns together as a combined key, kind of like putting several pieces together to identify each group uniquely.
SQL processes the columns from left to right. That means it first groups the data by the first column you list, then, within each of those groups, it further groups by the next column, and so on. This order can influence how efficiently the database handles the query, how it uses indexes, and how intermediate groupings are built, particularly when working with large datasets.
For instance, if you wanted to group your data by region and product, the data is first grouped by region, and then within each region, it’s grouped by product. But if you switch the order to (product, region), you change the grouping hierarchy, which can lead to different results and interpretations in your reports.
Syntax and Mechanics
Let's examine the syntax and variations of the GROUP BY clause in SQL to fully understand it.
Syntax for multiple column GROUP BY
To use a GROUP BY clause in multiple columns, you must list each column in the SELECT statement, separated by commas. The database will then group rows based on the unique combinations of those column values.
SELECT column1, column2, AGGREGATE_FUNCTION(column3)
FROM table_name
GROUP BY column1, column2;
Always ensure that all columns used in the SELECT statement, which are not part of aggregate functions, must appear in the GROUP BY clause to avoid errors and ensure readable aggregation.
Let’s say you have a Sales table with the following structure:
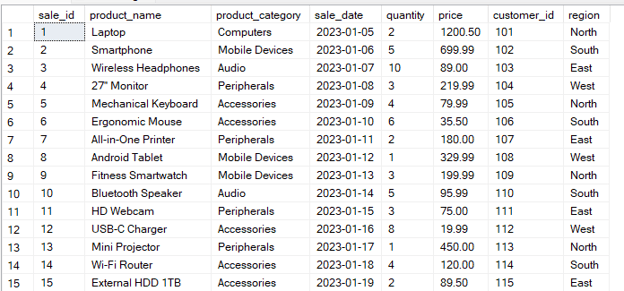
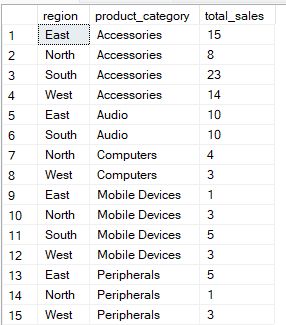
The query below groups the data by region and product_category columns. Then it calculates the total_sales for each group combination.
SELECT region, product_category, SUM(quantity) AS total_sales
FROM Sales
GROUP BY region, product_category;
Advanced syntax variations
Below are the different methods you can use the GROUP BY clause on multiple columns in SQL:
Numbered column references
Instead of using column names, SQL allows you to indicate the position of columns in the GROUP BY clause. From our previous example, 1 refers to the region column and 2 to the product_category column. This method is supported in MySQL and PostgreSQL, but not SQL Server.
SELECT region, product_category, SUM(quantity) AS total_sales
FROM Sales
GROUP BY 1, 2;
Expression-based grouping
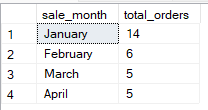
You can also group by derived expressions or computed values. This is useful for grouping by transformed data, such as year from a date or substrings. For example, the query below groups the sales by month derived from sale_date.
SELECT
DATENAME(MONTH, sale_date) AS sale_month,
COUNT(*) AS total_orders
FROM Sales
GROUP BY DATENAME(MONTH, sale_date), MONTH(sale_date)
ORDER BY MONTH(sale_date);
Selecting multiple columns but grouping by only one
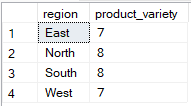
SQL allows you to select multiple columns while grouping by only one, but only if the additional columns are used inside aggregate functions. In the example below, only region is in the GROUP BY clause, while product_id is used in an aggregate function (COUNT(DISTINCT)), making the query valid.
SELECT region, COUNT(DISTINCT sale_id) AS product_variety
FROM Sales
GROUP BY region;
I recommend trying our Analyzing and Formatting PostgreSQL Sales Data project to understand how to manipulate data in PostgreSQL. Also, the MySQL Basics Cheat Sheet will be a handy reference guide to basic querying tables, filtering data, and aggregating data, especially if you prefer using MySQL.
Aggregate Functions with GROUP BY
The advantage of the GROUP BY clause in SQL is that you can use it with aggregate functions to get a summary of grouped data.
Common aggregate functions in multi-column grouping
The aggregate functions offer multi-dimensional insights across various data combinations when grouping by multiple columns. These are the commonly used functions with the GROUP BY clause:
-
SUM(): Adds up all values in a numeric column for each group.
-
COUNT(): Counts the number of rows or non-null values in each group.
-
AVG(): Calculates the average value within each group.
-
MIN(): Finds the smallest value in each group.
-
MAX(): Finds the largest value in each group.
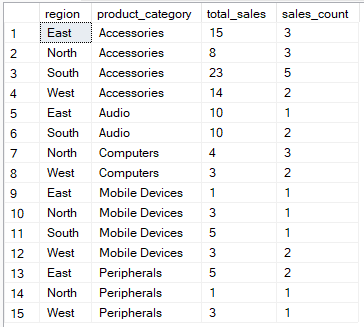
For example, the query below calculates the total sales and count of sales records for each combination of region and product category
-- Group by region, product_category then aggregate
SELECT region, product_category, SUM(quantity) AS total_sales, COUNT(*) AS sales_count
FROM Sales
GROUP BY region, product_category;
GROUP BY without aggregate functions
In the above examples, you’ve seen that the GROUP BY clause is used with aggregate functions. However, you can use it without aggregation if you want to group rows by the specified columns, but without the summary.
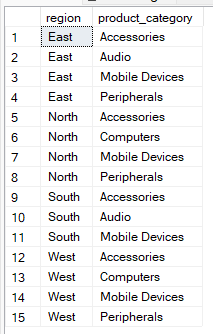
For example, the query below outputs unique pairs of region and product category without aggregation. Therefore, you can use this method to check for data consistency.
SELECT region, product_category
FROM Sales
GROUP BY region, product_category;
Advanced Grouping Features
Now that we have looked at how we can group by multiple columns, let’s look at the different advanced grouping operations used with the GROUP BY clause.
ROLLUP operation
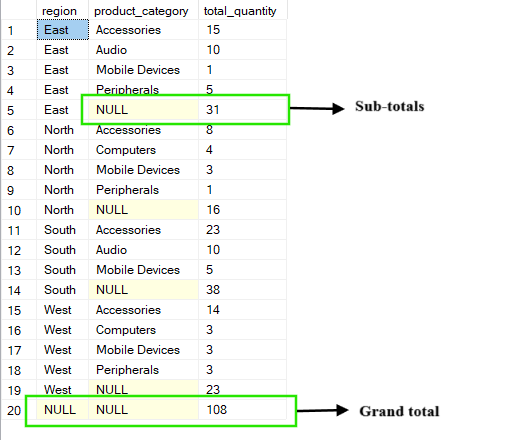
The ROLLUP operation builds on the standard GROUP BY clause by creating summary levels that roll up along the specified columns. Besides showing detailed groups, it also adds subtotals and a grand total by aggregating step-by-step from right to left through the columns you group by.
For example, in the query below, you get the total_quantity for each combination of region and product_category. The results include subtotals for each region (where product_category appears as NULL) and a grand total that sums everything across all regions and categories.
SELECT region, product_category, SUM(quantity) AS total_quantity
FROM Sales
GROUP BY ROLLUP(region, product_category);
CUBE operation
The CUBE operation generates all the possible combinations of the grouping columns. Unlike the ROLLUP operation, which produces a hierarchy, CUBE produces a complete data cube of aggregations.
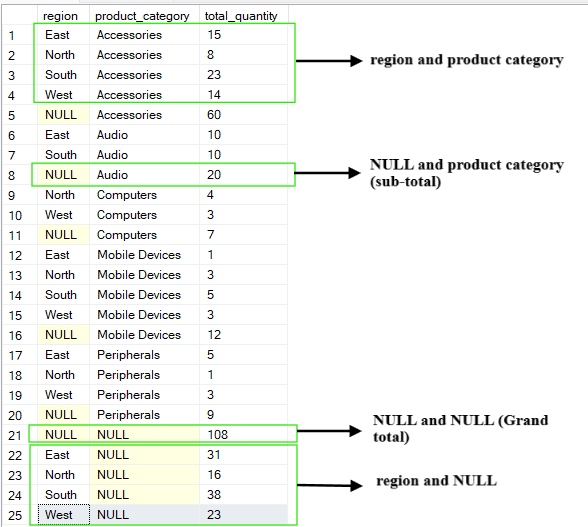
It provides a cross-tabulation of aggregations for every subset of the specified columns. The output of the CUBE operation includes summaries for each column, every combination of columns, and the grand total.
For example, if we query the above table and group by the columns (region, product_category), the CUBE operation will produce the following combinations:
-
(region, product_category)
-
(region, NULL)
-
(NULL, product_category)
-
(NULL, NULL) which is the grand total
SELECT region, product_category, SUM(quantity) AS total_quantity
FROM Sales
GROUP BY CUBE(region, product_category);
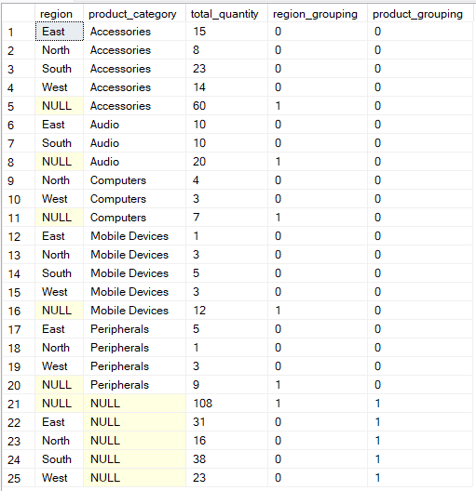
If you want a more flexible control over how your data is grouped, then the GROUPING SETS operation allows you to explicitly define multiple groupings in a single query.
In this case, the GROUPING() function provides metadata about which columns are aggregated in each row of the result, identifying NULLs that represent subtotal or total rows rather than actual missing data.
SELECT region, product_category, SUM(quantity) AS total_quantity,
GROUPING(region) AS region_grouping,
GROUPING(product_category) AS product_grouping
FROM Sales
GROUP BY GROUPING SETS (
(region, product_category),
(region),
(product_category),
()
);
When writing queries that group by multiple columns, it’s important to optimize them for better efficiency and overall database performance. Below are some practical tips that I have used to help with query optimization and resource management
Query optimization techniques
To keep your queries running smoothly and using minimal resources:
-
Identify performance bottlenecks: GROUP BY queries can slow down when dealing with large datasets because of scanning, sorting, and aggregating lots of data. To avoid this issue, always filter early with a WHERE clause and avoid fetching data you don’t need.
-
Use indexing effectively: Indexing columns speeds up the GROUP BY performance. Creating composite indexes on the columns used in the GROUP BY clause helps the database engine quickly locate and group rows without expensive full table scans or sorts.
-
Limit columns: Only include columns necessary for your grouping and analysis to reduce complexity and improve performance.
-
Leverage query plans: Where available, check execution plans or use query hints to guide the database optimizer towards the best strategies.
Memory allocation and computational resources
Memory plays a big role in how well GROUP BY queries perform. Sorting and grouping data often require holding intermediate data in memory. If there’s not enough memory, things slow down considerably.
To manage resources better:
- Ensure your database has enough memory allocated to handle these aggregation tasks.
- Use parallel processing features, if your database supports them, to spread the workload across multiple CPUs.
- Keep an eye on temporary storage and cache usage to avoid bottlenecks.
Also, remember that the size of your data has a big impact on performance. Large datasets with many unique group combinations use more memory and processing power. Techniques like partitioning large tables, creating summary tables ahead of time, or using materialized views help keep things manageable.
Integration with Other SQL Clauses
The GROUP BY clause works well with other SQL clauses, making your queries more powerful and flexible. Next, you’ll see practical examples of how to combine GROUP BY with different SQL clauses to improve your analysis.
Interaction with WHERE and HAVING clauses
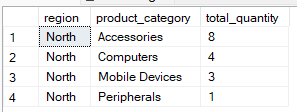
The WHERE clause filters rows before grouping occurs. It limits the dataset so that only the required rows are included in the aggregation process. For example, the query below groups by region and product_category` but includes records where the region is ‘North.’
SELECT region, product_category, SUM(quantity) AS total_quantity
FROM Sales
WHERE region = 'North'
GROUP BY region, product_category;
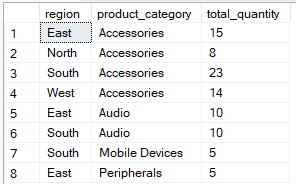
The region and product_category but includes records where the total_quantity` is more than 5.
SELECT region, product_category, SUM(quantity) AS total_quantity
FROM Sales
GROUP BY region, product_category
HAVING SUM(quantity) > 4;
Interaction with ORDER BY and JOIN operations
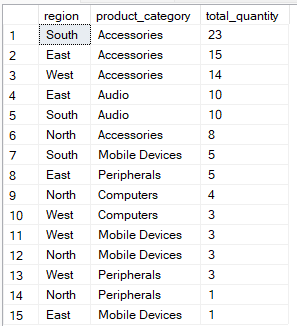
In SQL order of execution, the ORDER BY clause comes after the GROUP BY clause and is used to sort the grouped results, making them easier to read or process further. By using the right indexes and carefully choosing the column order in the ORDER BY clause, you can speed up your query by cutting down on the work needed to sort the data.
For example, this query groups data by region and product_category, then sorts the results so that the groups with the highest total_quantity appear first.
SELECT region, product_category, SUM(quantity) AS total_quantity
FROM Sales
GROUP BY region, product_category
ORDER BY total_quantity DESC;
You can also combine JOIN operations with the GROUP BY clause to group data across multiple related tables. You should be careful when using this method, as it can introduce complexity due to joining data with larger sizes.
SELECT
c.region,
p.product_category,
COUNT(*) AS sales_count
FROM customers c
JOIN sales_data s
ON c.customer_id = s.customer_id
JOIN products p
ON s.product_id = p.product_id
GROUP BY c.region, p.product_category
ORDER BY c.region, sales_count DESC;
I recommend taking our Joining Data in SQL course to learn the different types of joins and how to use them in nested queries. You can download our SQL Joins Cheat Sheet guide for reference to learn more about joining data in SQL.
Interaction with CASE expressions in GROUP BY
The CASE expression in GROUP BY allows for custom groupings by transforming column values dynamically within the grouping process.
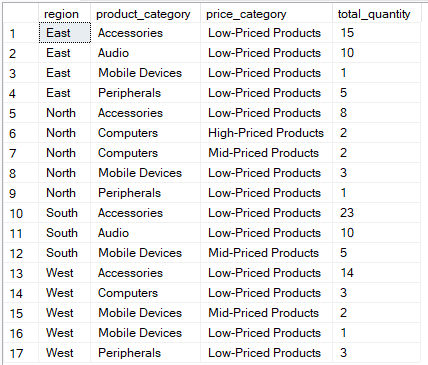
The query below categorizes products by price range and count total quantity sold per region & product category.
SELECT
region,
product_category,
CASE
WHEN price >= 1000 THEN 'High-Priced Products'
WHEN price >= 500 THEN 'Mid-Priced Products'
ELSE 'Low-Priced Products'
END AS price_category,
SUM(quantity) AS total_quantity
FROM Sales
GROUP BY
region,
product_category,
CASE
WHEN price >= 1000 THEN 'High-Priced Products'
WHEN price >= 500 THEN 'Mid-Priced Products'
ELSE 'Low-Priced Products'
END
ORDER BY
region,
product_category,
total_quantity DESC;
Common Patterns and Best Practices
As you continue to use the GROUP BY clause to group multiple columns, you will recognize the recurring patterns to improve your use. We will discuss these common occurrences with performance considerations.
Hierarchical and temporal analysis patterns
You may have noticed that most datasets have inherent hierarchies, such as geography (continent → country → city), product categories, or organizational structures. Therefore, the GROUP BY clause is ideal for summarizing data at different levels of these hierarchies.
When presented with data with dates and time stamps, temporal analysis can help identify trends, seasonality, and time-based behavior by grouping by date parts such as year, quarter, month, or day.
Earlier, we talked about two types of grouping patterns. Hierarchical groupings involve columns that have a natural, nested relationship, like grouping first by department, then within each department by team. In contrast, non-hierarchical groupings mix unrelated dimensions, such as product type and payment method, showing combinations without any implied order or structure.
When using GROUP BY with multiple columns, you can improve performance by following these practical tips:
-
Limit grouping columns: Always ensure you group by columns necessary for the analysis to reduce the computational overhead of groups.
-
Index optimization: Ensure that the grouped columns are indexed to speed up query performance by helping the database handle sorting operations more efficiently.
-
Filter early: Use the WHERE clause to limit your dataset before grouping to reduce the amount of data being processed.
-
Use query plans and hints: Review execution plans or add query hints if your database supports them to help optimize the grouping process.
-
Leverage advanced SQL features: Consider using techniques like ROLLUP or GROUPING SETS to create summaries more efficiently and avoid running repetitive queries, especially when working with hierarchical or multi-dimensional data.
Removing duplicates and data cleansing
GROUP BY can also be a handy way to clean up your data by removing duplicates based on specific fields. This is useful when your dataset has multiple identical or partially duplicate rows.
For example, to remove duplicate sales records, you will group by region, product_category, and product_name, and then select the highest price per group to keep the most relevant record.
SELECT
region,
product_category,
product_name,
MAX(price) AS price,
SUM(quantity) AS total_quantity
FROM Sales
GROUP BY
region,
product_category,
product_name
ORDER BY
region,
product_category,
product_name;
Troubleshooting and Common Pitfalls
When working with GROUP BY on multiple columns, keep in mind these common pitfalls:
Column specification and data type issues
One of the most frequent errors in the GROUP BY queries is related to incorrect column specification. SQL requires that when selecting multiple columns not wrapped in an aggregate function, they must be included in the GROUP BY clause. Failing to do so results in an error. So, always include the non-aggregated columns in the GROUP BY clause if included in the SELECT statement.
You might also run into errors if the data you're grouping has mismatches, especially when you're grouping by expressions. Let’s assume you're grouping your data by a formatted date. In that case, you will get an error if the date values have different formats or levels of precision, leading to unexpected or incorrect results.
Using GROUP BY queries can sometimes slow down your database, especially if you’re grouping by columns with many unique values (high cardinality) or if those columns aren’t indexed. Large datasets also need enough memory to handle the sorting and grouping steps, which adds to the load.
To avoid these issues, always index the columns and filter using WHERE to limit the data you query.
Also, it’s important to know how SQL handles NULL values in grouping: all NULLs in a grouping column are treated as the same group, no matter how many there are. However, NULL is never considered equal to any actual (non-NULL) value, so those groups stay distinct.
Conclusion
Using the GROUP BY clause to group multiple columns in SQL is a powerful technique that enables deeper, multi-dimensional analysis by aggregating data across combinations of fields. It allows analysts to go beyond basic summaries and gain more insights into patterns and relationships within data. This capability is important for reporting, performance tracking, and decision-making in modern business environments..
As data grows in complexity and volume, SQL remains a foundational tool in analytics. To further enhance your skills, consider exploring window functions, common table expressions (CTEs), and materialized views, which open the door to even more advanced data transformations and reporting workflows.
I recommend taking our PostgreSQL Summary Stats and Window Functions course to learn how to write queries for business analytics using Window functions like a pro. I also challenge you to try our projects: Analyzing Industry Carbon Emissions and Analyzing Motorcycle Part Sales to test your SQL skills and demonstrate your mastery of using SQL to solve business problems.


While grouping by a single column is common, grouping by multiple columns allows you to summarize large datasets by grouping rows that share common values, making it easier to identify patterns, trends, and outliers.
In this guide, I will explain how the
GROUP BYclause works, advanced grouping methods, and best practices. If you are new to SQL, consider starting with our Introduction to SQL course or Intermediate SQL course to build a strong foundation. Also, I find the SQL Basics Cheat Sheet, which you can download, is a helpful reference because it has all the most common SQL functions.Fundamentals of GROUP BY in SQL
Before I explain how to group by multiple columns in SQL, let’s first understand the basic concepts of the
GROUP BYclause.Basic principles of GROUP BY
The
GROUP BYclause in SQL organizes identical data into groups. It scans rows in a database and then clusters rows with the same values in the specified columns, enabling data aggregation within these groups.You can use the
GROUP BYclause with aggregate functions such asCOUNT(),SUM(),AVG(),MIN(), andMAX()to perform calculations for summaries on each group of rows.Suppose you're analyzing sales data and want to know the total revenue per region.
GROUP BYallows you to group sales by region and compute the sum for each in a single query.Transitioning from single-column to multiple-column grouping
The database processes the
GROUP BYclause on a single column by scanning through the rows and segmenting them according to the distinct values in that column. Each distinct value forms a group, and aggregation functions calculate results within each group.However, when you introduce multiple columns, SQL groups the data based on every unique combination of those columns. This means the database partitions the data into smaller, more refined groups defined by all specified column values.
This partitioning approach allows for multidimensional aggregation. This is useful for detailed business intelligence and analytics. It enables in-depth analysis by summarizing data at the intersection of several dimensions. For example, you can group sales by region and product category.
Understanding Multiple Column Grouping
As you have seen, grouping data by multiple columns lets you get more insights. Now let’s look at how SQL handles this grouping.
Mechanics of multiple column grouping
When you group by more than one column in SQL, the database engine treats the column combination as composite keys. Each of these unique combinations forms a distinct group. For example, grouping sales data by
regionandproduct_typegenerates a separate group for each unique pair, such as ('West', 'Electronics'), ('East', 'Furniture'), and so on.This leads to a hierarchical pattern of subgrouping, where the first column creates the primary groups, the second column segments those primary groups further into subgroups, and so forth. This layered grouping enhances data granularity by breaking information into detailed categories.
You should also note that there is a difference between hierarchical and non-hierarchical grouping. Hierarchical grouping follows the column grouping and subgrouping of the columns following a specific sequence. On the other hand, non-hierarchical grouping takes each column as another dimension, and does not follow an inherent hierarchy. Still, non-hierarchical grouping creates useful combinations for analysis, like when you want to group product sales by season.
Importance and implications of column order
In SQL, the order in which you list columns in a GROUP BY clause really matters. When you group by multiple columns, SQL treats those columns together as a combined key, kind of like putting several pieces together to identify each group uniquely.
SQL processes the columns from left to right. That means it first groups the data by the first column you list, then, within each of those groups, it further groups by the next column, and so on. This order can influence how efficiently the database handles the query, how it uses indexes, and how intermediate groupings are built, particularly when working with large datasets.
For instance, if you wanted to group your data by region and product, the data is first grouped by region, and then within each region, it’s grouped by product. But if you switch the order to (product, region), you change the grouping hierarchy, which can lead to different results and interpretations in your reports.
Syntax and Mechanics
Let's examine the syntax and variations of the
GROUP BYclause in SQL to fully understand it.Syntax for multiple column GROUP BY
To use a
GROUP BYclause in multiple columns, you must list each column in theSELECTstatement, separated by commas. The database will then group rows based on the unique combinations of those column values.Always ensure that all columns used in the
SELECTstatement, which are not part of aggregate functions, must appear in theGROUP BYclause to avoid errors and ensure readable aggregation.Let’s say you have a
Salestable with the following structure:The query below groups the data by
regionandproduct_categorycolumns. Then it calculates thetotal_salesfor each group combination.Advanced syntax variations
Below are the different methods you can use the
GROUP BYclause on multiple columns in SQL:Numbered column references
Instead of using column names, SQL allows you to indicate the position of columns in the
GROUP BYclause. From our previous example,1refers to theregioncolumn and2to theproduct_categorycolumn. This method is supported in MySQL and PostgreSQL, but not SQL Server.Expression-based grouping
You can also group by derived expressions or computed values. This is useful for grouping by transformed data, such as year from a date or substrings. For example, the query below groups the sales by month derived from
sale_date.Selecting multiple columns but grouping by only one
SQL allows you to select multiple columns while grouping by only one, but only if the additional columns are used inside aggregate functions. In the example below, only
regionis in theGROUP BYclause, whileproduct_idis used in an aggregate function(COUNT(DISTINCT)), making the query valid.I recommend trying our Analyzing and Formatting PostgreSQL Sales Data project to understand how to manipulate data in PostgreSQL. Also, the MySQL Basics Cheat Sheet will be a handy reference guide to basic querying tables, filtering data, and aggregating data, especially if you prefer using MySQL.
Aggregate Functions with GROUP BY
The advantage of the GROUP BY clause in SQL is that you can use it with aggregate functions to get a summary of grouped data.
Common aggregate functions in multi-column grouping
The aggregate functions offer multi-dimensional insights across various data combinations when grouping by multiple columns. These are the commonly used functions with the
GROUP BYclause:SUM(): Adds up all values in a numeric column for each group.COUNT(): Counts the number of rows or non-null values in each group.AVG(): Calculates the average value within each group.MIN(): Finds the smallest value in each group.MAX(): Finds the largest value in each group.For example, the query below calculates the total sales and count of sales records for each combination of region and product category
GROUP BY without aggregate functions
In the above examples, you’ve seen that the
GROUP BYclause is used with aggregate functions. However, you can use it without aggregation if you want to group rows by the specified columns, but without the summary.For example, the query below outputs unique pairs of region and product category without aggregation. Therefore, you can use this method to check for data consistency.
Advanced Grouping Features
Now that we have looked at how we can group by multiple columns, let’s look at the different advanced grouping operations used with the
GROUP BYclause.ROLLUP operation
The ROLLUP operation builds on the standard
GROUP BYclause by creating summary levels that roll up along the specified columns. Besides showing detailed groups, it also adds subtotals and a grand total by aggregating step-by-step from right to left through the columns you group by.For example, in the query below, you get the
total_quantityfor each combination ofregionandproduct_category.The results include subtotals for each region (whereproduct_categoryappears asNULL) and a grand total that sums everything across all regions and categories.CUBE operation
The
CUBEoperation generates all the possible combinations of the grouping columns. Unlike theROLLUPoperation, which produces a hierarchy,CUBEproduces a complete data cube of aggregations.It provides a cross-tabulation of aggregations for every subset of the specified columns. The output of the
CUBEoperation includes summaries for each column, every combination of columns, and the grand total.For example, if we query the above table and group by the columns (
region,product_category), theCUBEoperation will produce the following combinations:(
region,product_category)(
region,NULL)(
NULL,product_category)(
NULL,NULL) which is the grand totalGROUPING SETS and metadata
If you want a more flexible control over how your data is grouped, then the
GROUPING SETSoperation allows you to explicitly define multiple groupings in a single query.In this case, the
GROUPING()function provides metadata about which columns are aggregated in each row of the result, identifying NULLs that represent subtotal or total rows rather than actual missing data.Performance Considerations and Optimization
When writing queries that group by multiple columns, it’s important to optimize them for better efficiency and overall database performance. Below are some practical tips that I have used to help with query optimization and resource management
Query optimization techniques
To keep your queries running smoothly and using minimal resources:
Identify performance bottlenecks:
GROUP BYqueries can slow down when dealing with large datasets because of scanning, sorting, and aggregating lots of data. To avoid this issue, always filter early with aWHEREclause and avoid fetching data you don’t need.Use indexing effectively: Indexing columns speeds up the
GROUP BYperformance. Creating composite indexes on the columns used in theGROUP BYclause helps the database engine quickly locate and group rows without expensive full table scans or sorts.Limit columns: Only include columns necessary for your grouping and analysis to reduce complexity and improve performance.
Leverage query plans: Where available, check execution plans or use query hints to guide the database optimizer towards the best strategies.
Memory allocation and computational resources
Memory plays a big role in how well
GROUP BYqueries perform. Sorting and grouping data often require holding intermediate data in memory. If there’s not enough memory, things slow down considerably.To manage resources better:
Also, remember that the size of your data has a big impact on performance. Large datasets with many unique group combinations use more memory and processing power. Techniques like partitioning large tables, creating summary tables ahead of time, or using materialized views help keep things manageable.
Integration with Other SQL Clauses
The
GROUP BYclause works well with other SQL clauses, making your queries more powerful and flexible. Next, you’ll see practical examples of how to combine GROUP BY with different SQL clauses to improve your analysis.Interaction with WHERE and HAVING clauses
The
WHEREclause filters rows before grouping occurs. It limits the dataset so that only the required rows are included in the aggregation process. For example, the query below groups byregion andproduct_category` but includes records where the region is ‘North.’The
HAVING clause, on the other hand, filters after aggregation. It's used to limit which groups appear in the final result based on aggregate values. The query below groups byregion andproduct_categorybut includes records where thetotal_quantity` is more than 5.Interaction with ORDER BY and JOIN operations
In SQL order of execution, the
ORDER BYclause comes after theGROUP BYclause and is used to sort the grouped results, making them easier to read or process further. By using the right indexes and carefully choosing the column order in theORDER BYclause, you can speed up your query by cutting down on the work needed to sort the data.For example, this query groups data by
regionandproduct_category, then sorts the results so that the groups with the highesttotal_quantityappear first.You can also combine
JOINoperations with theGROUP BYclause to group data across multiple related tables. You should be careful when using this method, as it can introduce complexity due to joining data with larger sizes.I recommend taking our Joining Data in SQL course to learn the different types of joins and how to use them in nested queries. You can download our SQL Joins Cheat Sheet guide for reference to learn more about joining data in SQL.
Interaction with CASE expressions in GROUP BY
The
CASEexpression inGROUP BYallows for custom groupings by transforming column values dynamically within the grouping process.The query below categorizes products by price range and count total quantity sold per region & product category.
Common Patterns and Best Practices
As you continue to use the
GROUP BYclause to group multiple columns, you will recognize the recurring patterns to improve your use. We will discuss these common occurrences with performance considerations.Hierarchical and temporal analysis patterns
You may have noticed that most datasets have inherent hierarchies, such as geography (continent → country → city), product categories, or organizational structures. Therefore, the
GROUP BYclause is ideal for summarizing data at different levels of these hierarchies.When presented with data with dates and time stamps, temporal analysis can help identify trends, seasonality, and time-based behavior by grouping by date parts such as year, quarter, month, or day.
Earlier, we talked about two types of grouping patterns. Hierarchical groupings involve columns that have a natural, nested relationship, like grouping first by department, then within each department by team. In contrast, non-hierarchical groupings mix unrelated dimensions, such as product type and payment method, showing combinations without any implied order or structure.
Performance-oriented grouping patterns
When using
GROUP BYwith multiple columns, you can improve performance by following these practical tips:Limit grouping columns: Always ensure you group by columns necessary for the analysis to reduce the computational overhead of groups.
Index optimization: Ensure that the grouped columns are indexed to speed up query performance by helping the database handle sorting operations more efficiently.
Filter early: Use the
WHEREclause to limit your dataset before grouping to reduce the amount of data being processed.Use query plans and hints: Review execution plans or add query hints if your database supports them to help optimize the grouping process.
Leverage advanced SQL features: Consider using techniques like
ROLLUPorGROUPING SETSto create summaries more efficiently and avoid running repetitive queries, especially when working with hierarchical or multi-dimensional data.Removing duplicates and data cleansing
GROUP BYcan also be a handy way to clean up your data by removing duplicates based on specific fields. This is useful when your dataset has multiple identical or partially duplicate rows.For example, to remove duplicate sales records, you will group by
region,product_category, andproduct_name, and then select the highest price per group to keep the most relevant record.Troubleshooting and Common Pitfalls
When working with
GROUP BYon multiple columns, keep in mind these common pitfalls:Column specification and data type issues
One of the most frequent errors in the
GROUP BYqueries is related to incorrect column specification. SQL requires that when selecting multiple columns not wrapped in an aggregate function, they must be included in theGROUP BYclause. Failing to do so results in an error. So, always include the non-aggregated columns in theGROUP BYclause if included in theSELECTstatement.You might also run into errors if the data you're grouping has mismatches, especially when you're grouping by expressions. Let’s assume you're grouping your data by a formatted date. In that case, you will get an error if the date values have different formats or levels of precision, leading to unexpected or incorrect results.
Performance degradation and null value handling
Using
GROUP BYqueries can sometimes slow down your database, especially if you’re grouping by columns with many unique values (high cardinality) or if those columns aren’t indexed. Large datasets also need enough memory to handle the sorting and grouping steps, which adds to the load.To avoid these issues, always index the columns and filter using
WHEREto limit the data you query.Also, it’s important to know how SQL handles NULL values in grouping: all NULLs in a grouping column are treated as the same group, no matter how many there are. However, NULL is never considered equal to any actual (non-NULL) value, so those groups stay distinct.
Conclusion
Using the
GROUP BYclause to group multiple columns in SQL is a powerful technique that enables deeper, multi-dimensional analysis by aggregating data across combinations of fields. It allows analysts to go beyond basic summaries and gain more insights into patterns and relationships within data. This capability is important for reporting, performance tracking, and decision-making in modern business environments..As data grows in complexity and volume, SQL remains a foundational tool in analytics. To further enhance your skills, consider exploring window functions, common table expressions (CTEs), and materialized views, which open the door to even more advanced data transformations and reporting workflows.
I recommend taking our PostgreSQL Summary Stats and Window Functions course to learn how to write queries for business analytics using Window functions like a pro. I also challenge you to try our projects: Analyzing Industry Carbon Emissions and Analyzing Motorcycle Part Sales to test your SQL skills and demonstrate your mastery of using SQL to solve business problems.