Curso
Data is an integral part of the lives of Data Scientists. Right from the sales and Profit of a company, to passengers in an airport, everything constitutes data. Now, all this data is recorded and most of the times stored in files called databases and an essential task of a Data Scientist is to be able to access data from databases and then analyze them. Most of the ETL tools that tend to help in the cleaning part are actually running SQL commands under the hood. So having some knowledge of SQL can be quite a valuable resource for a Tableau user.
Objective
Apart from the various visualization advantages that Tableau offers, it also has an amazing out of the box connection capabilities. Tableau can easily integrate with DBMS like SQL. This offers increased advantages regarding functionalities and comes in handy for Data Scientists who are used to working in SQL. Tableau provides an optimized, live connector to SQL Server so that we can create charts, reports, and dashboards while working directly with our data.
Pre-requisites
This article assumes some familiarity with Tableau, its properties and how it is used to do the analysis. Since this article will be focused only on SQL with Tableau, it is suggested to go through the following existing tutorials which serve as an excellent primer to both Tableau and SQL:
Data Visualisation with Tableau
SQL Tutorial: How To Write Better Queries
1. Tableau
Tableau Software is an American computer software company headquartered in Seattle which generates interactive data visualization products focused on BI. The main products offered by Tableau are Tableau Desktop, Tableau Public and Tableau Online. You can read more about them here. For the purpose of this tutorial, we will be working with the Tableau Desktop(14 days trial available), since the free Tableau Public version doesn’t provide the SQL connectivity.
Installation
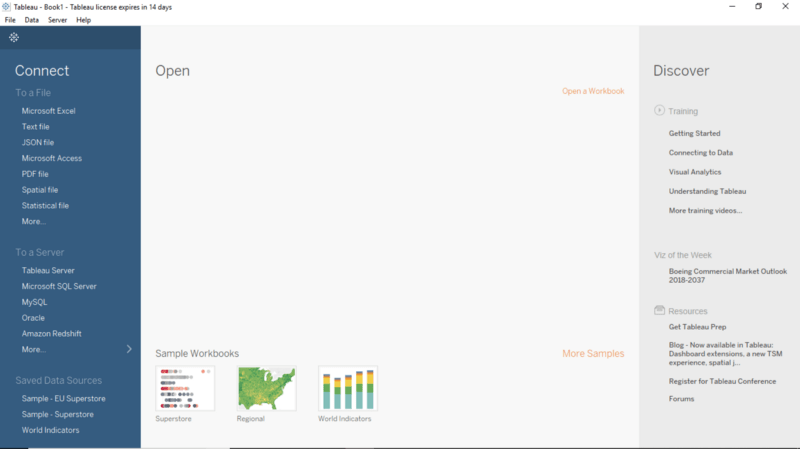
Download the Tableau Desktop edition from the official website. Follow the installation instructions, and if the following screen appears on clicking the Tableau Icon, you are good to go.
2. Relational Databases: A Quick Overview
The Database management system (DBMS) is the software that interacts with end users, applications, and the database itself to capture and analyze data. The DBMS used for Relational databases is called Relational Database Management Systems(RDBMS).
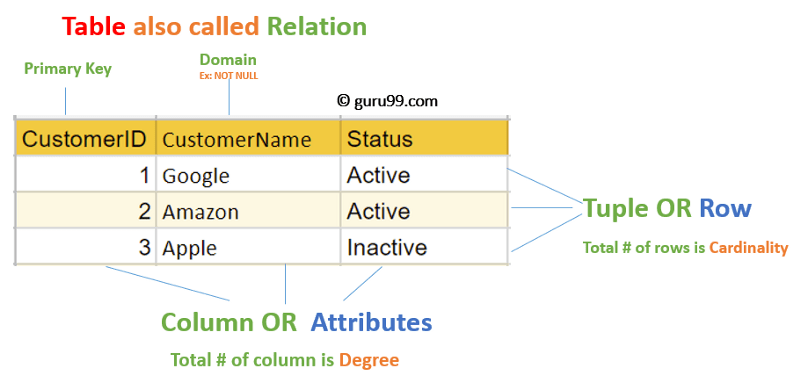
A Relational database consists of one or more tables of information. The rows in the table are called records and the columns in the table are called fields or attributes. A database that contains two or more related tables is called a relational database, i.e., interrelated data. The major RDBMS are Oracle, MySQL, Microsoft SQL Server, PostgreSQL, Microsoft Access and SQLite.
The main idea behind a relational database is that your data gets broken down into common themes, with one table dedicated to describing the records of each theme.
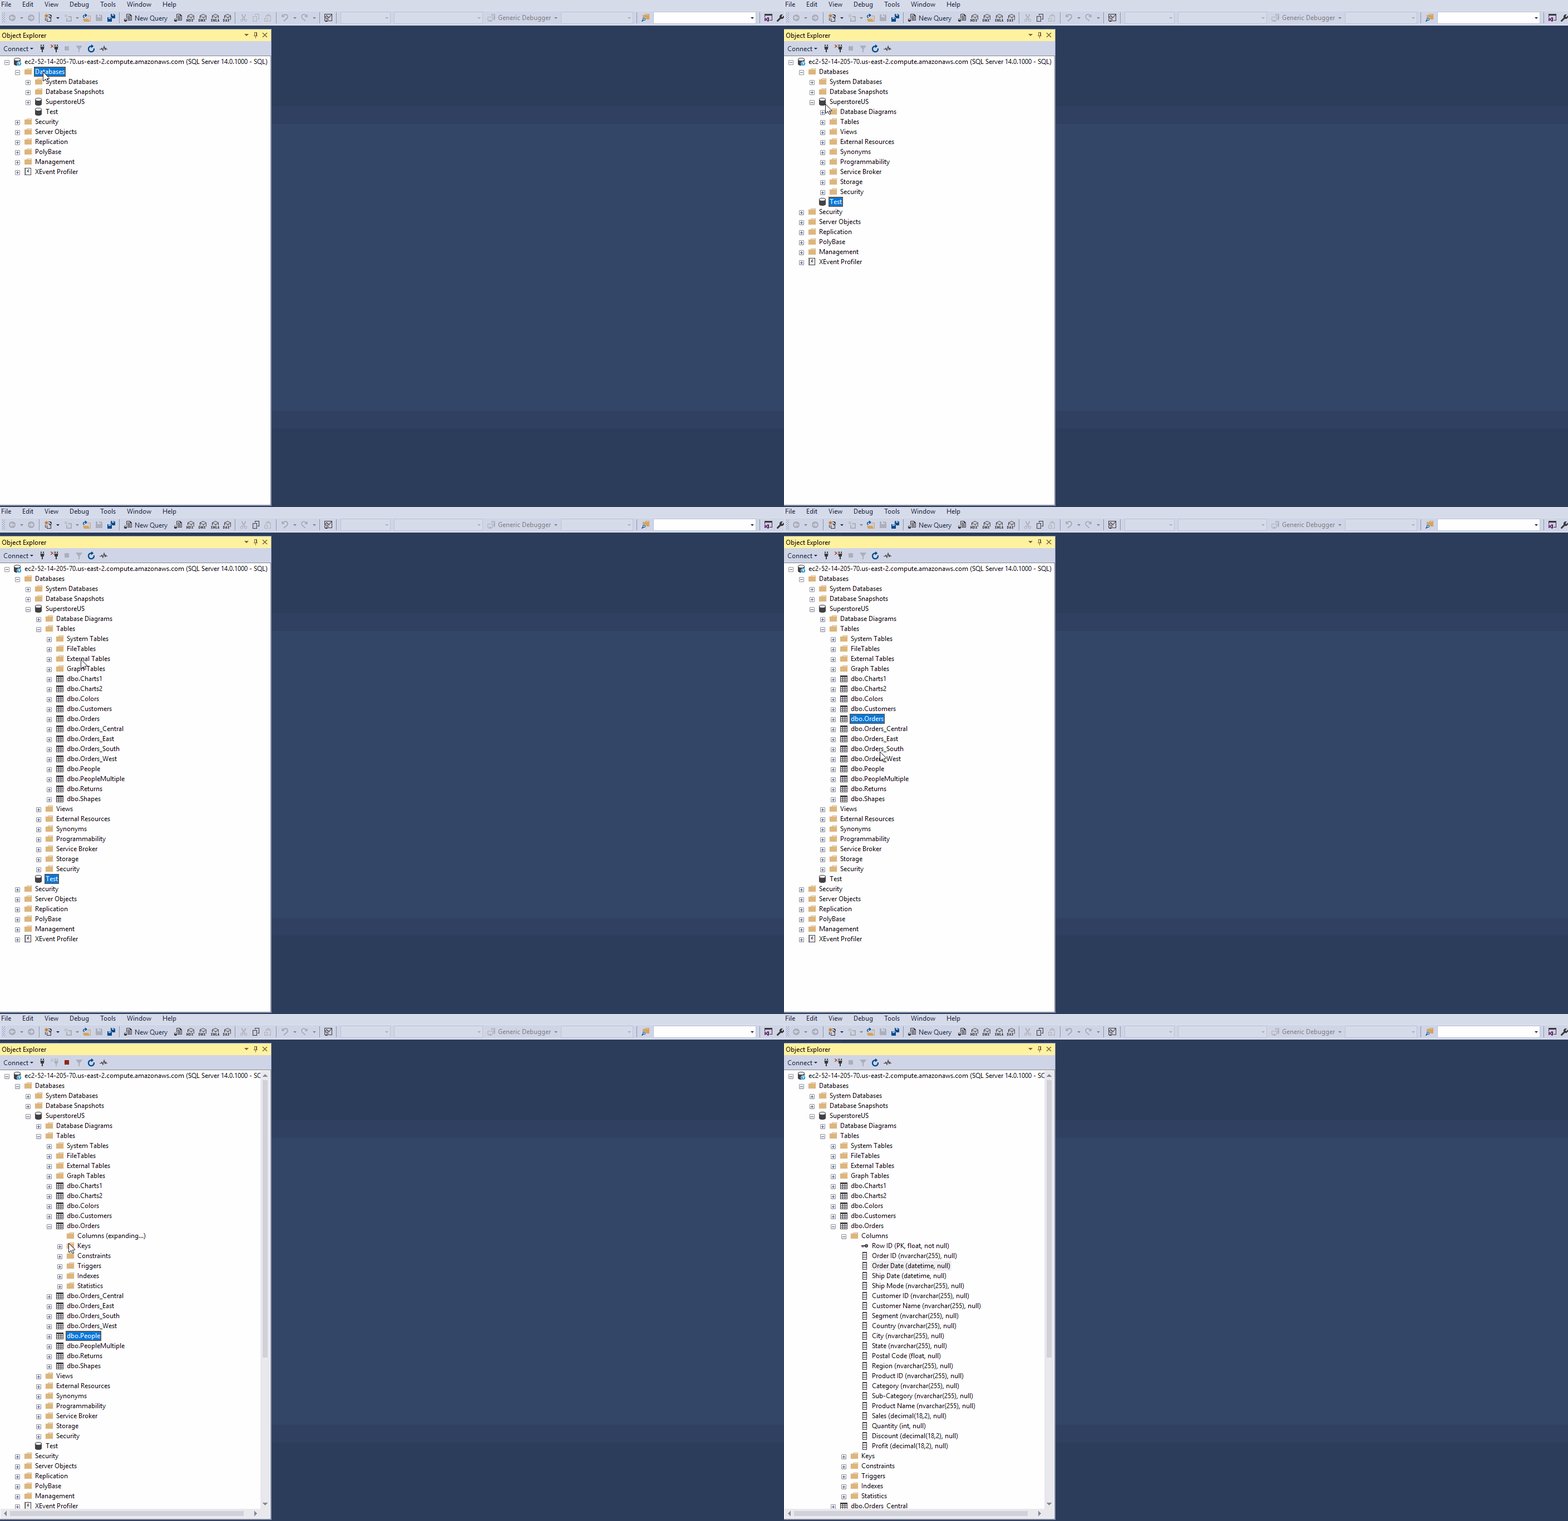
Source ## SQL SQL or the structured query language is a language that has been designed for the purpose of RDBMS. It is a declarative language for manipulating data, to access the database. SQL is used to insert, modify, update and query data in the databases. SQL can be regarded as a language for databases. # 3. Connecting to SQL Server There is a hidden value in our Microsoft SQL Server data which lies buried under the standard reports and complex BI tools. Tableau delivers insight by equipping anyone to do a sophisticated visual analysis of SQL Server data. We can connect Tableau to SQL Server live for tuned, platform-specific queries, or directly bring data into Tableau’s analytical engine to take the burden off the database. Let us walk through an example depicting how to connect SQL server database to Tableau Desktop and then use it to create visualizations. ## Sample Database For the demonstration purpose, we will be using a publicly accessible SQL Server instance on AWS and a database which has been created based on the Tableau’s built-in Superstore dataset. It contains information about products, sales, profits, etc. Our aim as Data Analysts is to analyze the data and find critical areas of improvement within this fictitious company. This SQL server instance has been hosted by Ken Flerlage, who regularly writes blogs for Tableau users. ## Accessing the sample database - Install the SQL Server Management Studio(SSMS). SSMS is a free and integrated environment for managing any SQL infrastructure. With SSMS one can deploy, monitor, and upgrade the data-tier components used by your applications, as well as build queries and scripts. - Once downloaded and installed on to your system, you will see the following screen asking for specific credentials.
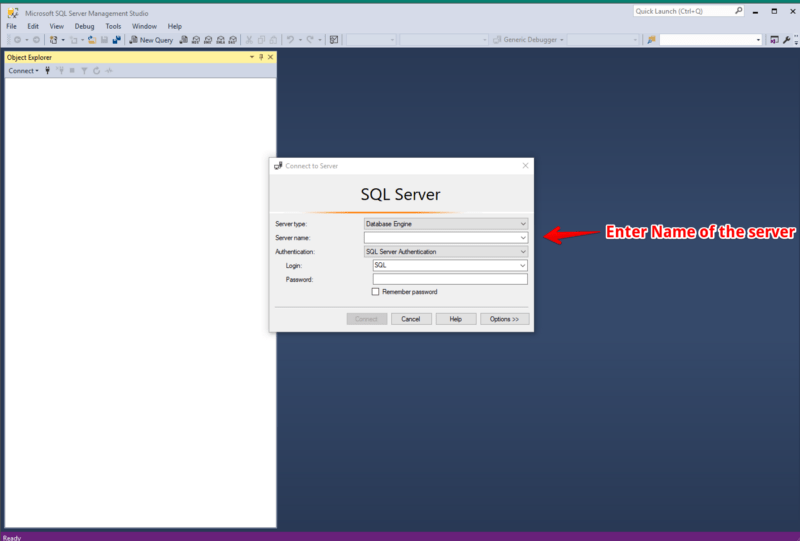
Enter the following credentials:
Server Name: ec2-52-14-205-70.us-east-2.compute.amazonaws.com

Authentication: SQL Server Authentication

Login: SQL

Password: SQL
You will now be granted a ‘Read Only’ access to the ‘SuperStoreUS’ database.
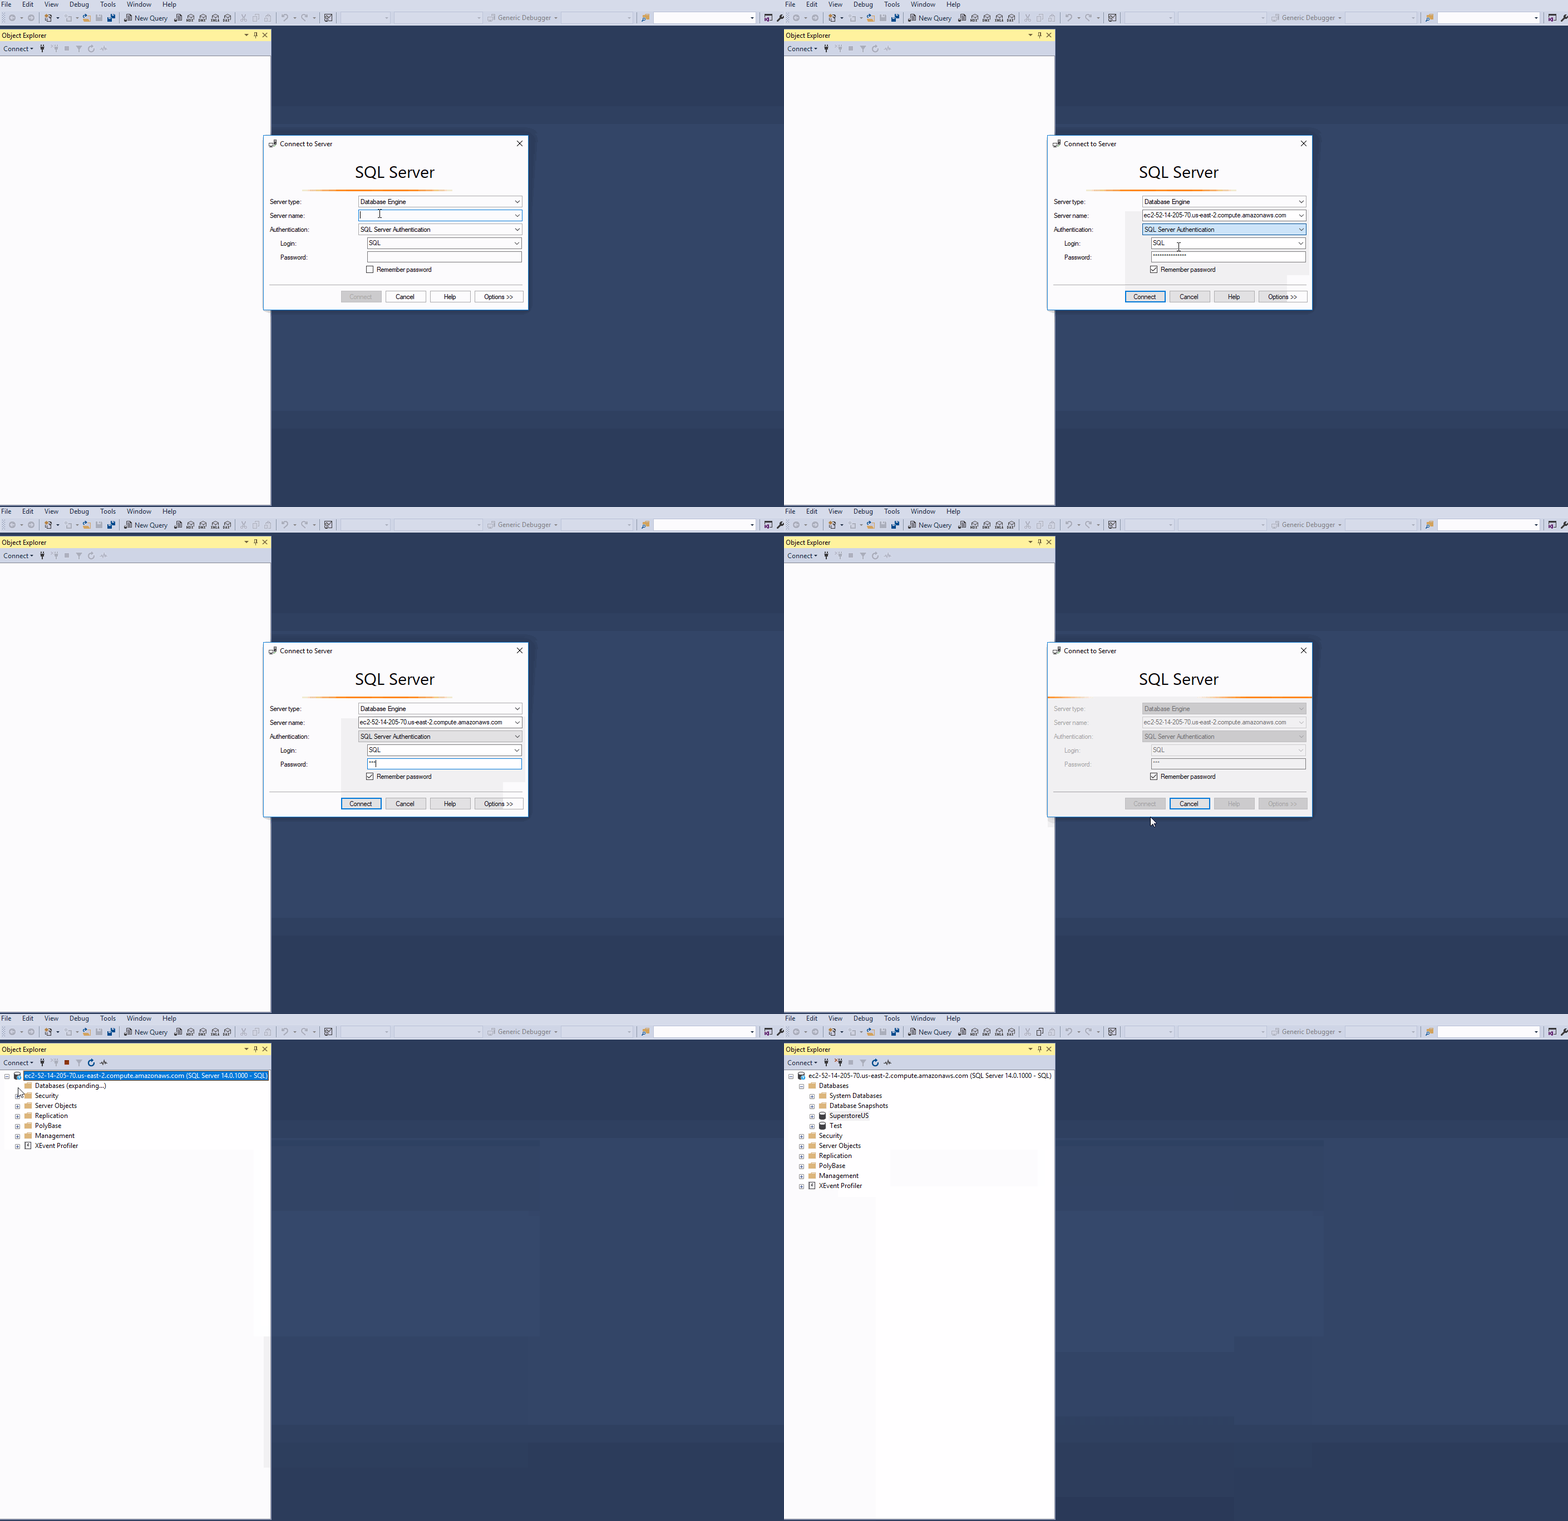
For our example, ec2–52–14–205–70.us-east-2.compute.amazonaws.com is the name of the instance, SuperstoreUS and Test are the databases, and Orders, Customers etc. are the tables within the SuperstoreUS database. Thus there can be multiple instances, and each instance can further contain numerous databases which can also have multiple tables.
4. Importing SQL data into Tableau
Setting up the connection
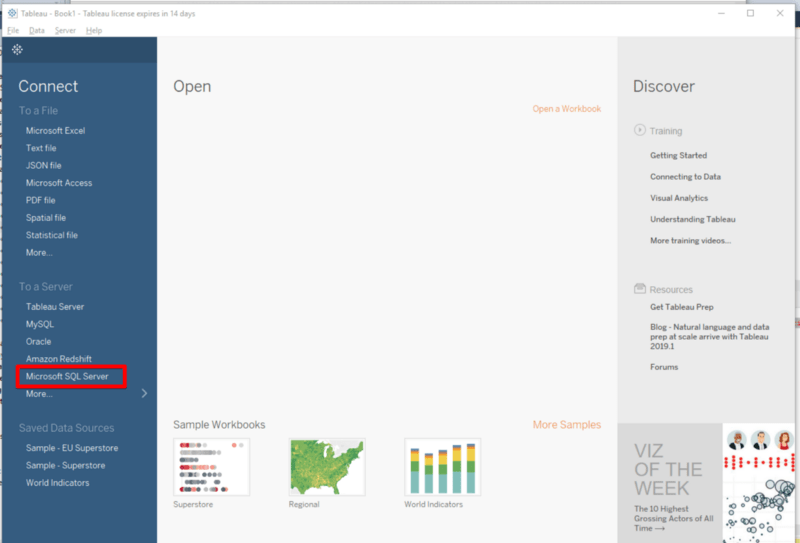
Open the Tableau Desktop and navigate to the start screen. Here the connect pane offers a lot of choices in terms of the data sources that can be connected to Tableau. We will connect to the Microsoft SQL Server.
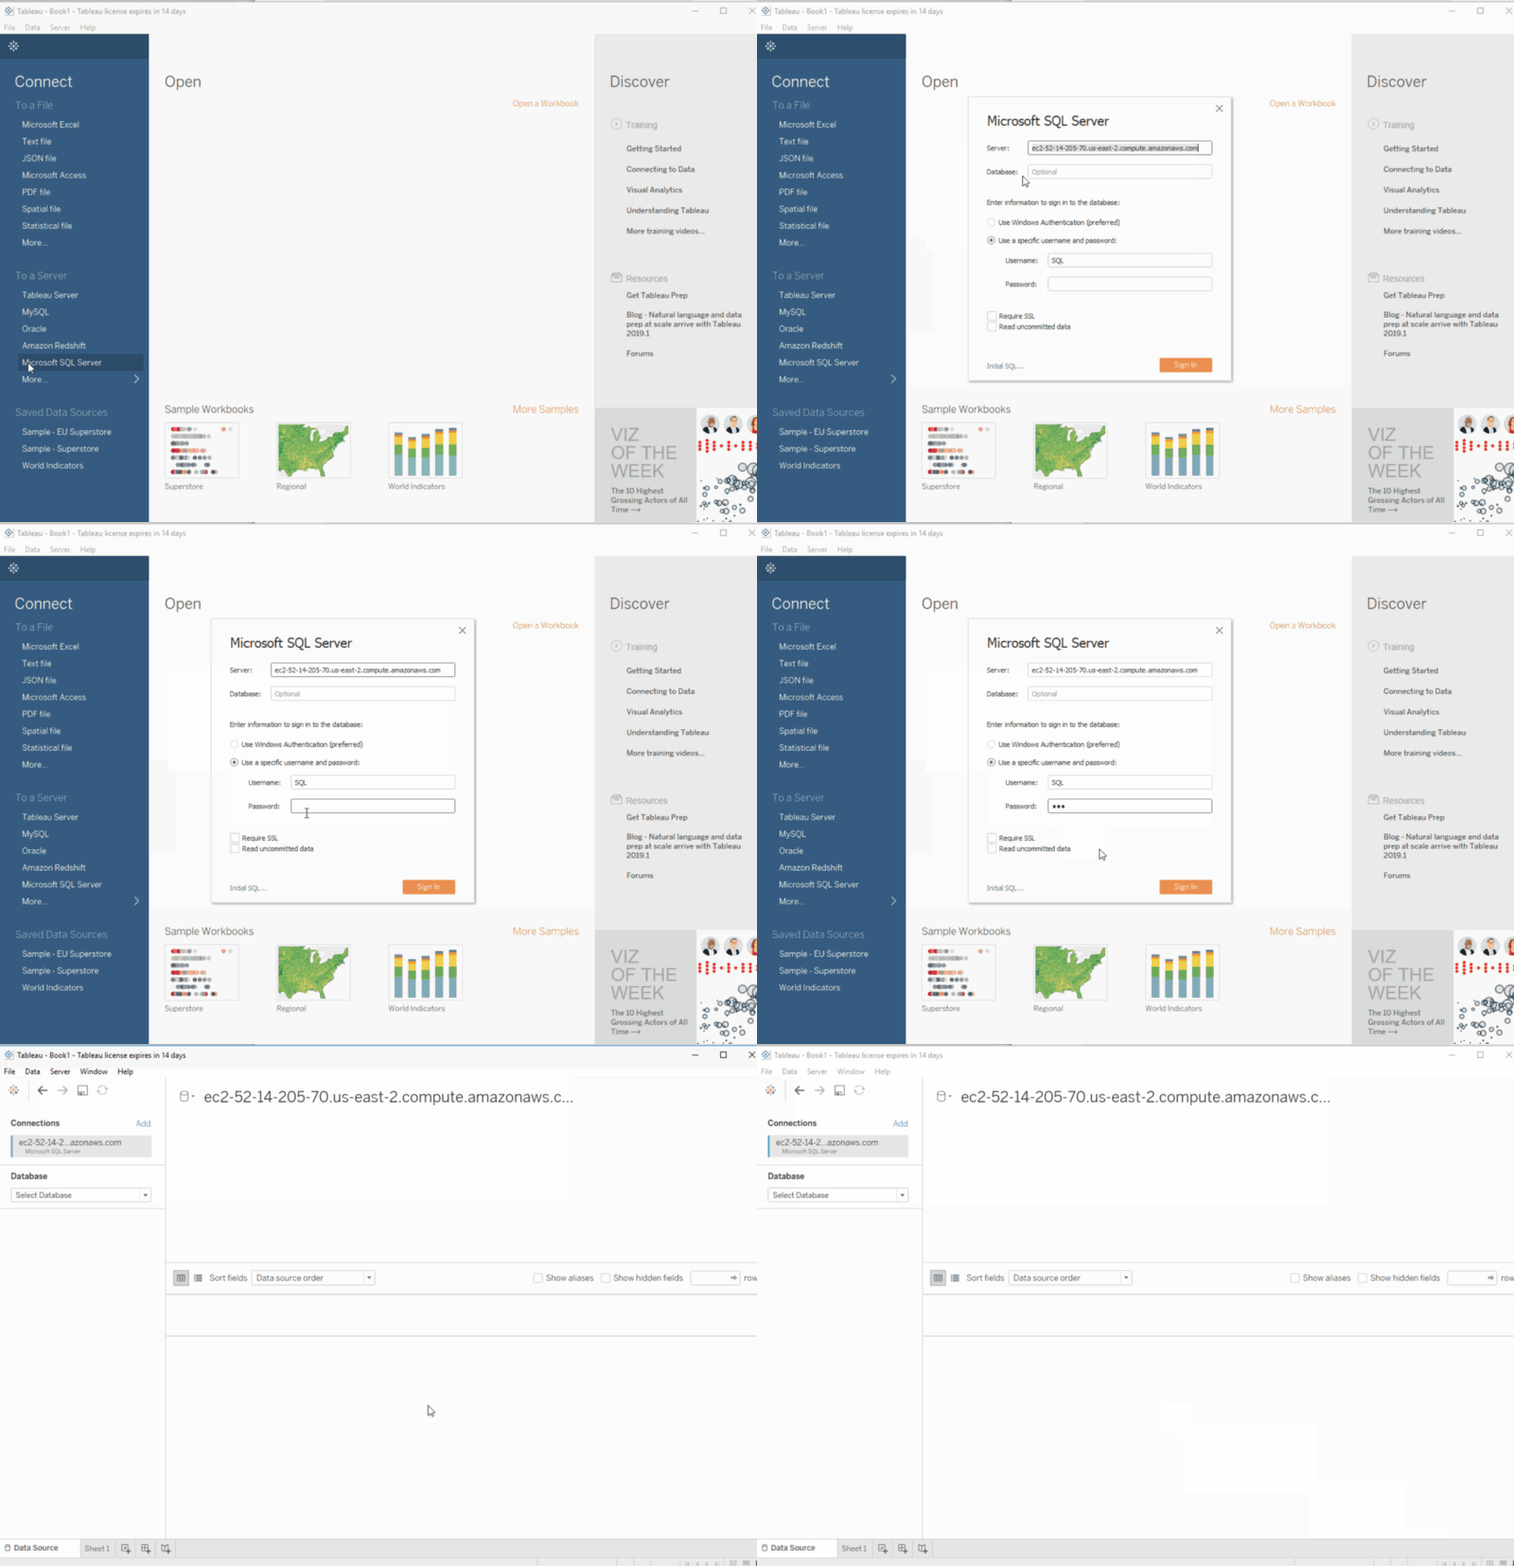
On Clicking the Microsoft SQL Server option, a new screen will open up which will ask for the Server to which we want Tableau to be connected too. Enter the details, and a familiar looking Tableau workspace opens up.
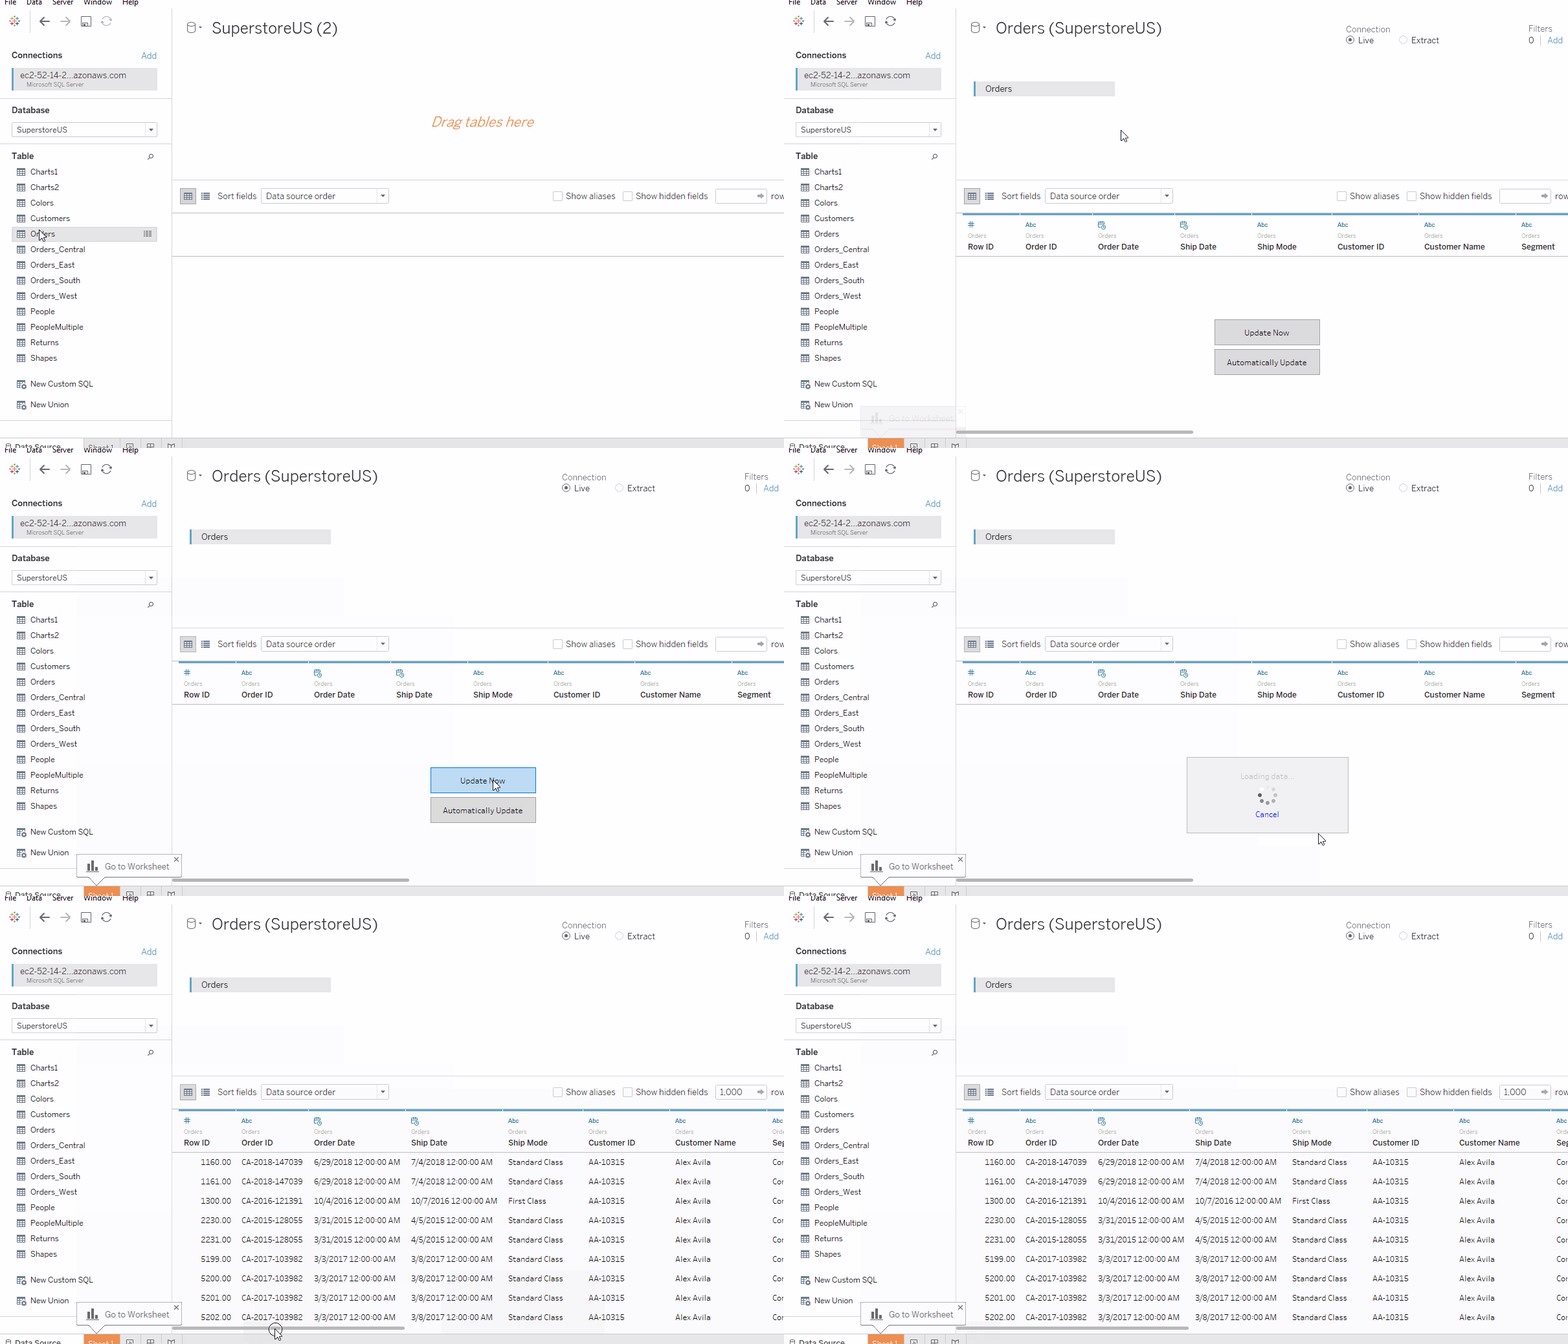
Now, We can select from the list of available databases. Here we will select the SuperStore US database.
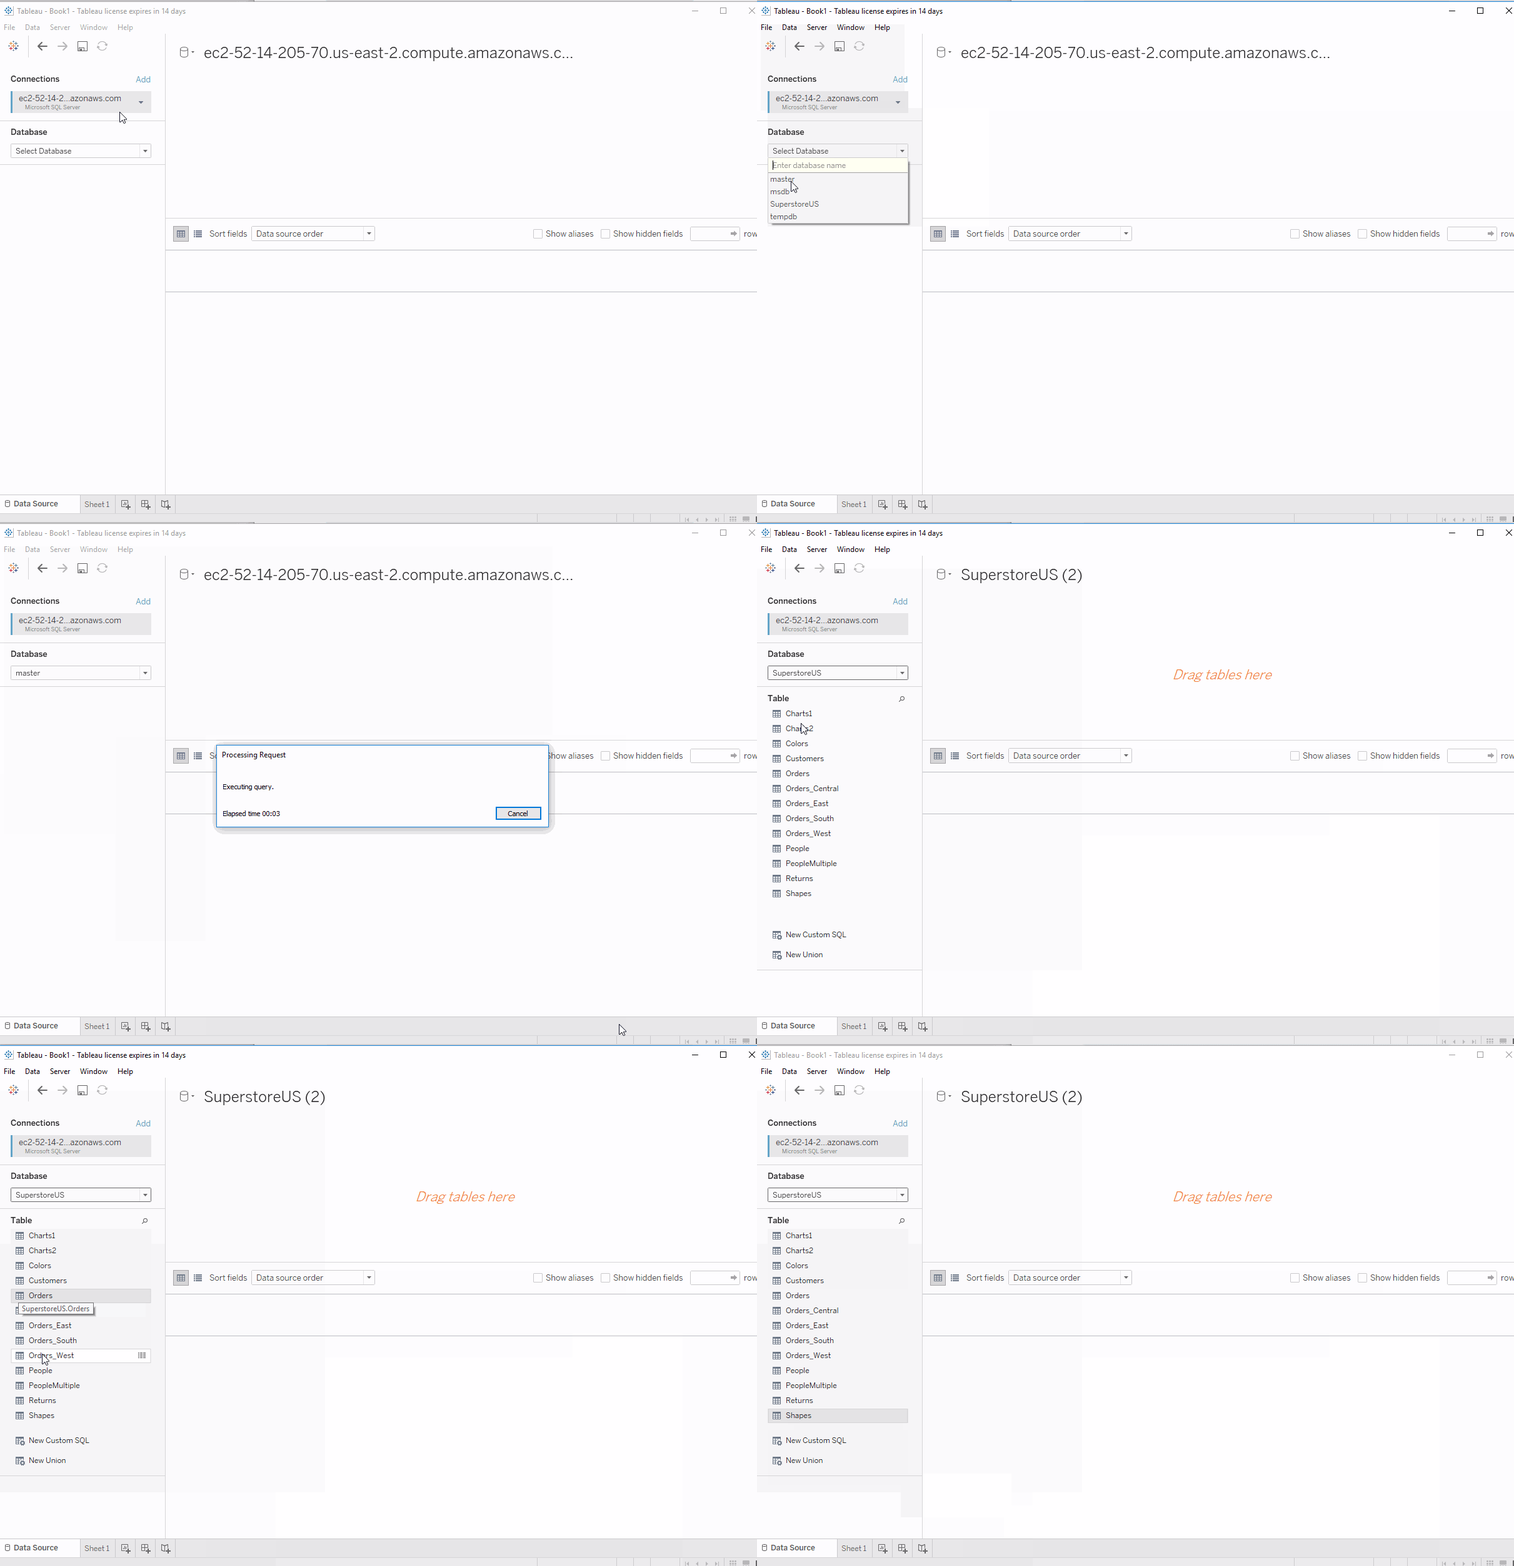
You can now click and drag the desired table on to the view. Let’s drag in the orders table for further analysis. The preview pane gives us options of Update Now, which loads the preview manually or Automatically Update.
Getting data from multiple Tables from the same database
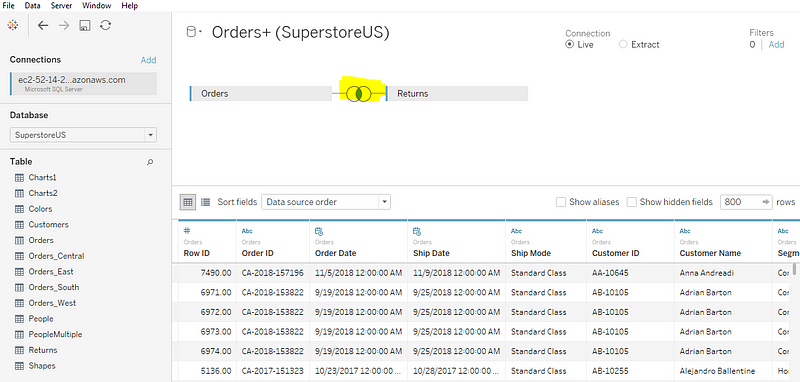
It is also possible to get in data from more than one Table in Tableau, through joins. Joining is combining the tables which are related by some common fields. For instance, it is possible to join Orders and the Returns table since they have a common column called Order-ID. Join simply creates a virtual table by adding columns from different tables side by side.

In case, the analysis requires working with data from multiple sources. It is called Data Blending. You can read more about blending here.

Blend #
5. Custom SQL
Custom SQL gives the users control over the data that they want to bring into Tableau. This feature is not particularly about writing SQL queries but mainly about defining the data set. The process of defining a new custom SQL is as follows: - Click on the custom SQL Tab on the left side of the screen, and a dialogue box opens up. - Write the custom query that you want to execute in the dialogue box - Update the results and what we get are only orders where quantities are greater than 4. - Now move over to your worksheet and start exploring with Tableau.
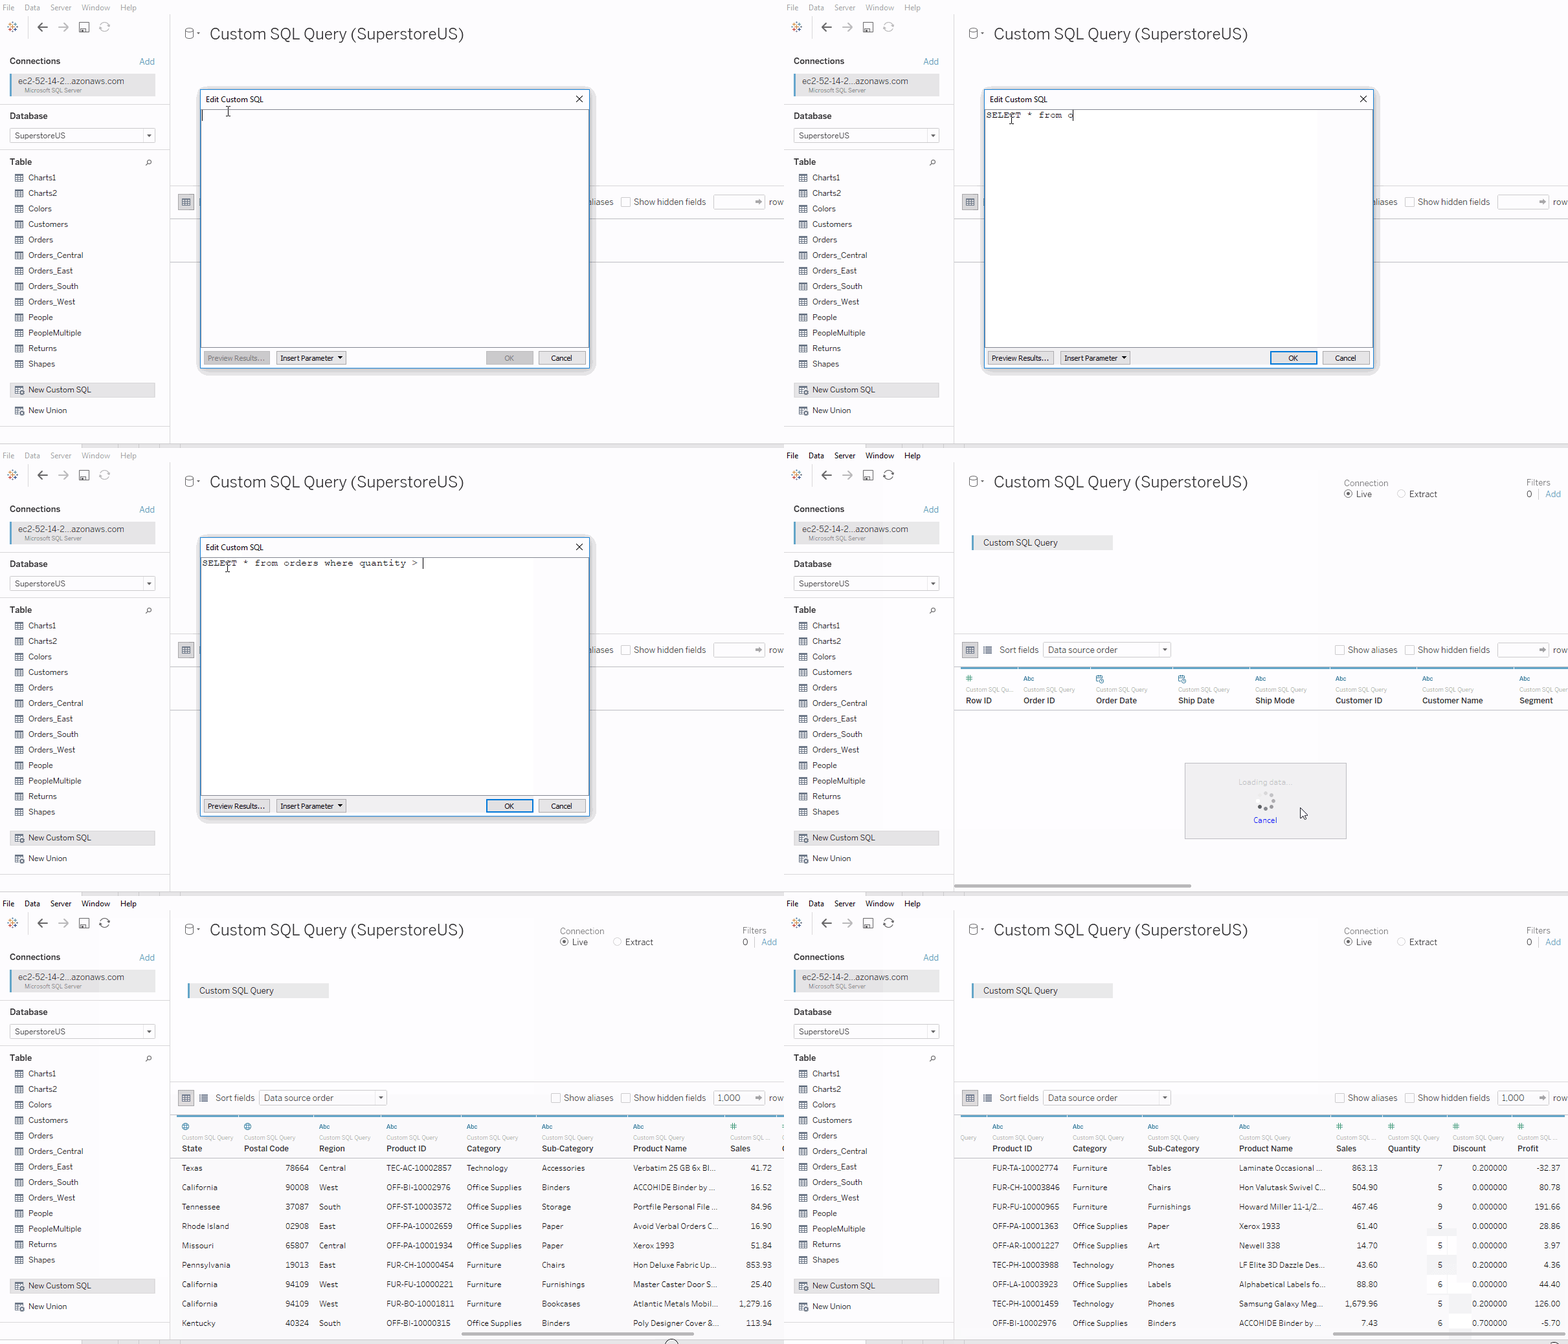
This was a simple query since the data is limited. However, you can even execute complex queries too.
6. Data Source Filters
Just like Custom SQL, it is also possible to get some specific data into Tableau with Data Source filters. Let’s see how to work with these filters.
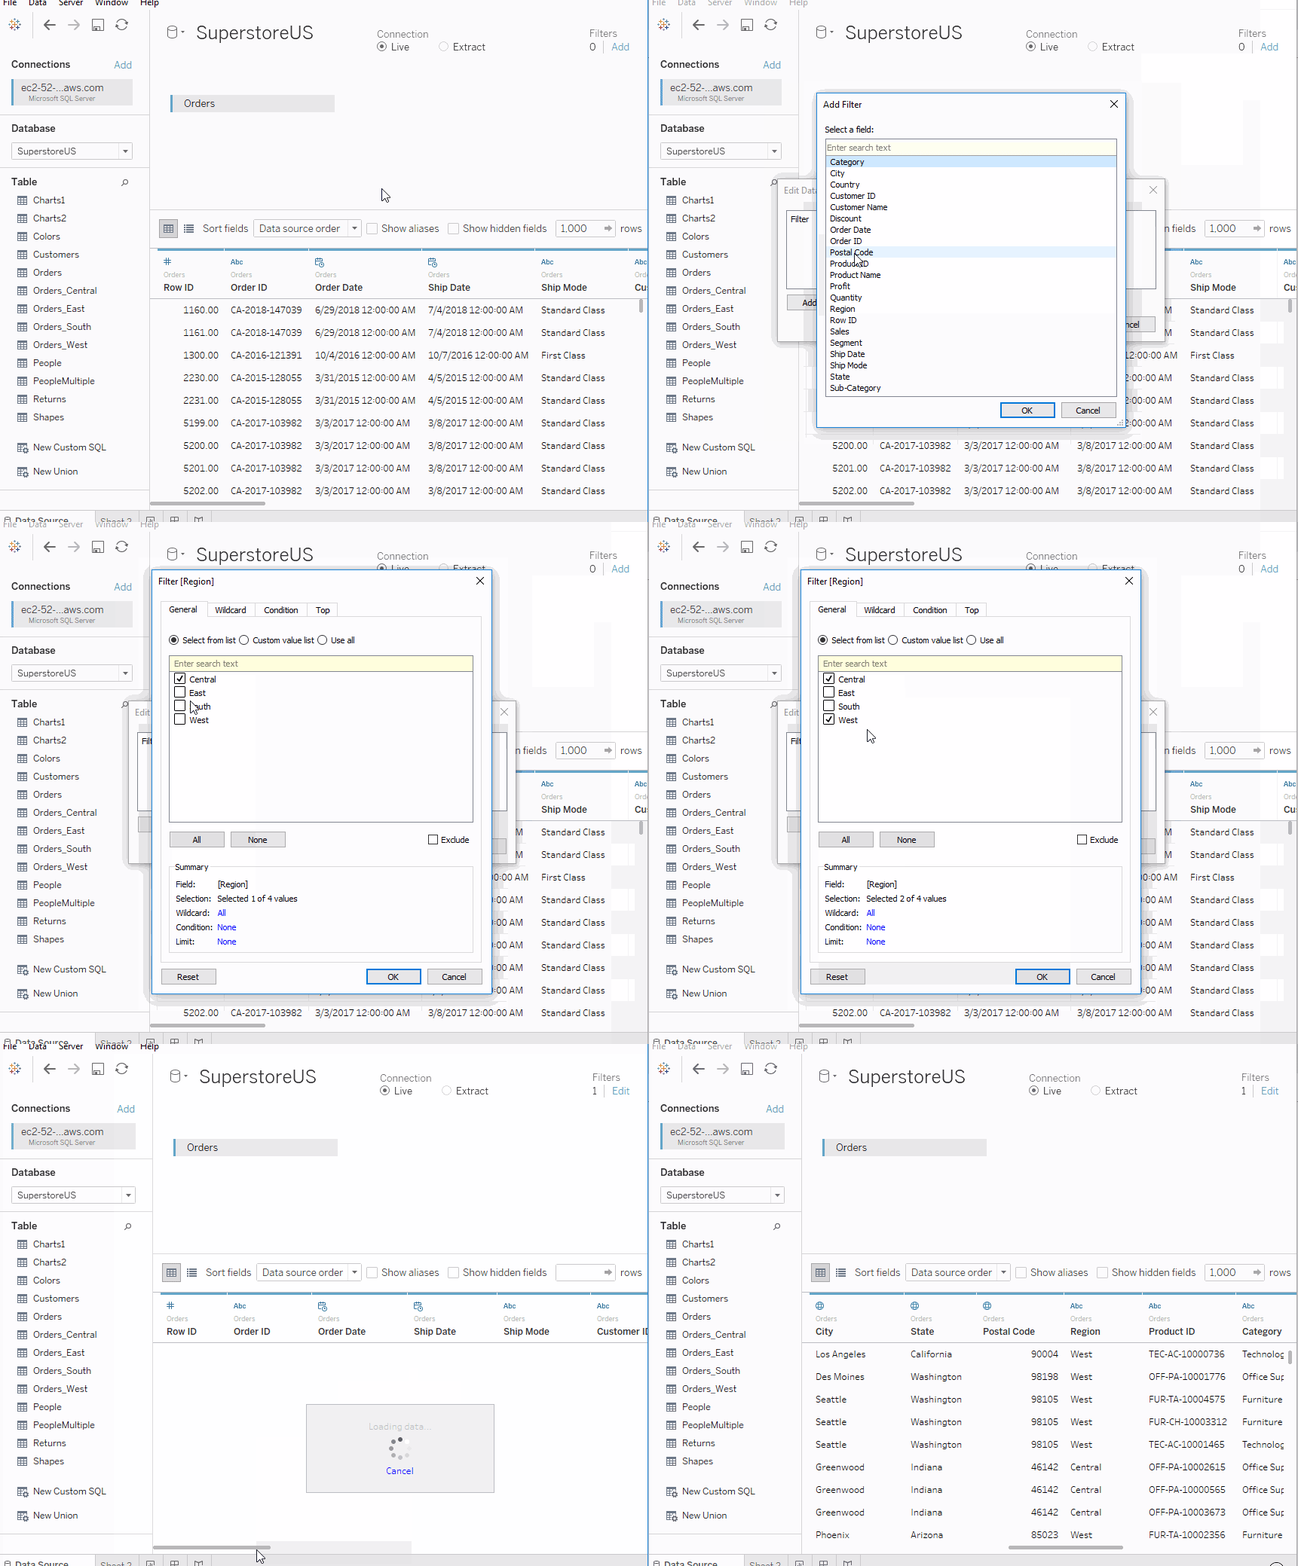
- Drag the
Orderstab on to the view. The orders table contains a field calledRegionsignifying four regions in the U.S where the products are sold. - Let’s say we want the orders only pertaining to West and the Central Region. Go to filters in the upper right-hand corner and click
Add, andAdd again - A list of fields gets populated. Select the
Regionfield or any field of your choice. - Now, what we see is a list of probable values for the field we selected. Select the desired ones and click OK.
- This returns the filtered data from the connection level.
Keep in mind that both custom SQL Query and the Data Source Filter methods should be used only for specific use cases. The best option would be first to connect the data to Tableau and then use the filters within Tableau.
7. Analysis in Tableau
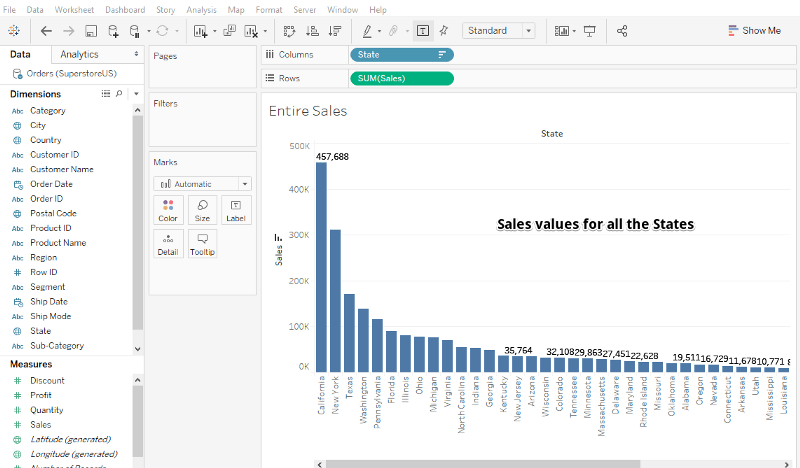
After getting the data from the SQL server into Tableau, it can be easily analyzed in Tableau. Let’s analyze the data that we have in our worksheet in multiple ways:
- We could analyze the State-wise sales
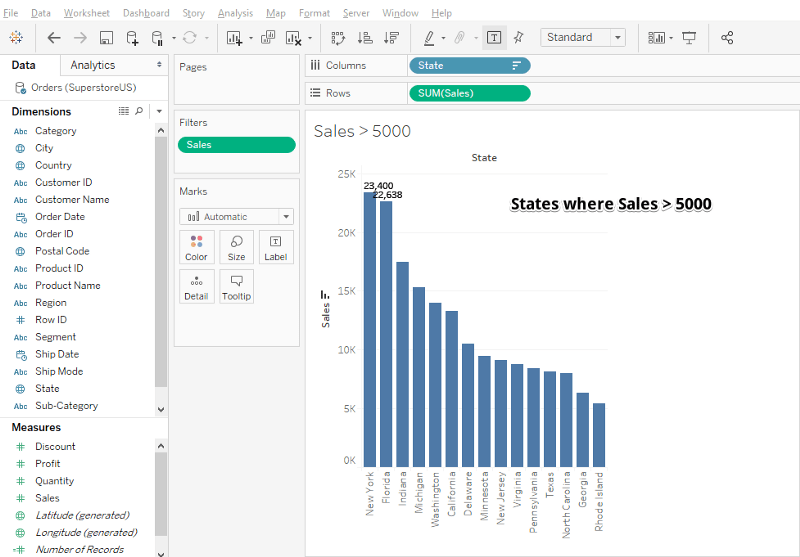
- Or we could find those States where Sales figures are more than 5000.
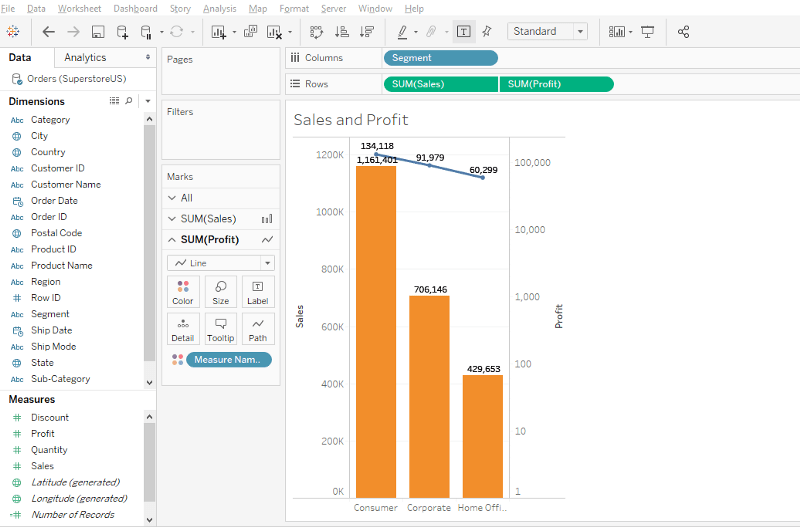
- Another point of analysis could be Sales vs. the Profit scenario.
Thus, the analysis in Tableau after getting the data from SQL Server is pretty straightforward just like any other standard analysis.
8. Conclusion
Using SQL and Tableau together takes the data analysis to the next level. We can easily connect the SQL Server to Tableau and extract the data directly into it. Tableau enables the users to toggle connections with a click to apply in-memory queries to a larger dataset. SQL is a pretty useful tool and when leveraged with the expertise of Tableau can help to make the analysis more powerful and insightful.
If you would like to learn more in SQL, take DataCamp's Intro to SQL for Data Science course.