
Which SQL Project Should You Start With?
The right first SQL project is the hardest one you can finish without looking up every clause. The table lists all 12 guided projects with the skills each one leans on, so you can match them against what you already know.
| # | Project | Level | Time | SQL skills it practices |
|---|---|---|---|---|
| 1 | Analyzing Industry Carbon Emissions | Beginner | 30 min | Aggregation, filtering, grouping |
| 2 | Analyzing Electric Vehicle Charging Habits | Beginner | 30 min | Exploratory queries, grouping, time columns |
| 3 | Analyzing Students' Mental Health | Beginner | 1 hour | Aggregation, grouping, aliasing |
| 4 | When Was the Golden Era of Video Games? | Beginner | 30 min | Joins, set operators |
| 5 | Analyze International Debt Statistics | Beginner | 30 min | Aggregation, distinct counts, ordering |
| 6 | Uncovering the World's Oldest Businesses | Intermediate | 1 hour | Multi-table joins |
| 7 | Analyzing and Formatting PostgreSQL Sales Data | Intermediate | 1 hour | Type casting, missing values, imputation |
| 8 | Factors that Fuel Student Performance | Intermediate | 30 min | CASE, grouping, comparing averages |
| 9 | Analyzing Motorcycle Part Sales | Advanced | 1 hour | Date functions, CTEs, reporting |
| 10 | Analyzing Unicorn Companies | Advanced | 1 hour | CTEs, date functions, single-query reports |
| 11 | Evaluate a Manufacturing Process | Advanced | 1 hour | Window functions, partitioning, subqueries |
| 12 | Exploring London's Travel Network | Beginner (cloud) | 30 min | Querying Snowflake, BigQuery, Redshift, or Databricks |
All 12 are free once you create a DataCamp account. Levels and times come from each project's page in our catalog.
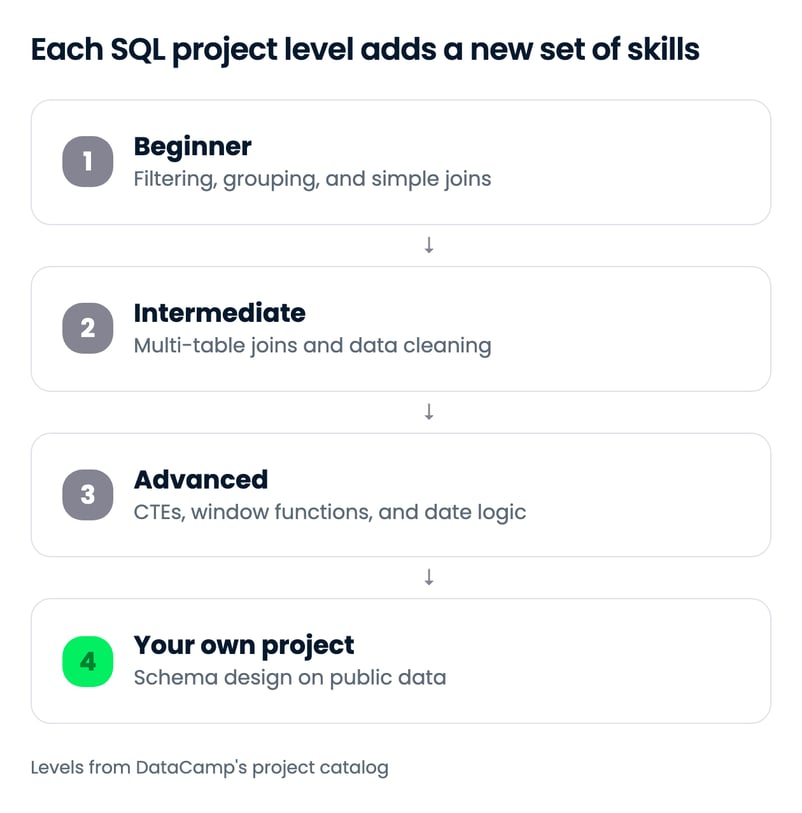
SQL Projects for Beginners
A beginner SQL project answers one business question with a single table or a simple join. You're ready for these if you can do the following:
- Filter rows on one or several conditions
- Aggregate with
MIN(),MAX(),AVG(),COUNT(), andSUM() - Group, order, and limit results
- Join two tables with an inner join
- Alias columns and tables
Our SQL Basics Cheat Sheet covers all of these on one page, and the Introduction to SQL course teaches them in about 2 hours.
1. Analyzing industry carbon emissions
In Analyzing Industry Carbon Emissions, you explore a dataset of product carbon footprints and find which industries emitted the most in the most recent year. Product emissions make up more than 75% of global emissions, according to the project brief, so the question has a real answer worth stating in a portfolio.
It's a single task and the shortest project on this list. If GROUP BY with a WHERE filter still feels shaky, the Intermediate SQL course covers both.
2. Analyzing electric vehicle charging habits
In Analyzing Electric Vehicle Charging Habits, you help apartment building managers understand how tenants use shared EV charging stations. You'll query station usage data to describe tenants' charging habits, the kind of operational question facilities and operations analysts get asked every week.
It's one of the highest-rated SQL projects in our catalog and a good pick if you want a dataset that isn't about sales.
3. Analyzing students' mental health
In Analyzing Students' Mental Health, you work with survey data from a Japanese international university to see what affects international students' mental health. The task focuses on one factor, length of stay, and how it relates to average diagnostic scores.
Expect to spend more time interpreting the results than writing the queries. Grouping by length of stay is the easy part; explaining what the averages do and don't show is what makes it a portfolio piece.
4. When was the golden era of video games?
In When Was the Golden Era of Video Games?, you analyze critic scores, user scores, and sales for the top 400 best-selling video games released since 1977. The goal is to find the release years critics and players liked best, then check how many games those years sold.
You'll need joins and set operators to compare the critics' list with the players' list. The SQL Joins Cheat Sheet is a quick refresher, and the Joining Data in SQL course covers set theory in depth.
5. Analyzing international debt statistics
In Analyze International Debt Statistics, you query World Bank data on the debt developing countries owe, broken down into several debt categories. The goal is to find which countries owe the most and the least.
The queries are short, but the data has several rows per country, so you have to think about what you're counting before you aggregate. The Intermediate SQL course covers everything it needs.
Intermediate SQL Projects
An intermediate SQL project spreads its data across several tables or hands you data that isn't clean yet. The skills from the beginner section still carry most of the work. What's new is deciding which tables to join and what to do with values that are wrong or missing.
6. Uncovering the world's oldest businesses
In Uncovering the World's Oldest Businesses, you explore data from BusinessFinancing.co.uk on companies that have survived for hundreds of years. You'll find when they were founded, which industries they belong to, and how that differs by continent.
The data sits in several tables, so most answers need a join first. If you want a refresher on joining 3 or more tables, read our tutorial on how to join 3 tables in SQL.
7. Analyzing and formatting PostgreSQL sales data
In Analyzing and Formatting PostgreSQL Sales Data, you work with a superstore database that has incorrect data types and missing values. You clean it in PostgreSQL, then answer retail questions about it:
- Which columns have the wrong type, and how to cast them so calculations work
- How to impute missing product quantities per order
- Which products perform best once the data is clean
Most real analyst work starts with data like this, which is why I'd put this project in a portfolio before any of the beginner ones. Our cleaning data in SQL tutorial and the Cleaning Data in PostgreSQL Databases course cover the techniques.
8. Factors that fuel student performance
In Factors that Fuel Student Performance, you query a database on study habits, sleep, parental involvement, and access to resources to see which factors go with high exam scores. You'll also check whether students with more extracurricular activities score better.
It pairs well with the mental health project above if you want two education projects that tell one story. Bucketing students with CASE before comparing averages is the core technique, and the Data Manipulation in SQL course covers it.
Advanced SQL Projects
An advanced SQL project asks you to build one query, or a short chain of CTEs, that produces a finished report. Before starting, check that you can do these in SQL:
- Use every join type, including self joins
- Write nested queries and common table expressions (CTEs)
- Apply window functions with
PARTITION BY - Handle if/then logic with
CASE - Truncate, extract, and compare dates and times
- Match patterns with
LIKEand create views
Our SQL Window Functions Cheat Sheet is worth keeping open for all 3 projects in this section.
9. Analyzing motorcycle part sales
In Analyzing Motorcycle Part Sales, you work for a company that sells motorcycle parts wholesale through 3 warehouses. You build one query that reports net revenue by product line, month, and warehouse.
The SQL isn't the hard part. Getting the report into a shape a sales manager would read is, and the Data-Driven Decision Making in SQL course covers that side.
10. Analyzing unicorn companies
In Analyzing Unicorn Companies, you query a PostgreSQL database of companies valued at over $1 billion. The task is to find the 3 industries that produced the most new unicorns between 2019 and 2021, then report, per year, how many unicorns each industry produced and their average valuation in billions.
All of that comes out of a single query, which is why it sits in the advanced group. The Functions for Manipulating Data in PostgreSQL course covers the date and numeric functions you'll need.
11. Evaluate a manufacturing process
In Evaluate a Manufacturing Process, you check whether operators' adjustments to a production process kept quality within limits or pushed it out. You'll use window functions, partitioning, and summary statistics to work out whether any of those adjustments reduced quality.
Window functions with PARTITION BY come up often in SQL interviews, and this project is good practice for them. The Reporting in SQL course is the listed preparation.
SQL Project in a Cloud Data Warehouse
A cloud data warehouse project is the same SQL you've practiced so far, run in Snowflake, Google BigQuery, Amazon Redshift, or Databricks instead of PostgreSQL. If the jobs you're applying for mention one of these platforms, a warehouse project on your portfolio shows you've used it.
12. Exploring London's travel network
In Exploring London's Travel Network, you query Transport for London journey data from 2010 to 2022 to find the most popular transport types, see when the cable car was busiest, and spot the rare periods when the Underground was quiet. Pick the version for the warehouse you want to learn: Snowflake, BigQuery, Redshift, or Databricks.
It's a beginner-level project, and each version only takes 30 minutes. Our Snowflake tutorial for beginners and BigQuery tutorial for beginners explain how those platforms differ from a local database.
How to Build Your Own SQL Project
An independent SQL project is one where you choose the data and the question, and it carries more weight in a portfolio than a guided one because nobody wrote the tasks for you. Here are 4 starting points that use free, public data:
- Design a database from scratch. Pick a small business, such as a bike rental shop, and write the
CREATE TABLEstatements with primary keys, foreign keys, and constraints. Normalize to third normal form, load sample rows, and write 10 queries a manager would ask. Compare your design with Pagila, a PostgreSQL sample database for a DVD rental store. Our tutorials on database schemas and normalization and the Database Design course cover the theory. - Query NYC taxi trips with DuckDB. The NYC Taxi and Limousine Commission publishes trip records as monthly Parquet files, and DuckDB queries Parquet directly without a server. Ask how tip rates change by hour and pickup zone, or how airport trips differ from the rest.
- Analyze Stack Overflow in your browser. The Stack Exchange Data Explorer lets you run T-SQL against public Stack Exchange data with no setup. Find which tags get accepted answers fastest, or how a language's question volume changed over the years.
- Pick a dataset from BigQuery's public datasets. Google hosts public datasets you can query from the BigQuery sandbox. Choose one close to the industry you want to work in, so the project doubles as domain knowledge.
If you'd rather not set anything up, our tutorial on practicing SQL on any dataset shows how to upload a CSV to DataLab and query it with SQL cells.
What Makes a SQL Project Portfolio-Ready?
A portfolio-ready SQL project is one a hiring manager can understand in 2 minutes without running a single query. Whether it started as a guided project or your own idea, add these before you publish it:
- One sentence at the top stating the business question
- A short description of the tables and how they relate, or an entity relationship diagram
- Each query with a comment, its output, and a one-line finding
- A limitations paragraph: what the data can't tell you
- A change you made beyond the brief, such as a new question or a second dataset
That last point matters most for guided projects, since other candidates will have done the same ones. Publish the result in a DataLab notebook, on DataCamp Portfolio, or on GitHub. Our list of places to host your data science portfolio compares the options.
Final Thoughts
If you're new to SQL, start with the carbon emissions or EV charging project this week and work up the list. If you already write CTEs without thinking about it, skip straight to the unicorn or manufacturing project, then build your own on a public dataset.
I'd rather see 3 projects with clear write-ups than 12 that stop at the last query. Once your portfolio is ready, work through our top SQL interview questions before the interview stage.
If you want a structured path through all of these skills, I recommend the Associate Data Analyst in SQL career track.

IBM Certified Data Scientist (2020), previously Petroleum Geologist/Geomodeler of oil and gas fields worldwide with 12+ years of international work experience. Proficient in Python, R, and SQL. Areas of expertise: data cleaning, data manipulation, data visualization, data analysis, data modeling, statistics, storytelling, machine learning. Extensive experience in managing data science communities and writing/reviewing articles and tutorials on data science and career topics.
FAQs
What is a good first SQL project for beginners?
A good first SQL project answers one question with a single table or a simple join. Our Analyzing Industry Carbon Emissions and Analyzing Electric Vehicle Charging Habits projects each take about 30 minutes and only need filtering, grouping, and aggregation.
Are DataCamp's guided SQL projects free?
All 12 guided SQL projects in this article are free with a DataCamp account and run in the browser, so you don't need to install a database. Some other projects in the catalog need a Premium subscription; the project page labels the free ones "Free Project".
What SQL skills do I need for advanced SQL projects?
Advanced SQL projects expect common table expressions (CTEs), window functions with PARTITION BY, CASE logic, and date functions, usually combined into one reporting query. The PostgreSQL Summary Stats and Window Functions course covers most of them.
Where can I find free datasets for my own SQL project?
Good free sources include the NYC Taxi and Limousine Commission's trip records, the Stack Exchange Data Explorer, which you query with T-SQL in the browser, and BigQuery public datasets. For schema design practice, the Pagila sample database gives you a reference design to compare against.
How do I add a SQL project to my portfolio?
State the business question at the top, describe the tables, and show each query with its output and a one-line finding. Add a limitations paragraph and at least one change beyond the original brief, then publish it in a DataLab notebook, on DataCamp Portfolio, or on GitHub.







The quickest way to show an employer you can use SQL is a finished project they can open and read. Below are 12 guided SQL projects from our catalog, all free with a DataCamp account, ordered from beginner to advanced, plus 4 ideas for projects you build on public data yourself.
Every guided project runs in the browser and takes 30 to 60 minutes, so there is nothing to install. For each one, I list the SQL skills it practices and the course that covers them, so you can tell in a minute whether you're ready.
If you're still learning the syntax, our SQL roadmap and our guide on how to practice SQL are better starting points. Once you have a few projects done, our guide to building a data portfolio covers how to present them.
TL;DR