

在线运行和编辑此教程中的代码
运行代码1. 如何创建一个 Pandas DataFrame
显然,在 Python 中进行数据预处理时,创建 DataFrame 往往是第一步。有时您会从零开始,但也可以将其他数据结构(如列表或 NumPy 数组)转换为 Pandas DataFrame。本节仅涵盖后者。如果想了解如何创建空的 DataFrame 并在之后填充数据,请转至第 7 节。
众多可作为 DataFrame 输入的对象中,NumPy 的 ndarray 就是其中之一。要从 NumPy 数组创建数据框,只需将其通过 data 参数传给 DataFrame() 函数即可。
data = np.array([['','Col1','Col2'],
['Row1',1,2],
['Row2',3,4]])
print(pd.DataFrame(data=data[1:,1:],
index=data[1:,0],
columns=data[0,1:]))
Col1 Col2
Row1 1 2
Row2 3 4
注意上述代码片段如何从 NumPy 数组中选择元素来构建 DataFrame:先选择以 Row1 和 Row2 开头的列表中的值,然后选择索引或行名 Row1 和 Row2,最后选择列名 Col1 和 Col2。
接着,您还会看到上例中打印了一个小的选择结果。这与子集化二维 NumPy 数组相同:先指定要查看的行,再指定列。别忘了索引从 0 开始!对于上例的 data,您查看行索引 1 到结尾,并选择索引 1 之后的所有元素。因此最终选中了 1、2、3 和 4。
这种创建 DataFrame 的方法适用于所有可作为 DataFrame() 输入的结构。
请看下面的示例:
请记住 Pandas 库已以 pd 导入。
# Take a 2D array as input to your DataFrame
my_2darray = np.array([[1, 2, 3], [4, 5, 6]])
print(pd.DataFrame(my_2darray))
# Take a dictionary as input to your DataFrame
my_dict = {1: ['1', '3'], 2: ['1', '2'], 3: ['2', '4']}
print(pd.DataFrame(my_dict))
# Take a DataFrame as input to your DataFrame
my_df = pd.DataFrame(data=[4,5,6,7], index=range(0,4), columns=['A'])
print(pd.DataFrame(my_df))
# Take a Series as input to your DataFrame
my_series = pd.Series({"Belgium":"Brussels", "India":"New Delhi", "United Kingdom":"London", "United States":"Washington"})
print(pd.DataFrame(my_series))0 1 2
0 1 2 3
1 4 5 6
1 2 3
0 1 1 2
1 3 2 4
A
0 4
1 5请注意,Series(以及 DataFrame)的索引包含原始字典的键,但会被排序:Belgium 将位于索引 0,而 United States 位于索引 3。
创建好 DataFrame 后,您也许想进一步了解它。可以使用 shape 属性,或将 len() 函数与 .index 属性结合使用:
df = pd.DataFrame(np.array([[1, 2, 3], [4, 5, 6]]))
# Use the `shape` property
print(df.shape)
# Or use the `len()` function with the `index` property
print(len(df))(2, 3)
2这两种方式返回的信息略有不同:shape 属性会给出 DataFrame 的维度,即宽度与高度;而 len() 结合 index 则只会告诉您 DataFrame 的高度。
这也并不奇怪,因为您显式地使用了 index 属性。
您还可以使用 df[0].count() 来了解 DataFrame 的高度,但这会排除 NaN 值(若存在)。因此,对 DataFrame 调用 .count() 并非总是更好的选择。
如果想获取更多关于列的信息,可以执行 list(my_dataframe.columns.values)。
DataFrame 基础操作
现在您已将数据放入更方便的 Pandas DataFrame 结构中,是时候开始真正的工作了!
本节将带您完成在 Python 中使用 DataFrame 的第一步。它涵盖可在新建的 DataFrame 上进行的基础操作:添加、选择、删除、重命名等。
2. 如何从 Pandas DataFrame 中选择索引或列
在开始添加、删除和重命名 DataFrame 组件之前,您需要先了解如何选择这些元素。那么,怎么做呢?
也许您还记得上一节的做法:从 DataFrame 中选择索引、列或值并不难,恰恰相反。这与其他用于数据分析的语言(或包!)中的做法类似。如果您不信,请看下面:
在 R 中,您使用 [,] 记法来访问数据框的值。
现在,假设您有如下 DataFrame:
A B C
0 1 2 3
1 4 5 6
2 7 8 9您想访问索引 0、列“A”中的值。
获取值 1 有多种方式:
df = pd.DataFrame({"A":[1,4,7], "B":[2,5,8], "C":[3,6,9]})
print(df) A B C
0 1 2 3
1 4 5 6
2 7 8 9# Using `iloc[]`
print(df.iloc[0][0])
# Using `loc[]`
print(df.loc[0]['A'])
# Using `at[]`
print(df.at[0,'A'])
# Using `iat[]`
print(df.iat[0,0])1
1
1
1最重要的是记住 .loc[] 和 .iloc[],它们的细微差别会在后续章节讨论。
先别急着继续从 DataFrame 中选择单个值。那么如何选择行与列呢?您可以这样做:
# Use `iloc[]` to select row `0`
print(df.iloc[0])
# Use `loc[]` to select column `'A'`
print(df.loc[:,'A'])A 1
B 2
C 3
Name: 0, dtype: int64
0 1
1 4
2 7
Name: A, dtype: int64目前只需了解,您可以通过标签或位置来访问值。若还不清楚,请再次留意命令中的细小差异:一次是 [0][0],另一次是 [0,'A'],都能取回值 1。
3. 如何向 Pandas DataFrame 添加索引、行或列
学会如何从 DataFrame 选择值后,就该开始真正的操作——向其中添加索引、行或列!
为 DataFrame 添加索引
创建 DataFrame 时,您可以向“index”参数传入输入,以确保获得想要的索引。若不指定,默认会是从 0 开始递增到最后一行的数值索引。
不过,即使索引是自动生成的,您仍可以将某一列复用为索引。只需在 DataFrame 上调用 set_index() 即可。试试看!
# Print out your DataFrame `df` to check it out
print(df)
# Set 'C' as the index of your DataFrame
df.set_index('C') A B C
0 1 2 3
1 4 5 6
2 7 8 9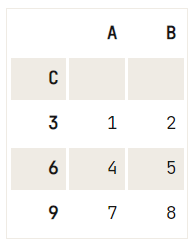
向 DataFrame 添加行
在动手解决之前,先理解 loc 的概念,以及它与 .iloc[] 和 .ix[] 等索引属性的区别:
- .loc[] 基于索引标签工作。这意味着传入 loc[2] 时,会查找索引标签为 2 的行。
- .iloc[] 基于索引位置工作。这意味着传入 iloc[2] 时,会查找位置为 2 的那一行。
- .ix[] 更复杂:当索引为整数型时,传给 .ix[] 的会被当作标签。此时 ix[2] 表示查找索引标签为 2 的行,与 .loc[] 一样!但如果索引不全是整数,ix 会按位置工作,和 .iloc[] 相同。
可能有点绕。我们用个小例子说明:
df = pd.DataFrame(data=np.array([[1, 2, 3], [4, 5, 6], [7, 8, 9]]), index= [2, 'A', 4], columns=[48, 49, 50])
# Pass `2` to `loc`
print(df.loc[2])
# Pass `2` to `iloc`
print(df.iloc[2])48 1
49 2
50 3
Name: 2, dtype: int64
48 7
49 8
50 9
Name: 4, dtype: int64注意,这里 DataFrame 的索引并非纯整数,这样更便于理解差异。很明显,将 2 传给 .loc[] 与传给 .iloc[]/.ix[] 的结果不同!
- 您知道 .loc[] 会查找标签为 2 的行。得到的结果是
48 1
49 2
50 3- 您也知道
.iloc[]会基于位置查找。传入2会得到:
48 7
49 8
50 9- 由于索引不全是整数,
.ix[]的行为将与iloc相同,按位置查找,得到与.iloc[]相同的结果。
现在 .iloc[]、.loc[] 与 .ix[] 的区别已经清楚,可以开始向 DataFrame 添加行了!
提示:基于以上内容,一般建议使用 .loc 向 DataFrame 插入行。因为如果使用 df.ix[],可能会用数值型索引当作索引值引用,从而意外覆盖已有行。应尽量避免!
再看下面这个 DataFrame 的差异:
df = pd.DataFrame(data=np.array([[1, 2, 3], [4, 5, 6], [7, 8, 9]]), index= [2.5, 12.6, 4.8], columns=[48, 49, 50])
# This will make an index labeled `2` and add the new values
df.loc[2] = [11, 12, 13]
print(df) 48 49 50
2.5 1 2 3
12.6 4 5 6
4.8 7 8 9
2.0 11 12 13您能理解为什么这会让人困惑了吧?
向 DataFrame 添加列
在某些情况下,您希望将索引作为 DataFrame 的一部分。可以通过从 DataFrame 中取出一列,或引用尚未创建的列并将其赋给 .index 属性来实现,如下所示:
df = pd.DataFrame(data=np.array([[1, 2, 3], [4, 5, 6], [7, 8, 9]]), columns=['A', 'B', 'C'])
# Use `.index`
df['D'] = df.index
# Print `df`
print(df) A B C D
0 1 2 3 0
1 4 5 6 1
2 7 8 9 2换句话说,您告诉 DataFrame 应将列 A 作为其索引。
不过,如果您要向 DataFrame 追加列,也可以沿用给 DataFrame 添加索引时的方式:使用 .loc[] 或 .iloc[]。本例中,借助 .loc[] 将一个 Series 添加到现有 DataFrame:
# Study the DataFrame `df`
print(df)
# Append a column to `df`
df.loc[:, 4] = pd.Series(['5', '6', '7'], index=df.index)
# Print out `df` again to see the changes
print(df) A B C D
0 1 2 3 0
1 4 5 6 1
2 7 8 9 2
A B C D 4
0 1 2 3 0 5
1 4 5 6 1 6
2 7 8 9 2 7请记住,Series 很像 DataFrame 的一列。这也解释了为何可以轻松将 Series 添加到已有的 DataFrame。另请注意,即使是在向 DataFrame 添加列时,上文关于 .loc[] 的注意事项依然适用!
重置 DataFrame 的索引
如果索引不符合预期,可以选择重置。使用 .reset_index() 即可。但仍需注意,可传入多个参数,它们可能决定重置是否成功:
# Check out the weird index of your dataframe
print(df)
# Use `reset_index()` to reset the values.
df_reset = df.reset_index(level=0, drop=True)
# Print `df_reset`
print(df_reset) A B C D 4
0 1 2 3 0 5
1 4 5 6 1 6
2 7 8 9 2 7
A B C D 4
0 1 2 3 0 5
1 4 5 6 1 6
2 7 8 9 2 7您可以尝试将上述示例中的 drop 参数替换为 inplace,看看会发生什么!
注意,这里使用 drop 表示要丢弃原有的索引。若使用 inplace,原先的浮点索引会作为额外一列添加到 DataFrame 中。
4. 如何从 Pandas DataFrame 中删除索引、行或列
既然已经了解了如何选择与添加索引、行和列,现在来看看另一种用例:从数据结构中移除它们。
从 DataFrame 删除索引
如果您想从 DataFrame 移除索引,需要重新考虑,因为 DataFrame 和 Series 始终带有索引。
不过,您可以这样做:
- 重置 DataFrame 的索引(参见上一节了解如何操作),或
- 移除索引名(若存在),执行
del df.index.name, - 通过重置索引,删除重复添加到 DataFrame 的索引列中的重复值,再将去重后的该列设回索引,
- 最后,通过删除索引来删除一行。后文会进一步展开。
df = pd.DataFrame(data=np.array([[1, 2, 3], [4, 5, 6], [7, 8, 9], [40, 50, 60], [23, 35, 37]]),
index= [2.5, 12.6, 4.8, 4.8, 2.5],
columns=[48, 49, 50])
df.reset_index().drop_duplicates(subset='index', keep='last').set_index('index')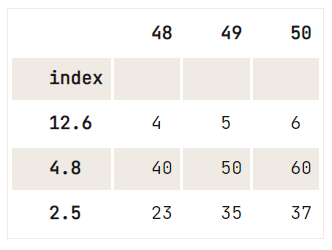
现在您知道如何从 DataFrame 中去除索引了,可以继续移除列和行!
从 DataFrame 删除列
要从 DataFrame 中移除某列(或一组选定的列),可使用 drop() 方法:
df = pd.DataFrame(data=np.array([[1, 2, 3], [4, 5, 6], [7, 8, 9]]), columns=['A', 'B', 'C'])
# Check out the DataFrame `df`
print(df)
# Drop the column with label 'A'
df.drop('A', axis=1, inplace=True)
# Drop the column at position 1
df.drop(df.columns[[1]], axis=1) A B C
0 1 2 3
1 4 5 6
2 7 8 9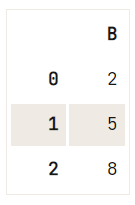
您或许会想:看起来并不那么直观;drop() 方法里还有一些额外参数!
axis参数在表示行时为 0,表示列时为 1。- 将
inplace设为 True 可直接删除列而无需重新赋值 DataFrame。
从 DataFrame 删除行
您可以执行 df.drop_duplicates() 来删除 DataFrame 中的重复行。也可以只考虑某一列中的重复值来删除行。
请看示例:
df = pd.DataFrame(data=np.array([[1, 2, 3], [4, 5, 6], [7, 8, 9], [40, 50, 60], [23, 35, 37]]),
index= [2.5, 12.6, 4.8, 4.8, 2.5],
columns=[48, 49, 50])
# Check out your DataFrame `df`
print(df)
# Drop the duplicates in `df`
df.drop_duplicates([48], keep='last') 48 49 50
2.5 1 2 3
12.6 4 5 6
4.8 7 8 9
4.8 40 50 60
2.5 23 35 37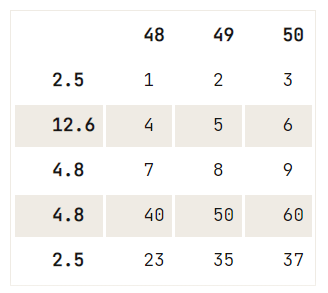
若删除没有唯一性标准,可使用 drop() 方法,结合 index 属性指定要移除的行的索引:
# Check out the DataFrame `df`
print(df)
# Drop the index at position 1
df.drop(df.index[1]) 48 49 50
2.5 1 2 3
12.6 4 5 6
4.8 7 8 9
4.8 40 50 60
2.5 23 35 37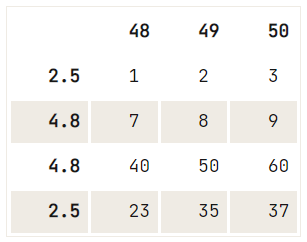
执行该命令后,您可能还需要重置索引。
提示:试着自己为结果 DataFrame 重置索引!如果有需要,别忘了使用 drop 参数。
5. 如何重命名 Pandas DataFrame 的索引或列
若要为 DataFrame 的列或索引赋以新名称,最好的方法是使用 .rename()。
df = pd.DataFrame(data=np.array([[1, 2, 3], [4, 5, 6], [7, 8, 9]]), columns=['A', 'B', 'C'])
# Check out your DataFrame `df`
print(df)
# Define the new names of your columns
newcols = {
'A': 'new_column_1',
'B': 'new_column_2',
'C': 'new_column_3'
}
# Use `rename()` to rename your columns
df.rename(columns=newcols, inplace=True)
# Rename your index
df.rename(index={1: 'a'}) A B C
0 1 2 3
1 4 5 6
2 7 8 9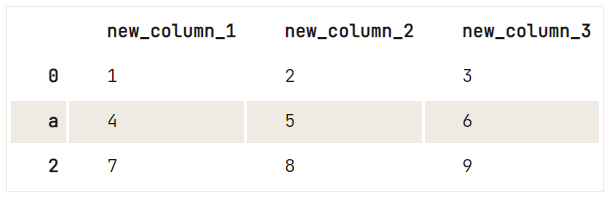
提示:尝试把第一步(重命名列)中的 inplace 改为 False,观察脚本结果。您会发现此时重命名列并未对原 DataFrame 进行重新赋值。因此,第二步将以原始 DataFrame 为输入,而不是第一步 rename() 返回的新 DataFrame。
超越 DataFrame 基础
完成第一组关于 Pandas DataFrame 的问题后,是时候进一步深入,撸起袖子大干一场了——DataFrame 的能耐远不止第一部分所见。
6. 如何格式化 Pandas DataFrame 中的数据
多数时候,您还需要对 DataFrame 中实际的取值进行一些操作。接下来的小节将介绍多种格式化 pandas DataFrame 值的方法。
替换 DataFrame 中出现的所有字符串
要替换 DataFrame 中的某些字符串,可直接使用 replace():传入想要替换的值,以及用于替换的新值。
如下所示:
df = pd.DataFrame({"Student1":['OK','Awful','Acceptable'],
"Student2":['Perfect','Awful','OK'],
"Student3":['Acceptable','Perfect','Poor']})
# Study the DataFrame `df` first
print(df)
# Replace the strings by numerical values (0-4)
df.replace(['Awful', 'Poor', 'OK', 'Acceptable', 'Perfect'], [0, 1, 2, 3, 4]) Student1 Student2 Student3
0 OK Perfect Acceptable
1 Awful Awful Perfect
2 Acceptable OK Poor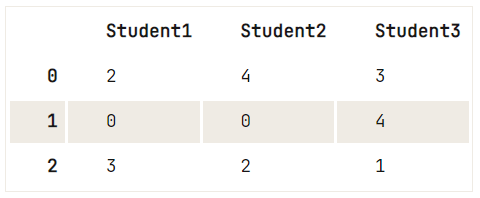
请注意,还有一个 regex 参数,当您面对奇怪的字符串组合时会非常有用:
df = pd.DataFrame([["1\n", 2, "3\n"], [4, 5, "6\n"] ,[7, "8\n", 9]])
# Check out your DataFrame `df`
print(df)
# Replace strings by others with `regex`
df.replace({'\n': ''}, regex=True) 0 1 2
0 1\n 2 3\n
1 4 5 6\n
2 7 8\n 9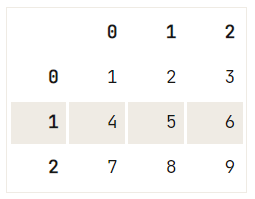
简而言之,当您需要将 DataFrame 中的值或字符串替换为其他内容时,replace() 基本能满足需求!
删除 DataFrame 单元格字符串中的部分内容
删除字符串中不需要的部分往往很费劲。幸运的是,有简便的方法!
df = pd.DataFrame([["+-1aAbBcC", "2", "+-3aAbBcC"], ["4", "5", "+-6aAbBcC"] ,["7", "+-8aAbBcC", "9"]])
# Check out your DataFrame
print(df)
# Delete unwanted parts from the strings in the first column
df[0] = df[0].map(lambda x: x.lstrip('+-').rstrip('aAbBcC'))
# Check out the result again
df 0 1 2
0 +-1aAbBcC 2 +-3aAbBcC
1 4 5 +-6aAbBcC
2 7 +-8aAbBcC 9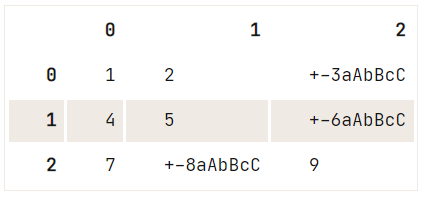
这里对列 result 使用了 map(),以便对该列的每个元素逐一应用 lambda 函数。该函数取得字符串值,去除左侧的 + 或 -,并去除右侧任意一个或多个 aAbBcC 字符。
将某列的文本拆分为 DataFrame 中的多行
这算是相对更难的格式化任务。不过,接下来的代码会带您完成每一步:
df = pd.DataFrame({"Age": [34, 22, 19],
"PlusOne":[0,0,1],
"Ticket":["23:44:55", "66:77:88", "43:68:05 56:34:12"]})
# Inspect your DataFrame `df`
print(df)
# Split out the two values in the third row
# Make it a Series
# Stack the values
ticket_series = df['Ticket'].str.split(' ').apply(pd.Series, 1).stack()
# Get rid of the stack:
# Drop the level to line up with the DataFrame
ticket_series.index = ticket_series.index.droplevel(-1)
print(ticket_series) Age PlusOne Ticket
0 34 0 23:44:55
1 22 0 66:77:88
2 19 1 43:68:05 56:34:12
0 23:44:55
1 66:77:88
2 43:68:05
2 56:34:12
dtype: object
0
0 23:44:55
1 66:77:88
2 43:68:05
2 56:34:12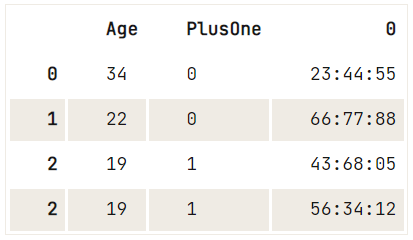
简而言之,您做了以下操作:
- 首先检查 DataFrame。您会发现最后一行最后一列的值有点长。看起来有两张票,因为有一位嘉宾带了一位同伴。
- 从 DataFrame
df中取出Ticket列,并按空格拆分字符串。这样最终两张票就会分布到两行。接着将这四个值(四个票号)放入一个 Series 对象中:
0 1
0 23:44:55 NaN
1 66:77:88 NaN
2 43:68:05 56:34:12- 看起来还不太对,其中有
NaN!您需要将 Series 堆叠(stack),以确保结果 Series 中不再包含NaN。 - 接着,您会看到 Series 已经堆叠。
0 0 23:44:55
1 0 66:77:88
2 0 43:68:05
1 56:34:12- 这也不理想。因此您删除最内层层级(drop level),以与 DataFrame 对齐:
0 23:44:55
1 66:77:88
2 43:68:05
2 56:34:12
dtype: object- 这就是您想要的。
- 将 Series 转换为 DataFrame,以便能将其合并回原始 DataFrame。不过,为避免产生重复,可以先删除原来的
Ticket列。
对 Pandas DataFrame 的列或行应用函数
您可能希望通过应用函数来调整 DataFrame 中的数据。我们先用自定义的 lambda 函数开始:
doubler = lambda x: x*2提示:若想进一步了解 Python 中的函数,请参阅这篇Python 函数教程。
df = pd.DataFrame(data=np.array([[1, 2, 3], [4, 5, 6], [7, 8, 9]]), columns=['A', 'B', 'C'])
# Study the `df` DataFrame
print(df)
# Apply the `doubler` function to the `A` DataFrame column
df['A'].apply(doubler)
A B C
0 1 2 3
1 4 5 6
2 7 8 9
0 2
1 8
2 14
Name: A, dtype: int64注意,您也可以选择 DataFrame 的某一行,并对其应用 doubler lambda 函数。记住,可以使用 .loc[] 或 .iloc[] 轻松选取一行。
然后,根据是按位置还是按标签选择索引,执行如下类似操作:
df.loc[0].apply(doubler)注意 apply() 仅沿 DataFrame 的轴应用 doubler 函数。这意味着目标要么是索引、要么是列,换言之,要么是一行,要么是一列。
不过,如果要对每个元素逐一应用,可使用 map()。只需将上述代码中的 apply() 替换为 map() 即可。别忘了仍需传入 doubler 函数以将值乘以 2。
假设您希望不仅对列 A,而是对整个 DataFrame 应用这个翻倍函数。这种情况下可以使用 applymap(),它会将 doubler 应用于 DataFrame 的每个元素:
doubled_df = df.applymap(doubler)
print(doubled_df) A B C
0 2 4 6
1 8 10 12
2 14 16 18注意,上述场景中我们使用了在运行时创建的 lambda(匿名)函数。当然,您也可以编写自定义函数。例如:
def doubler(x):
if x % 2 == 0:
return x
else:
return x * 2
# Use `applymap()` to apply `doubler()` to your DataFrame
doubled_df = df.applymap(doubler)
# Check the DataFrame
print(doubled_df) A B C
0 2 2 6
1 4 10 6
2 14 8 18如果想了解更多Python 中的控制流,可以查看我们的其他资源。
7. 如何创建一个空的 DataFrame
您将使用的函数是 Pandas 的 Dataframe():它需要您传入要放入的数据、索引和列。
请记住,DataFrame 中包含的数据不必是同一类型。可以是不同的数据类型!
使用该函数可以有多种方式来创建空 DataFrame。首先,可以用 numpy.nan 以 NaN 初始化数据框。请注意,numpy.nan 的类型为 float。
df = pd.DataFrame(np.nan, index=[0,1,2,3], columns=['A'])
print(df) A
0 NaN
1 NaN
2 NaN
3 NaN此时,数据框的数据类型默认是推断的:由于 numpy.nan 类型为 float,数据框也将包含 float 类型的值。不过,您也可以通过添加 dtype 属性强制 DataFrame 为某种类型。例如:
df = pd.DataFrame(index=range(0,4),columns=['A'], dtype='float')
print(df)
A
0 NaN
1 NaN
2 NaN
3 NaN注意,如果不指定轴标签或索引,它们会基于输入数据按常理构造。
8. Pandas 在导入数据时能识别日期吗?
Pandas 能识别,但您需要稍微帮它一下:在读取数据(例如 CSV 文件)时添加 parse_dates 参数:
import pandas as pd
pd.read_csv('yourFile', parse_dates=True)
# or this option:
pd.read_csv('yourFile', parse_dates=['columnName'])当然,总会出现奇怪的日期时间格式。
别担心!这种情况下,您可以自定义解析器来处理。比如编写一个 lambda 函数,按格式字符串解析日期时间。
import pandas as pd
dateparser = lambda x: pd.datetime.strptime(x, '%Y-%m-%d %H:%M:%S')
# Which makes your read command:
pd.read_csv(infile, parse_dates=['columnName'], date_parser=dateparse)
# Or combine two columns into a single DateTime column
pd.read_csv(infile, parse_dates={'datetime': ['date', 'time']}, date_parser=dateparse)9. 何时、为何以及如何重塑(reshape)您的 Pandas DataFrame
重塑 DataFrame 是指转换其结构,使结果更适合数据分析。换言之,重塑更多关注的是改变 DataFrame 的“形状”,而非其内部取值的格式化。
这回答了“何时与为何”。那么如何重塑?
常见的三种方式是:透视(pivoting)、堆叠与反堆叠(stacking/unstacking)、熔化(melting)。
对 DataFrame 进行透视(Pivot)
可以使用 pivot() 从原始表创建一个新的派生表。使用该函数时可传入三个参数:
values:指定原 DataFrame 中哪些值应出现在数据透视表中。columns:传入该参数的内容将成为结果表的列。index:传入该参数的内容将成为结果表的索引。
# Import pandas
import pandas as pd
# Create your DataFrame
products = pd.DataFrame({'category': ['Cleaning', 'Cleaning', 'Entertainment', 'Entertainment', 'Tech', 'Tech'],
'store': ['Walmart', 'Dia', 'Walmart', 'Fnac', 'Dia','Walmart'],
'price':[11.42, 23.50, 19.99, 15.95, 55.75, 111.55],
'testscore': [4, 3, 5, 7, 5, 8]})
# Use `pivot()` to pivot the DataFrame
pivot_products = products.pivot(index='category', columns='store', values='price')
# Check out the result
print(pivot_products)store Dia Fnac Walmart
category
Cleaning 23.50 NaN 11.42
Entertainment NaN 15.95 19.99
Tech 55.75 NaN 111.55当未明确指定结果表中应包含哪些值时,您会按多个列进行透视:
# Import the Pandas library
import pandas as pd
# Construct the DataFrame
products = pd.DataFrame({'category': ['Cleaning', 'Cleaning', 'Entertainment', 'Entertainment', 'Tech', 'Tech'],
'store': ['Walmart', 'Dia', 'Walmart', 'Fnac', 'Dia','Walmart'],
'price':[11.42, 23.50, 19.99, 15.95, 55.75, 111.55],
'testscore': [4, 3, 5, 7, 5, 8]})
# Use `pivot()` to pivot your DataFrame
pivot_products = products.pivot(index='category', columns='store')
# Check out the results
print(pivot_products)
price testscore
store Dia Fnac Walmart Dia Fnac Walmart
category
Cleaning 23.50 NaN 11.42 3.0 NaN 4.0
Entertainment NaN 15.95 19.99 NaN 7.0 5.0
Tech 55.75 NaN 111.55 5.0 NaN 8.0请注意,数据中不能存在您指定列组合的重复行。否则会报错。如果无法保证唯一性,请使用 pivot_table 方法替代:
# Import the Pandas library
import pandas as pd
# Your DataFrame
products = pd.DataFrame({'category': ['Cleaning', 'Cleaning', 'Entertainment', 'Entertainment', 'Tech', 'Tech'],
'store': ['Walmart', 'Dia', 'Walmart', 'Fnac', 'Dia','Walmart'],
'price':[11.42, 23.50, 19.99, 15.95, 19.99, 111.55],
'testscore': [4, 3, 5, 7, 5, 8]})
# Pivot your `products` DataFrame with `pivot_table()`
pivot_products = products.pivot_table(index='category', columns='store', values='price', aggfunc='mean')
# Check out the results
print(pivot_products)store Dia Fnac Walmart
category
Cleaning 23.50 NaN 11.42
Entertainment NaN 15.95 19.99
Tech 19.99 NaN 111.55注意传给 pivot_table 的额外参数 aggfunc。该参数表示使用某个聚合函数来合并多个值。本例中使用了 mean。
使用 stack() 和 unstack() 重塑 DataFrame
您在第 5 节已见过堆叠的例子。实质上,堆叠会让 DataFrame 变“高”:将最内层列索引移动为最内层行索引。返回的 DataFrame 将拥有一个新的最内层行标签级别。
Go back to the full walk-through in section 5 if you’re unsure of the workings ofstack().
与堆叠相反的是反堆叠。与 stack() 类似,unstack() 会把最内层行索引移动为最内层列索引。
关于 pandas 的 pivot、stack 与 unstack 的讲解,请查看我们的pandas 数据重塑课程。
使用 melt() 重塑 DataFrame
当数据包含一个或多个标识变量(identifier variables),而其他列均为测量变量(measured variables)时,melt 十分有用。
这些测量变量都会被“反透视”至行轴。也就是说,本来分布在 DataFrame 宽度上的测量变量,会被放到其高度上。换言之,您的 DataFrame 会变“长”而非“宽”。
最终会得到两个非标识列,即“variable”和“value”。
举例说明:
# The `people` DataFrame
people = pd.DataFrame({'FirstName' : ['John', 'Jane'],
'LastName' : ['Doe', 'Austen'],
'BloodType' : ['A-', 'B+'],
'Weight' : [90, 64]})
# Use `melt()` on the `people` DataFrame
print(pd.melt(people, id_vars=['FirstName', 'LastName'], var_name='measurements')) FirstName LastName measurements value
0 John Doe BloodType A-
1 Jane Austen BloodType B+
2 John Doe Weight 90
3 Jane Austen Weight 64如果您在寻找更多重塑数据的方法,请查阅官方文档。
10. 如何遍历 Pandas DataFrame
可以结合 for 循环与对 DataFrame 调用 iterrows() 来遍历其各行:
df = pd.DataFrame(data=np.array([[1, 2, 3], [4, 5, 6], [7, 8, 9]]), columns=['A', 'B', 'C'])
for index, row in df.iterrows() :
print(row['A'], row['B'])1 2
4 5
7 8iterrows() 允许高效地将 DataFrame 的各行作为(索引,Series)对来遍历。换句话说,它返回(index,row)元组。
11. 如何将 Pandas DataFrame 写入文件
当您使用 Pandas 完成数据清洗与处理后,可能希望将 DataFrame 导出为其他格式。本节将介绍两种导出方式:CSV 与 Excel。
将 DataFrame 导出为 CSV
要将 DataFrame 写为 CSV 文件,使用 to_csv():
import pandas as pd
df.to_csv('myDataFrame.csv')这段代码看似简单,但对多数人而言难点恰从这里开始,因为您往往对输出有特定需求。也许您不想用逗号作为分隔符,或者需指定特定编码。
别担心!可以向 to_csv() 传入更多参数,确保数据按您的意愿输出!
- 用制表符分隔,使用
sep参数:
import pandas as pd
df.to_csv('myDataFrame.csv', sep='\t')- 使用特定字符编码,使用
encoding参数:
import pandas as pd
df.to_csv('myDataFrame.csv', sep='\t', encoding='utf-8')- 此外,您可以指定如何表示
NaN或缺失值、是否输出表头、是否写出行名、是否压缩等,您可以阅读相关选项。
将 DataFrame 写入 Excel
类似导出为 CSV,您可以使用 to_excel() 将表格写入 Excel。但操作会稍微复杂一些:
import pandas as pd
writer = pd.ExcelWriter('myDataFrame.xlsx')
df.to_excel(writer, 'DataFrame')
writer.save()不过请注意,与 to_csv() 一样,这里也有许多额外参数,例如 startcol、startrow 等,以确保正确输出数据。想要了解如何使用 pandas 从 CSV 导入数据并导出到 CSV,请查看我们的教程。
如果需要了解 Pandas 的更多 IO 工具,请参阅 pandas 的DataFrame 导出到 Excel 文档。
数据科学中的 Python 远不止 DataFrame
就是这样!您已顺利完成 Pandas DataFrame 教程!
以上 11 个常见问题的答案涵盖了导入、清洗与处理数据所需的基本函数。还不确定自己是否深入掌握?我们的 Importing Data In Python 课程会帮到您!如果您已经上手,不妨看看 Pandas 在真实项目中的表现。强烈推荐阅读教程系列数据科学与机器学习流水线中的预处理重要性,以及开放课程 Introduction to Python & Machine Learning。
Pandas 是一个广受欢迎的 Python 包,在数据科学领域名声在外:它提供了强大、表达力强且灵活的数据结构,使数据处理与分析变得轻松易行,DataFrame 正是其中之一。
本教程围绕 pandas DataFrame 展开,从基础操作到进阶用法,解答 11 个最常见问题,帮助您理解并避开前人踩过的坑。
想要更多练习?免费试学 Pandas DataFrame 课程的第一章!
什么是 pandas DataFrame?
开始之前,先快速回顾一下什么是 DataFrame。
熟悉 R 的读者知道,数据框是一种以矩形网格存储数据的方式,便于总览。每一行对应一个实例的测量或取值,而每一列是包含某个变量数据的向量。这意味着数据框的各行不必是同一类型的值:可以是数值、字符、逻辑值等。
Python 中的 DataFrame 与此非常相似:它来自 pandas 库,定义为二维带标签的数据结构,各列可包含不同类型的数据。
一般来说,pandas 的 DataFrame 包含三个主要组成部分:数据、索引(index)和列(columns)。
DataFrameSeries:一维带标签数组,可持有任意数据类型并带有轴标签或索引。Series 对象的一个例子就是 DataFrame 的一列。ndarray,可以是记录型或结构化数组ndarrayndarray、列表、字典或 Series 组成的字典。注意
np.ndarray与np.array()的区别。前者是实际的数据类型,后者是从其他数据结构创建数组的函数。结构化数组允许用户按字段名操作数据:在下面的示例中,创建了一个包含三个元组的结构化数组。每个元组的第一个元素命名为
foo且类型为int,第二个元素命名为bar且为浮点型。另一方面,记录数组扩展了结构化数组的特性。它允许用户通过属性而不是索引访问结构化数组的字段。如下所示,在记录数组
r2中访问了foo值。示例:
如果您仍然不确定 Pandas DataFrame 与其他数据结构(如 NumPy 数组或 Series)的区别,可以观看下方简短的演示:
注意 本文多数情况下已经为您导入了所需库。Pandas 通常以别名
pd导入,NumPy 以np导入。请记住 在您自己的数据科学环境中编写代码时,不要忘了如下导入步骤:现在,您已经清楚什么是 DataFrame、它能做什么,以及它与其他结构的差异,接下来就来攻克使用它们时最常见的问题!