programa
La inteligencia empresarial (BI) es el corazón de las decisiones basadas en datos. Combina la analítica, la minería de datos, las visualizaciones de datos y el uso de herramientas e infraestructuras de datos para hacer realidad el proceso de toma de decisiones.
El BI ayuda a canalizar el poder de los datos para tomar mejores decisiones que mejoren el rendimiento, reduzcan los costes, gestionen los riesgos y comprendan el mercado.
Cuando se trata de utilizar herramientas de BI, no se trata de una decisión única. Las organizaciones deben tener en cuenta distintos aspectos, como el objetivo de la empresa, las fuentes de datos, las integraciones, la colaboración, etc.
Si nos centramos principalmente en las herramientas de BI, hay dos que son actualmente los principales contendientes en el panorama del BI: Tableau y Looker Studio (Antes Google Data Studio).
Looker contra Tabla comparativa de Tableau
Si tienes poco tiempo, hemos creado la siguiente tabla para que te sirva de referencia rápida sobre las principales diferencias y similitudes entre Looker y Tableau:
|
Mira |
Tableau |
|
|
Soporte nativo |
Productos Google |
Productos Salesforce |
|
Lengua materna |
MiraLM |
VizQL |
|
Número de fuentes de datos compatibles |
1000+ |
100+ |
|
Preparación e integración de datos |
Precisión y control. Se integra con diversas fuentes de datos |
Prepara los datos con la preparación de Tableau Amplia conectividad de fuentes de datos |
|
Modelización de datos |
Enfoque "primero el código" con LookML |
Función arrastrar y soltar para una facilidad visual e intuitiva |
|
Capacidades de visualización |
Énfasis en la exactitud y coherencia de los datos |
Énfasis en lo visual y en la narración de datos |
|
Analítica |
Centrarse en la precisión, el análisis basado en SQL y las métricas personalizadas |
Enfoque analítico ampliado y flexibilidad con campos calculados y análisis ad hoc |
|
Gobernanza |
Gestión centralizada de datos con LookML |
Requiere medidas adicionales para garantizar que el análisis ad hoc no afecte a la coherencia y exactitud de los datos |
|
Colaboración |
Control de versiones e integrado con Google Workspace |
Cuadros de mando interactivos que pueden compartirse de diversas formas |
|
Curva de aprendizaje |
Mayor curva de aprendizaje debido a la naturaleza técnica de LookML |
Baja curva de aprendizaje, ya que está diseñado específicamente para todos los niveles |
|
Coste |
- Usuario desarrollador: 125 $/usuario/mes |
- Creador: 75 $/usuario/mes |
Entendiendo Looker vs Tableau
Empecemos por examinar cada una de las herramientas, comprendiendo cuáles son sus principales usos.
¿Qué es Looker?
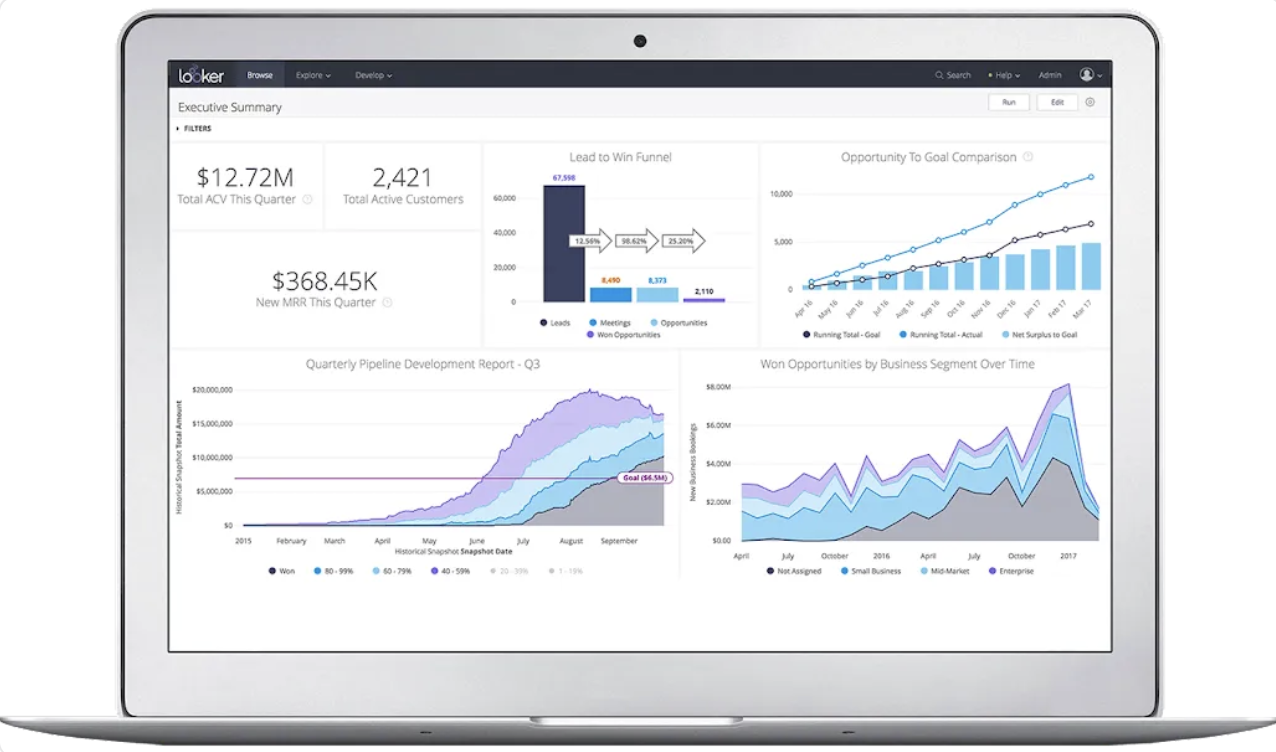
Adquirida por Google en 2019 y ahora parte de Google Cloud Platform (GCP), Looker es una plataforma empresarial para BI, aplicaciones de datos y analítica integrada. La herramienta se ha diseñado para empresas de todos los tamaños.
El corazón de Looker son sus capacidades de modelado de datos mediante LookML, abreviatura de Looker Modelling Language, que permite a los analistas de datos encontrar relaciones entre los datos y crear modelos a los que otros usuarios pueden acceder y explorar.
Looker se integra perfectamente con el GCP, con herramientas como BigQuery
permitiendo a los usuarios analizar grandes conjuntos de datos en tiempo real. La interfaz de fácil manejo permite a los usuarios explorar los datos sin necesidad de conocimientos técnicos.

Imagen de Google Cloud
¿Qué es Tableau?
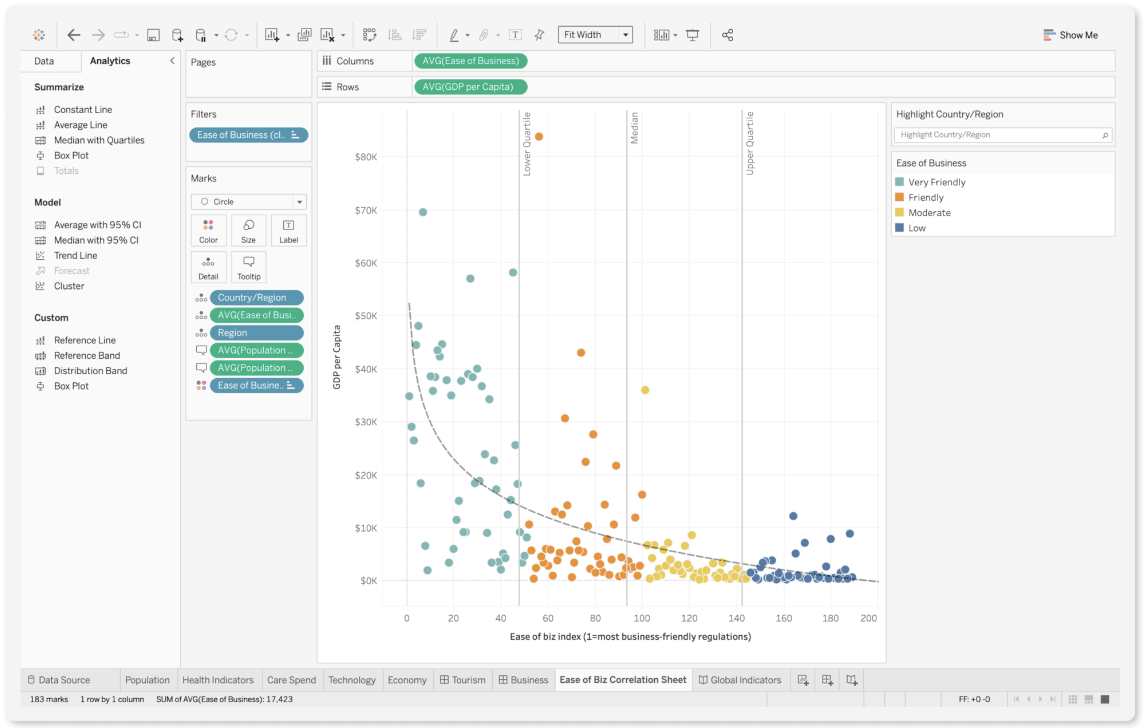
Fundada en 2003 y adquirida por Salesforce en 2019, Tableau es una plataforma de análisis visual muy conocida por su amplia gama de funciones de visualización de datos. Ha transformado la forma en que las empresas entienden y aprovechan sus datos. El lenguaje nativo de Tableau es VizQL, un lenguaje de consulta y visualización de datos.
Cuando se trata de visualización de datos, Tableau marca la pauta con su interfaz de arrastrar y soltar. Los usuarios pueden crear gráficos, diagramas y cuadros de mando complejos, haciéndolos accesibles a todos los usuarios de todos los niveles para que puedan comprender los patrones y tendencias de los datos.
Aparte de sus capacidades de visualización de datos, Tableau ofrece sólidas funciones de análisis de datos que pueden conectarse a cualquier fuente de datos, lo que proporciona flexibilidad en la exploración de datos. Su potente motor de datos en memoria ofrece un rápido procesamiento de datos, cálculos estadísticos, modelos predictivos y análisis en tiempo real.

Imagen de Tableau
Looker vs Tableau: Comparación de funciones básicas
Comparemos algunas de las características clave de las dos herramientas para ver en qué se parecen y en qué se diferencian:
Modelado y gestión de datos
El modelado y la gestión de datos son elementos importantes del BI y el análisis de datos. Actúan como base para comprender, almacenar, organizar y utilizar los datos de la forma más eficaz posible.
Cuando se trata de gestionar y normalizar datos, LookML se lleva la palma.
Permite a los usuarios definir la lógica empresarial, comprender las relaciones entre los datos y realizar cálculos directamente en la plataforma. Este enfoque garantiza que el proceso de análisis de datos sea coherente y preciso, lo que es fundamental para la gobernanza de los datos.
Las organizaciones también pueden aplicar políticas de gobernanza para garantizar aún más la calidad, el cumplimiento y la seguridad de los datos.
Por otro lado, el enfoque de Tableau sobre el modelado y la gestión de datos se centra en la flexibilidad de la plataforma y la comodidad de los usuarios.
La interfaz de Tableau permite a los usuarios manejar diversas estructuras de datos sin necesidad de conocimientos de programación. La función de arrastrar y soltar permite a los usuarios crear relaciones entre los datos y realizar cálculos con facilidad.
Sus capacidades de gestión de datos se ven reforzadas por su función de Modelo de Datos, que permite la integración de múltiples fuentes de datos en una única vista.

Imagen de DALL-E
Capacidades de visualización
Las visualizaciones son un elemento clave para los analistas de BI y otras partes interesadas, ya que tienen un impacto directo en su proceso de toma de decisiones.
Looker es potente y fácil de usar, y hace que la creación de visualizaciones como gráficos y diagramas sea sencilla y eficaz. Los usuarios pueden crear cuadros de mando interactivos que ofrezcan una visión global de las métricas y tendencias con el uso de diversos tipos de gráficos.
Looker también ofrece una función de desglose que permite a los usuarios explorar los datos con más detalle y hacer ajustes con filtros.
Sin embargo, Looker tiene limitaciones en cuanto a sus capacidades de visualización. Por ejemplo, hay limitaciones para poder personalizar distintos tipos de visualizaciones, como el comportamiento de determinados tipos de gráficos. LookML tampoco es fácil de manejar, ya que necesitarás tener un buen conocimiento de LookML para navegar por todo su potencial.
Otra limitación es que la plataforma se dirige a la analítica básica e intermedia. Por tanto, los usuarios que necesiten estadísticas avanzadas o modelos predictivos dentro de las visualizaciones tendrán que integrar otras herramientas.
Tableau lidera la visualización de datos. Conocido por su interfaz intuitiva y sus análisis, los usuarios pueden transformar sus complejos conjuntos de datos en atractivas historias visuales. También admite muchas fuentes de datos y tiene varias opciones de visualización, como mapas de calor y gráficos de dispersión.
Tableau está mejorando continuamente la plataforma con la integración de IA y ML para el análisis, reafirmando su posición como líder en visualización de datos.
Preparación e integración de datos
Preparar tus datos antes de que pasen por la fase de análisis es donde se produce la magia antes de que se integren para ayudar en el proceso de toma de decisiones.
LookML tiene un entorno de "primero el código" que garantiza la precisión y el control de la preparación e integración de datos en la plataforma. Esto va de la mano con su enfoque de control de versiones, que garantiza que los datos sean coherentes, reutilizables y fáciles de mantener.
Looker también puede integrarse con una amplia gama de fuentes de datos, como Google BigQuery, lo que permite reunir los datos a la perfección para preparar la fase de análisis.
Tableau tiene una herramienta llamada Tableau Prep, que facilita la limpieza y preparación de datos sin necesidad de conocimientos técnicos. La interfaz de arrastrar y soltar hace que las complejas tareas de preparación de datos sean mucho más sencillas y accesibles para todo el mundo. Tableau también ofrece una integración perfecta con una amplia gama de cursos de datos, como Amazon Redshift, bases de datos SQL, etc.
Estas amplias conexiones permiten a los usuarios combinar sus datos, analizarlos y crear visualizaciones o cuadros de mando únicos.
Tabla comparativa de funciones básicas
En la tabla siguiente, hemos recopilado las principales características de cada herramienta para que puedas compararlas rápidamente:
| Función | Mira | Tableau |
|---|---|---|
| Modelado y gestión de datos | - Utiliza LookML para definir la lógica empresarial, comprender las relaciones entre datos y realizar cálculos. - Garantiza un análisis de datos coherente y preciso.- Gran atención a la gobernanza y las políticas de datos. |
- Interfaz flexible centrada en la comodidad del usuario. - Funcionalidad de arrastrar y soltar para crear relaciones y cálculos. - La función Modelo de datos integra múltiples fuentes de datos en una sola vista. |
| Capacidades de visualización | - Plataforma fácil de usar para crear gráficos, diagramas y cuadros de mando interactivos. - Capacidades de desglose para una exploración detallada de los datos. - Personalización limitada para visualizaciones avanzadas. - Requiere conocimientos de LookML. |
- Líder del sector en visualización de datos. - Interfaz intuitiva para crear historias visuales atractivas. - Admite una amplia gama de visualizaciones (por ejemplo, mapas de calor, gráficos de dispersión). - Integra IA/ML para análisis avanzados. |
| Preparación e integración de datos | - Entorno de código primero con preparación de datos controlada por versiones. - Garantiza la precisión, coherencia y reutilización. - Se integra con fuentes de datos como Google BigQuery para una preparación de análisis sin fisuras. |
- Tableau Prep simplifica la limpieza y preparación de datos con una interfaz de arrastrar y soltar. - No requiere conocimientos técnicos. - Se integra con varias fuentes de datos como Amazon Redshift y bases de datos SQL. |
Looker vs Tableau: Habilidades analíticas

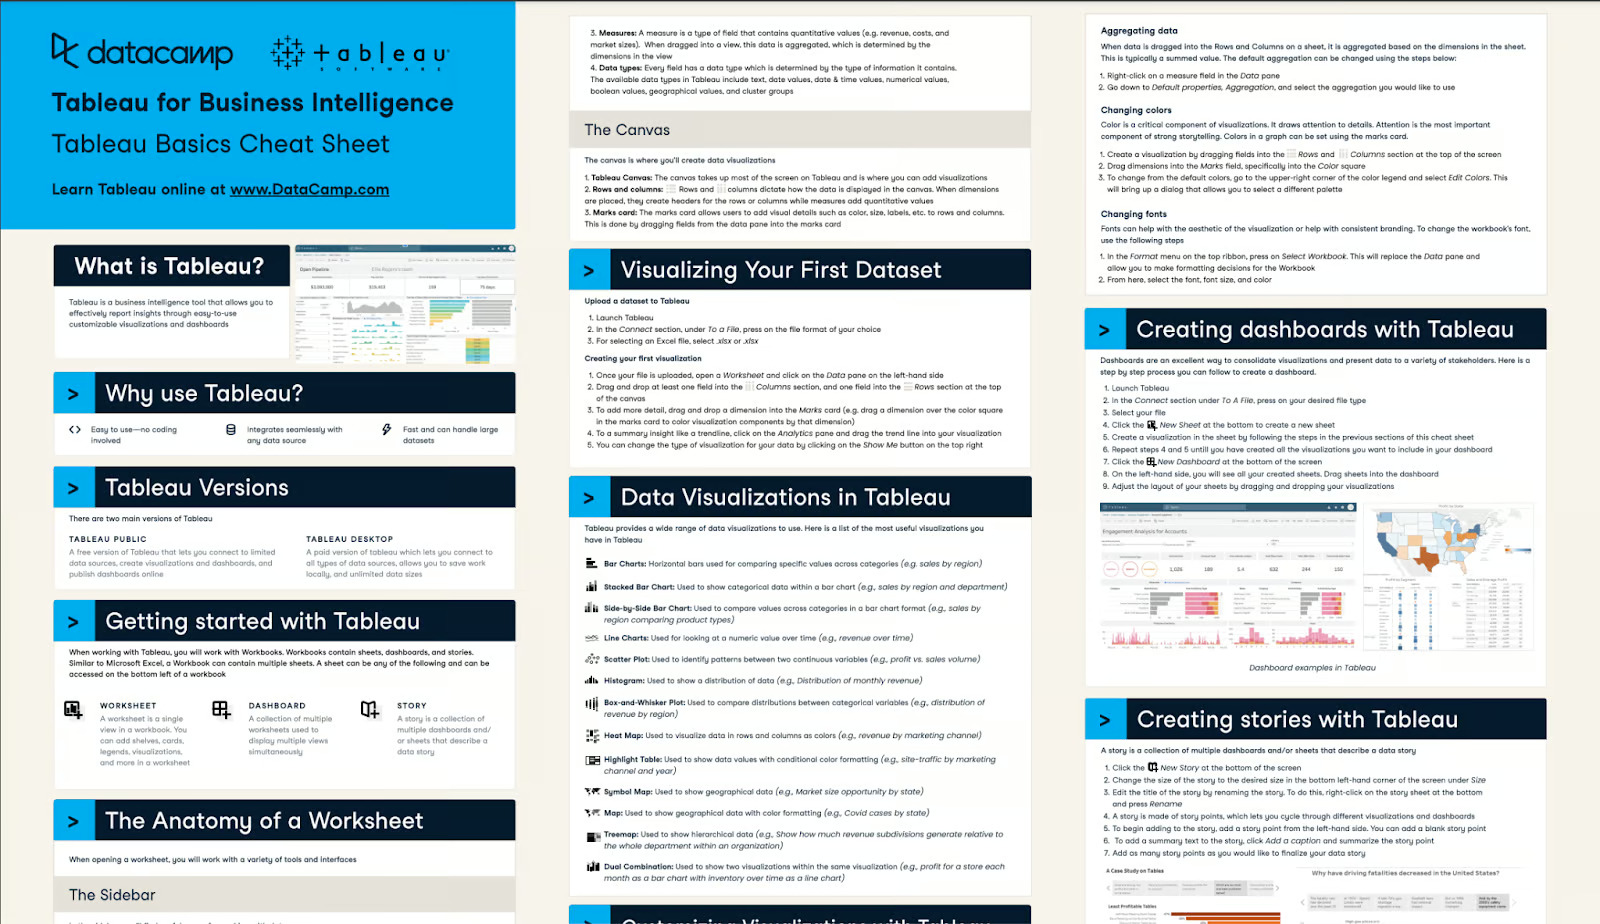
Nuestra Tableau Cheat Sheet muestra los usos de la herramienta para el análisis empresarial
Analítica y gobernanza
Cuando se trata de gobernanza de datos y datos a escala empresarial, Looker se lleva la victoria. La capa unificada de LookML es fundamental para su modelo de gobernanza. Este enfoque garantiza que los usuarios trabajen con un conjunto coherente de definiciones, cálculos y conclusiones para mejorar la precisión de los datos.
Su enfoque de "primero el código", así como sus controles de permisos y acceso, garantizan la correcta gestión del acceso a los datos, manteniendo la seguridad y el cumplimiento. Looker puede escalar eficazmente en función de las necesidades de una organización, integrando almacenes de datos modernos y soportando análisis en tiempo real.
Por otro lado, Tableau es muy conocido por su flexibilidad y su interfaz fácil de usar. Los usuarios pueden realizar análisis ad hoc, perspectivas personalizadas y utilizar funciones como los campos calculados para necesidades empresariales específicas. Como ya sabemos, el poder de Tableau reside en su capacidad para garantizar que todos los usuarios de todos los niveles puedan utilizar la plataforma cómodamente.
Sin embargo, dicho esto, esta flexibilidad para los usuarios también supone un reto en la gobernanza.
Los campos calculados y los análisis creados por el usuario pueden dar lugar a incoherencias compartidas por la organización. El enfoque de lógica empresarial centralizada de Looker en LookML tiene una mejor gestión en comparación con Tableau, que requiere una gestión cuidadosa y otras prácticas para garantizar que el análisis ad hoc no afecte a la coherencia y precisión de los datos.
Looker vs Tableau: Colaboración y usabilidad
La colaboración y la usabilidad son dos aspectos que garantizan el éxito de la utilización de las herramientas de BI, como la mejora de la toma de decisiones, la mejora de la productividad, etc.
Funciones de colaboración
Una de las principales características de colaboración de Looker es su sólido sistema de control de versiones, arraigado en su entorno de código en LookML. Los cambios realizados en los modelos de datos y cuadros de mando se rastrean y revisan, y también se pueden revertir. Esto ofrece un entorno de colaboración para que los miembros del equipo contribuyan, revisen y sobrescriban los trabajos de otros miembros.
Looker también está integrado con Google Workspace, lo que mejora el proceso general de colaboración. Los usuarios pueden trabajar con herramientas conocidas como Google Sheets para analizar y visualizar datos. Los miembros del equipo pueden colaborar más eficazmente y compartir ideas en su plataforma preferida.
Por otro lado, la interfaz fácil de usar de Tableau, junto con sus capacidades de uso compartido, hace que sus funciones de colaboración sean más atractivas para los usuarios no técnicos. Los cuadros de mando son interactivos y se han diseñado específicamente para que sean fácilmente compartibles y comprensibles. Los usuarios pueden comentar los cuadros de mando, añadirlos a páginas web y compartirlos en las redes sociales.
Experiencia de usuario y curva de aprendizaje
El enfoque "primero el código" de Looker ofrece precisión y control. Sin embargo, este enfoque centrado en el código es beneficioso sobre todo para los usuarios con formación técnica y presenta una curva de aprendizaje más pronunciada. Esto puede no ser beneficioso para todas las organizaciones que requieren que todos los usuarios empresariales interactúen con su herramienta de BI.
Por otro lado, la interfaz de arrastrar y soltar de Tableau y su capacidad para crear visualizaciones y cuadros de mando sin necesidad de conocimientos técnicos es más tentadora. Los usuarios pueden limpiar y preparar el código para el análisis sin escribir ningún código. Esto proporciona a Tableau la ventaja para las organizaciones que buscan perspectivas impactantes sin conocimientos técnicos.
Si estás intrigado sobre cómo aprender Tableau, consulta nuestra guía independiente que te ofrece todos los pasos y recursos que necesitas para empezar.
Comparación de costes: Looker contra Tableau
Al elegir entre herramientas de inteligencia empresarial como Looker y Tableau, el coste es una consideración clave. Aquí tienes un desglose de sus estructuras de precios para ayudarte a tomar una decisión informada.
Precios de Tableau
1. Planes estándar
- Tableau Creator: 75 $/usuario/mes (facturado anualmente). Este plan incluye Tableau Desktop, Tableau Prep Builder y una licencia de Creador en Tableau Cloud o Server. También viene con Tableau Pulse (disponible sólo en Tableau Cloud). Nota: Cada implantación requiere al menos una licencia de Creador.
- Tableau Explorer: 42 $/usuario/mes (facturado anualmente). Ideal para usuarios que buscan explorar datos fiables y responder a sus propias preguntas con análisis completos de autoservicio.
- Visor de Tableau: 15 $/usuario/mes (facturado anualmente). Diseñado para usuarios que sólo necesitan ver e interactuar con cuadros de mando y visualizaciones en un entorno seguro.
2. Planes de empresa
- Enterprise Creator: 115 $/usuario/mes (facturación anual). Este plan se basa en la licencia de Creador con funciones avanzadas de administración y gestión de datos de nivel empresarial, que incluyen Tableau Desktop, Prep Builder y un año de eLearning para Creadores.
- Enterprise Explorer: 70 $/usuario/mes (facturación anual). Ofrece análisis de autoservicio de rendimiento optimizado con herramientas de gestión de datos de nivel empresarial. También incluye un año de eLearning para Exploradores.
- Visor para empresas: 35 $/usuario/mes (facturación anual). Proporciona acceso seguro a los cuadros de mando con funciones de gestión de datos de nivel empresarial.
3. Paquete Tableau+: Para las organizaciones que desean ampliar los análisis en sus equipos, Tableau+ ofrece experiencias avanzadas basadas en IA, herramientas de gestión y recursos para la adopción empresarial. Precio: Disponible previa solicitud.
Precios Looker
1. Planes estándar
- Usuario desarrollador: 125 $/usuario/mes. Diseñado para usuarios técnicos, este plan proporciona acceso al entorno de desarrollo de Looker para gestionar modelos de datos.
- Usuario estándar: 60 $/usuario/mes. Perfecto para usuarios que necesitan acceder a herramientas de elaboración de informes y visualización.
- Usuario espectador: 30 $/usuario/mes. Una opción básica para quienes sólo necesitan ver e interactuar con informes y cuadros de mando.
2. Edición estándar
- Looker Edición Estándar: 5.000 $ por instancia. Una solución integral de BI para organizaciones, que ofrece sólidas capacidades de modelado y visualización de datos.
3. Opción de prueba
- Juicio Looker: Gratis. Looker ofrece una prueba gratuita para que puedas explorar sus funciones antes de comprometerte.
Looker vs Tableau: ¿Cuál es el mejor para ti?
A la hora de elegir la herramienta de BI adecuada para tu organización y tus necesidades de análisis de datos, hay varios factores que debes tener en cuenta:
- Los requisitos específicos
- La estrategia de datos
- Las capacidades de tu equipo
Estos factores clave actuarán como no negociables a la hora de elegir las herramientas adecuadas.
Looker es más adecuado para las organizaciones que dan prioridad a la gobernanza centralizada de los datos y a los flujos de trabajo impulsados por los desarrolladores. Con su lenguaje de modelado LookML, Looker permite un control preciso sobre las definiciones de datos y la coherencia entre equipos. Es una opción excelente para las empresas que utilizan Google Cloud, ya que se integra perfectamente con Google BigQuery y otras herramientas. Looker también destaca en la analítica integrada, que permite a las empresas integrar la analítica en sus productos o aplicaciones de cara al cliente.
Tableau destaca por su accesibilidad y sus avanzadas capacidades de visualización. Su intuitiva interfaz de arrastrar y soltar facilita a los usuarios sin conocimientos técnicos la creación de cuadros de mando e informes interactivos. Tableau admite una amplia variedad de fuentes de datos, lo que lo hace ideal para empresas que trabajan con sistemas diversos. Para las organizaciones que necesitan visualizaciones muy personalizadas o análisis ad hoc, Tableau ofrece potentes herramientas y funciones mejoradas con IA. Además, las soluciones empresariales de Tableau se adaptan bien a las grandes implantaciones y ofrecen sólidas herramientas de gestión y colaboración.
Teniendo esto en cuenta, te recomiendo
- Las organizaciones con muchos datos que se centran en la gobernanza deberían elegir Looker por sus sólidas capacidades de modelado de datos, precisión y control.
- Las organizaciones que necesitan información rápida y facilidad de uso deberían elegir Tableau, ya que es fácil de usar, tiene una curva de aprendizaje más baja y la función de arrastrar y soltar facilitará tus análisis.
- Las organizaciones que necesiten una buena herramienta para la preparación e integración de datos deben elegir Tableau por su herramienta Tableau Prep implementada.
- Para una mejor colaboración y exploración interactiva, las organizaciones deberían elegir Tableau por sus cuadros de mando interactivos y su capacidad para compartir.
Puede ser difícil determinar realmente las capacidades de una herramienta si no has podido probarla. Si quieres saber de qué va Tableau sin pagar por ello, echa un vistazo a nuestro tema Fundamentos de Tableau, que cubre todo lo que necesitas saber.
Aprendiz entusiasta, que busca poner en práctica mis conocimientos técnicos de ciencia de datos y mis sólidas habilidades interpersonales, para mejorar y ampliar mis conocimientos técnicos y mi capacidad de redacción.
Hice la transición al mundo de la Ciencia de Datos desde la Farmacología, cursando un bootcamp de 9 meses con la escuela Lambda.
Me interesa poner en práctica y mejorar mis habilidades técnicas de codificación y redacción en Aprendizaje Automático e Inteligencia Artificial.
Actualmente soy científico de datos y redactor técnico autónomo.
