
Programma
Nozioni di base sugli agenti AI
6 h
You send an image to a vision API asking it to read a small price label. The response comes back confident and wrong. Same story with counting objects in a cluttered photo: the model glances at the full image once and guesses a number that's way off.
Gemini 3 Flash handles this differently. With code execution turned on, it can write and run Python mid-response to crop, zoom, and annotate images before committing to an answer. Google calls this agentic vision and reports a 5-10% quality lift on vision benchmarks.
This tutorial walks through four examples that get progressively harder: reading fine print from a grocery shelf, pulling drink names off a dimly lit bar menu, counting scattered coins, and extracting table data into a chart.
The idea is straightforward. With code execution active, Gemini 3 can stop mid-response, write and run Python in a sandbox, look at what the code produced, and decide what to do next.
For vision tasks, this usually means the model is cutting out regions of an image, enlarging them, drawing bounding boxes, or adjusting contrast to pull out details that aren't visible at the original resolution.
This plays out as a three-phase loop.

During Think, the model looks at what it has (the original image, or a version it already cropped or annotated) and plans its next move. It might decide a price label is too small to read and needs to be cropped and enlarged.
Act turns that plan into Python. The sandbox has 43 pre-installed libraries (PIL, OpenCV, matplotlib, and more), so the model can write whatever image processing code it needs.
After the code runs, Observe closes the loop. Output (new images, printed text, computed values) feeds back into context. From there, the model either answers or goes around again.
A single API call can cycle through this loop multiple times. In the examples ahead, you'll see it crop seven shelf regions in one request. In another, it extracts table data into a pandas DataFrame and generates a bar chart, all within the same call.
If the agentic loop concept is new to you, DataCamp's AI Agent Fundamentals track covers it in depth.
Grab an API key from ai.google.dev and store it as GOOGLE_API_KEY in your environment or a .env file. Then install the SDK and image libraries:
pip install google-genai python-dotenv Pillow matplotlib opencv-pythonStart by creating the client:
from google import genai
from google.genai import types
from dotenv import load_dotenv

load_dotenv()

client = genai.Client(
    http_options=types.HttpOptions(timeout=600_000)
)
MODEL = "gemini-3-flash-preview"
That timeout=600_000 matters. Agentic vision calls involve multiple rounds of code generation and execution inside the sandbox, and a single request can take around four minutes.
The default httpx timeout will kill the connection well before that, leaving you with a silent ReadTimeout and no clue what happened.
Next, set up the agentic config:
agentic_config = types.GenerateContentConfig(
    tools=[types.Tool(code_execution=types.ToolCodeExecution())],
	thinking_config=types.ThinkingConfig(
    	thinking_level="HIGH",
    	include_thoughts=True
	),
    media_resolution=types.MediaResolution.MEDIA_RESOLUTION_HIGH,
)
tools is the on-switch for code execution. It gives the model a sandboxed Python environment with 43 libraries (numpy, pandas, PIL, matplotlib, OpenCV, and more). Each code block gets 30 seconds to run, and the sandbox retries up to 5 times on errors.
thinking_level="HIGH" gives the model more room to plan before writing code. For multi-step vision work, this makes a noticeable difference. Setting include_thoughts=True exposes that reasoning in the response parts, useful for debugging.
media_resolution sets how many tokens the input image gets before the loop even starts. MEDIA_RESOLUTION_HIGH is a good default. You can push it to MEDIA_RESOLUTION_ULTRA_HIGH for very dense images or drop to MEDIA_RESOLUTION_LOW when speed matters more than detail.
This same setup works on Vertex AI with minimal changes. For a broader walkthrough of the Gemini 3 API beyond vision, see the companion tutorial.
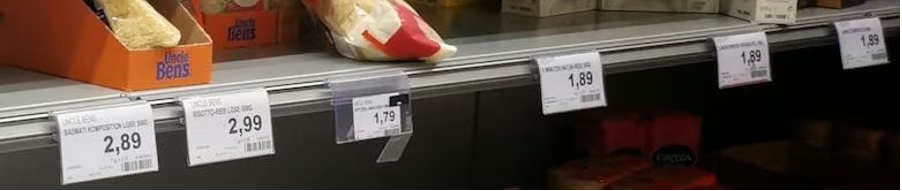
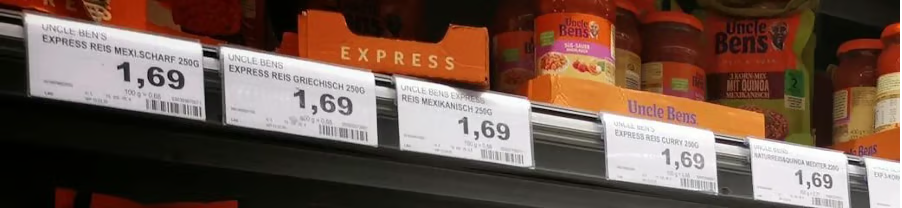
The image below is a German grocery store shelf with three rows of products. Price labels line each shelf edge, and a "Liebe Kunden" (Dear Customers) notice sits near the bottom. The labels are readable if you zoom in yourself, but small enough that a model looking at the full image has to decide what it can and can't make out.

Agentic responses aren't single text blocks. They arrive as a list of parts: thinking, code the model wrote, execution results, generated images, and the final answer. This helper walks through them:
def print_response(response, show_thoughts=False):
	for part in response.candidates[0].content.parts:
    	if part.thought and show_thoughts:
        	print("[THINK]", part.text[:500])
    	elif part.executable_code:
        	print("[CODE]")
        	print(part.executable_code.code)
    	elif part.code_execution_result:
        	print(f"[RESULT] ({part.code_execution_result.outcome})")
            print(part.code_execution_result.output)
    	elif part.inline_data:
        	print(f"[IMAGE] {part.inline_data.mime_type}, "
                  f"{len(part.inline_data.data):,} bytes")
    	elif part.text:
        	print("[ANSWER]", part.text)
Every example in this tutorial uses the same function, so define it once and reuse it.
Now load the shelf image and write a prompt that asks the model to read the sign and list every product with its price.
from pathlib import Path

image_path = Path("images/grocery_shelf.jpg")
image_part = types.Part.from_bytes(
	data=image_path.read_bytes(), mime_type="image/jpeg"
)

prompt = (
	"Read the 'Liebe Kunden' sign at the bottom of the shelf. "
	"What does it say? Also list all visible product names "
	"and their prices from the shelf labels."
)
Run it first without code execution:
standard_config = types.GenerateContentConfig(
    media_resolution=types.MediaResolution.MEDIA_RESOLUTION_HIGH,
)

standard_response = client.models.generate_content(
	model=MODEL,
	contents=[image_part, prompt],
	config=standard_config,
)
print_response(standard_response)
Here's a trimmed version of the output:
[ANSWER] Based on the image provided, here is the information requested:
### The 'Liebe Kunden' Sign
> "Dear Customers, unfortunately, we must inform you that due to
> increased demand, we cannot currently offer all products..."
### Product Names and Prices (from shelf labels)
**Top Row Labels:**
* Uncle Ben's Express Reis Mexi-Scharf 250g: 1,69
* Uncle Ben's Express Reis Griechisch 250g: 1,69
* Uncle Ben's Express Reis Curry 250g: 1,69
* Channa Masala 300g (partially obscured): 2,49
* (Label obscured): 2,49
* (Label obscured): 1,29
* (Label obscured): 0,99
...
**Second Row Labels:**
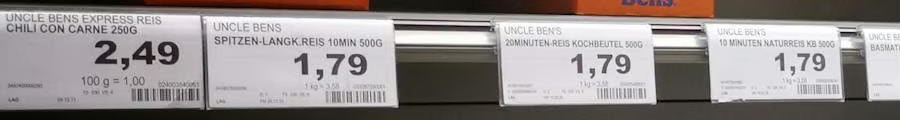
* Uncle Ben's Express Reis Chili con Carne 250g: 2,49
* Uncle Ben's Spitzen-Langkorn Reis 10 Min 500g: 1,79
* (Label obscured): 2,99
* (Label obscured): 2,79
...The sign translation is correct, and the model reads the Uncle Ben's labels it can recognize. But about a third of the entries are "(Label obscured)," and brands like Oryza, Reis-fit, and Reiskugeln don't appear at all.
Now the same prompt with the agentic config:
agentic_response = client.models.generate_content(
	model=MODEL,
	contents=[image_part, prompt],
	config=agentic_config,
)
print_response(agentic_response, show_thoughts=True)
The output structure is different. Instead of a single [ANSWER], it walks through the full Think/Act/Observe loop:
[THINK] Okay, so the primary goal here is twofold: First, I need to
decipher that "Liebe Kunden" sign down there. Then, I need to build a
comprehensive list of what's on this shelf...

[CODE]
import PIL.Image

img = PIL.Image.open('input_file_0.jpeg')
width, height = img.size

crops = [
	{'box_2d': [630, 447, 887, 559], 'label': 'liebe_kunden_sign'},
	{'box_2d': [80, 40, 240, 560], 'label': 'shelf1_left'},
	{'box_2d': [190, 550, 310, 980], 'label': 'shelf1_right'},
	{'box_2d': [400, 0, 480, 450], 'label': 'shelf2_left'},
	{'box_2d': [410, 450, 480, 1000], 'label': 'shelf2_right'},
	{'box_2d': [630, 130, 760, 460], 'label': 'shelf3_left'},
	{'box_2d': [550, 600, 660, 990], 'label': 'shelf3_right'},
]
# ... crops and saves each region

[IMAGE] image/png, 135,953 bytes
[IMAGE] image/png, 90,395 bytes
[IMAGE] image/png, 125,816 bytes
[IMAGE] image/png, 102,288 bytes
[IMAGE] image/png, 173,606 bytes
[IMAGE] image/png, 283,263 bytes
[IMAGE] image/png, 100,522 bytes
The seven crops the model generated:
After observing those crops, the model produces a complete answer:
[ANSWER]
**Top Shelf (Left to Right):**
* Uncle Ben's Express Reis Mexi. Scharf 250g: 1,69 €
* Channa Masala 285g: 2,49 €
* Madras Curry 285g: 2,49 €
* Steam Basmati Reis Kochbeutel 250g: 1,99 €
* Reiskugeln Pur 4x2 St: 1,99 €
...
**Middle Shelf (Left to Right):**
* Uncle Ben's Express Reis Chili con Carne 250g: 2,49 €
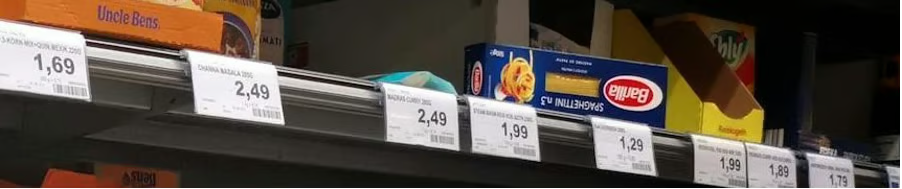
* Oryza Langkorn & Wildreis 500g Kochbeutel: 2,99 €
* Oryza Basmati & Wildreis 500g Kochbeutel: 2,79 €
* Oryza Jasmin Reis 500g Kochbeutel: 2,79 €
...
**Bottom Shelf (Left to Right):**
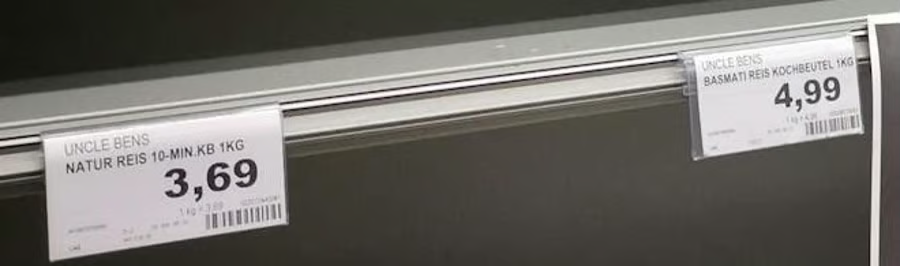
* Uncle Ben's Natur Reis 10-Min. Kochbeutel 1kg: 3,69 €
* Reis-fit 10 Minuten Natur-Reis 500g: 1,89 €
* Reis-fit Langkorn & Wildreis 500g: 1,89 €
...The full untruncated output for both calls is available in this gist.
The agentic response reads 30+ products across all three shelves. The Oryza, Reis-fit, Madras Curry, Reiskugeln, and Steam Basmati items that standard vision labeled "(obscured)" all show up with names and prices.
The difference isn't about hallucination vs. accuracy; standard vision is honest about what it can't read. Agentic vision just refuses to accept that limit and zooms in until it can.
The prompt plays a role here. Asking the model to "list all visible product names and their prices" sets a completeness bar that pushes it toward cropping.
A vaguer prompt like "describe this image" would likely produce a single-pass answer even with code execution on, because the model sees no reason to go further.
This image is a Brazilian bar menu photographed in dim lighting. Three glass panels list drinks in gold text, but pendant lamps block parts of the left panel, the right panel is barely visible at the frame edge, and glass reflections scatter across the surface.

The prompt doesn't mention brightness, cropping, or any specific technique. It just asks for the content:
image_path = Path("images/bar_menu.jpg")
image_part = types.Part.from_bytes(
	data=image_path.read_bytes(), mime_type="image/jpeg"
)

prompt = (
	"Read every drink listed on this menu board, including the ones "
	"partially hidden behind the lamps and on the side panels. For "
	"each drink, give me the name and beer style."
)
Standard vision reads the well-lit center panel without trouble, pulling eight beers from the "FRUTADAS" section and four from "CHOPP." But the left panel comes back like this:
[ANSWER]
### Left Panel (Partially visible)
*   **[Unreadable] LAGER** | [Style unreadable]
*   **RED LAGER** | [Style unreadable]
*   **[Unreadable] LAGER** | [Style unreadable]
*   **[Unreadable]GER** | [Style unreadable]
*   **HONKERS ALE** | [Style unreadable]
*   **[Unreadable]SELLE** | [Style unreadable]
Six entries, most with unreadable names and all with missing styles. The model sees there's text there but can't make it out.
The agentic call runs two code rounds. First, it crops all three panels:
[CODE]
middle_panel = [200, 320, 950, 780]
left_panel = [200, 0, 950, 260]
right_panel = [200, 840, 700, 1000]
# ... crops and saves each region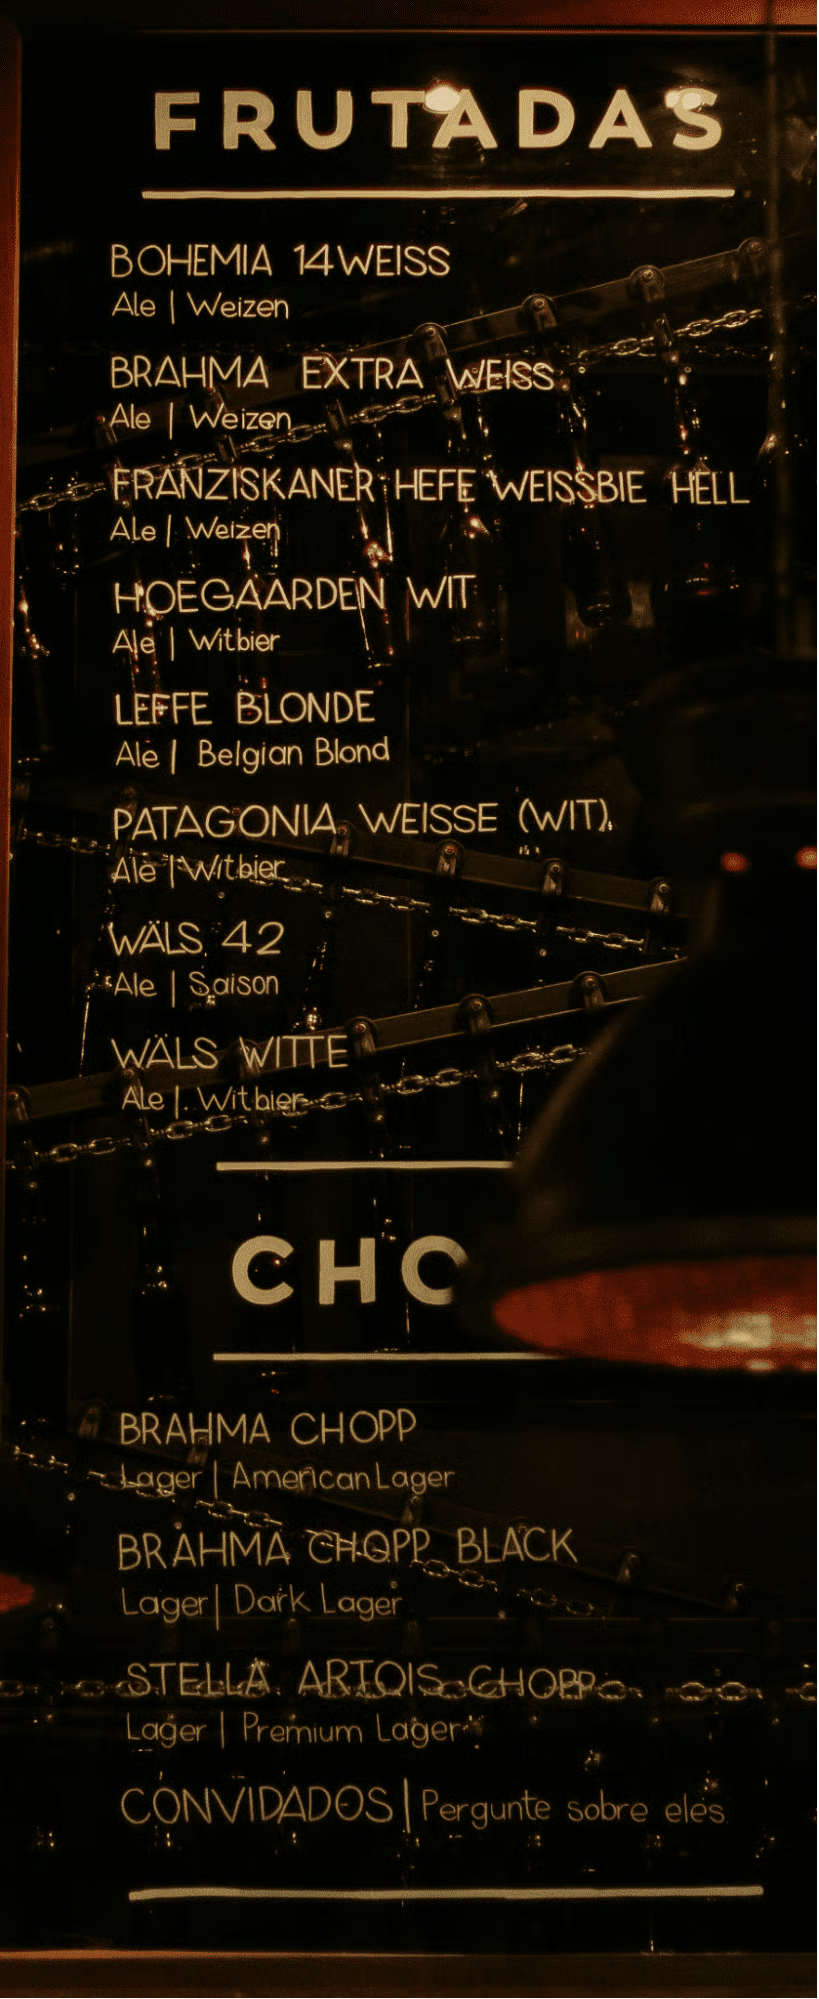
After observing those crops, the model decides the left and right panels need more zoom. It runs a second round:
[CODE]
left_panel_top = [100, 0, 500, 250]
left_panel_bottom = [500, 0, 980, 250]
right_panel_top = [100, 800, 600, 1000]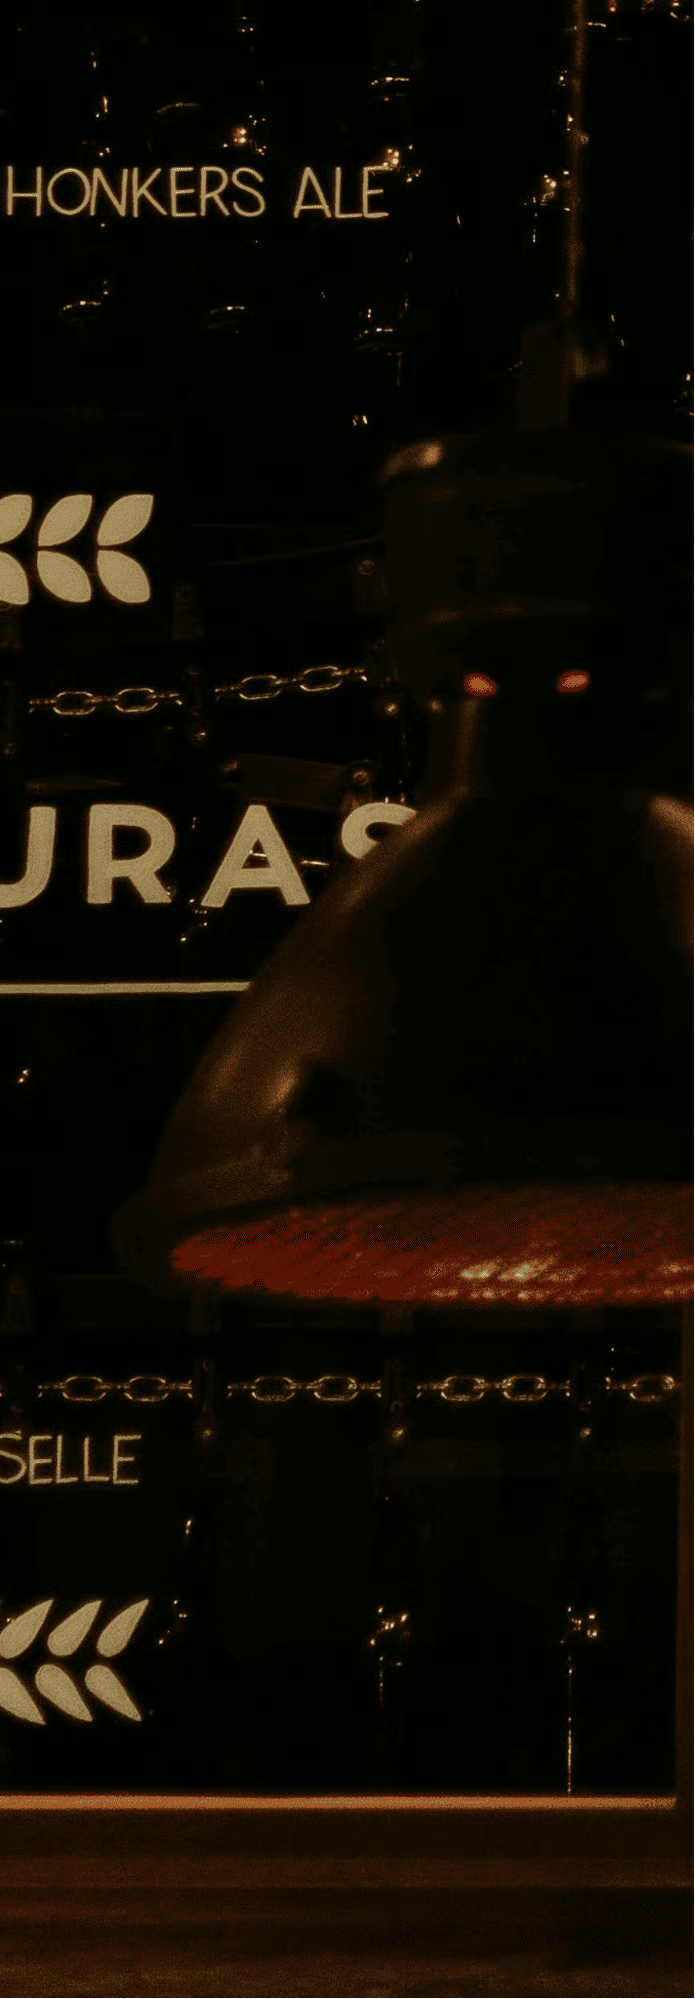
With that extra zoom, the model recovers names that standard vision labeled unreadable: Amber Lager, Honkers Ale (Goose Island), and Demoiselle (Colorado) from the left panel, plus Wals Dubbel, Tripel, Quadrupel, and Petroleum from the right. It also identifies the left panel heading as "MISTURAS" and the right panel heading as "ALCOÓLICAS."
The prompt never said "crop the panels" or "zoom into the dark areas." It asked for the drinks and their styles, and the model worked backward from that goal.
What makes this example different from the grocery shelf is the second pass. After the first round of crops, the model looked at what it had, decided the left and right panels were still too hard to read, and ran another round of tighter zooms without being told to.
The loop self-corrected.
That's the payoff of leaving the method open: the model doesn't just preprocess once, it iterates until the results meet the bar set by the prompt.
The bar menu worked because the prompt left the method open, and the model figured out what to do. That doesn't always hold. Sometimes the model needs explicit instructions about which tool to use, and this next example shows where that line is.
The image below has coins scattered across a desk and a black folder. Some overlap, a few are partially hidden, and the mix of copper and silver makes it easy to lose track.

A reasonable first approach is to ask the model to annotate each coin so it can count from its own markings. Google's docs confirm that agentic vision can draw bounding boxes and labels directly onto images using PIL and OpenCV in the sandbox. So:
image_path = Path("images/coins.jpg")
image_part = types.Part.from_bytes(
	data=image_path.read_bytes(), mime_type="image/jpeg"
)

prompt_v1 = (
	"Count every coin in this image. Draw a bounding box or circle "
	"around each one and number them. Check for overlapping or "
	"partially hidden coins. Give me the final count."
)

response_v1 = client.models.generate_content(
	model=MODEL,
	contents=[image_part, prompt_v1],
	config=agentic_config,
)
print_response(response_v1, show_thoughts=True)
The model crops five regions, analyzes each one, and returns a count of 34. But look at the answer format:
[ANSWER] Final Count: 34 coins in total.

[
  {"box_2d": [387, 175, 451, 236], "label": "1"},
  {"box_2d": [356, 196, 407, 248], "label": "2"},
  {"box_2d": [319, 231, 375, 274], "label": "3"},
  ...
]
It returned bounding box coordinates as JSON instead of drawing anything on the image. The prompt said "draw," but the model treated that as a description task and gave structured text output.
The code execution docs hint at why: "While the model automatically handles zooming for small details, you should prompt it explicitly to use code for other tasks." The word "draw" is ambiguous enough that the model chose the text-only path.
Describing the task in terms of the code you want it to run removes that ambiguity:
prompt_v2 = (
	"Count every coin in this image. Use Python to draw a numbered "
	"bounding box on the image around each coin you find. Check for "
	"overlapping or partially hidden coins. After annotating, give "
	"me the final count."
)

response_v2 = client.models.generate_content(
	model=MODEL,
	contents=[image_part, prompt_v2],
	config=agentic_config,
)
print_response(response_v2, show_thoughts=True)
This time, the model writes actual drawing code:
[CODE]
import PIL.Image
import PIL.ImageDraw

img = PIL.Image.open('input_file_0.jpeg')
width, height = img.size

coins = [
	[383, 175, 452, 227], [352, 196, 411, 255], ...  # 34 total
]

draw = PIL.ImageDraw.Draw(img)
for i, coin in enumerate(coins):
	ymin, xmin, ymax, xmax = coin
	left, top, right, bottom = (xmin*width/1000, ymin*height/1000,
                                 xmax*width/1000, ymax*height/1000)
	draw.rectangle([left, top, right, bottom], outline='red', width=3)
	draw.text((left, top), str(i + 1), fill='red')

[RESULT] (Outcome.OUTCOME_OK)
Total coins detected: 34

[IMAGE] image/png, 3,685,043 bytes

[ANSWER] I have identified and counted a total of 34 coins.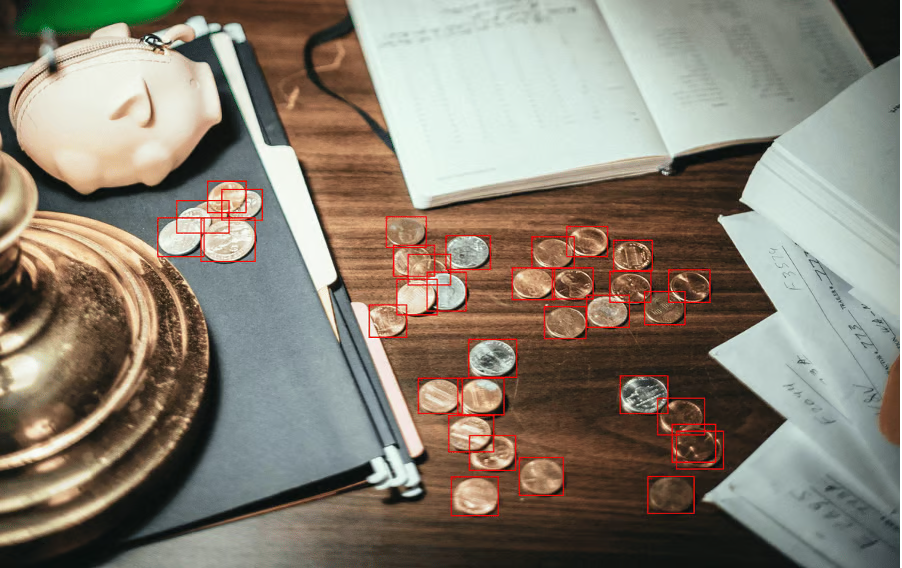
Every coin gets a red box and a number. The actual count is 35 or 36, depending on how you judge two coins that overlap near the bottom of the frame.
The model landed on 34, missing one or two in that cluster. But the annotation acts as a visual scratchpad: instead of a number you have to take on faith, you get a verifiable artifact you can check box by box.
The full untruncated output for both calls is available in this gist.
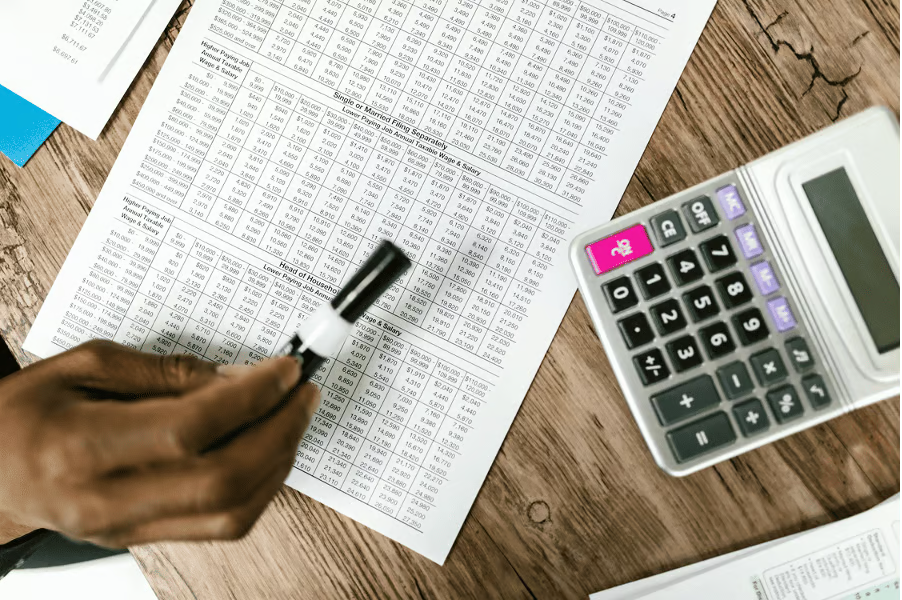
The previous examples involved one main task each (read text, count objects). This one chains several together: crop a table from a photo, extract the numbers into a DataFrame, and generate a chart. The image is an IRS-style tax table photographed on a desk with a calculator.
The prompt spells out the full pipeline in one go:
image_path = Path("images/data_table.jpg")
image_part = types.Part.from_bytes(
data=image_path.read_bytes(), mime_type="image/jpeg"
)
prompt = (
"Crop and zoom into the table in this image. Extract the first "
"10 rows of data into a structured format. Identify the column "
"headers. Then create a bar chart comparing the values in the "
"numeric columns for those 10 rows. Summarize which row has the "
"highest and lowest values."
)
response = client.models.generate_content(
model=MODEL,
contents=[image_part, prompt],
config=agentic_config,
)
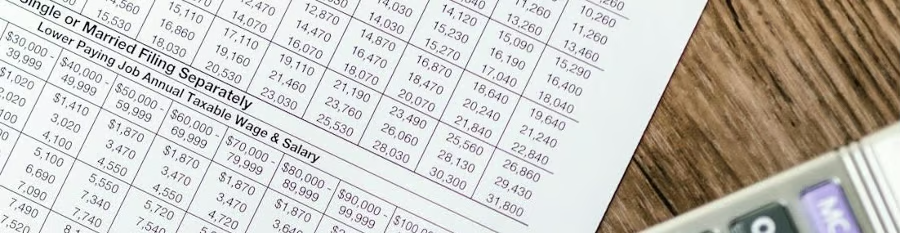
print_response(response, show_thoughts=True)The model takes four code rounds to get from the full photo to a finished chart. The first three are progressive zooms: it crops the "Single or Married Filing Separately" table, then the column headers, then the first 10 rows of data, generating five intermediate images along the way. Here's the first crop where it isolates the table:
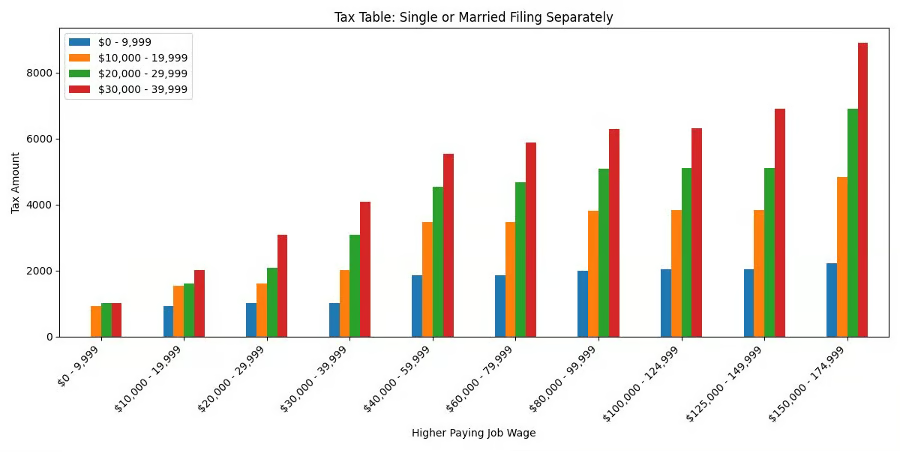
By round four, it has read enough detail to extract the numbers. It builds a pandas DataFrame, prints the table, and generates a grouped bar chart in a single code block:
[CODE]
import matplotlib.pyplot as plt
import pandas as pd

data = [
	{"Higher Paying Job Wage": "$0 - 9,999",
 	"$0 - 9,999": 0, "$10,000 - 19,999": 940,
 	"$20,000 - 29,999": 1020, "$30,000 - 39,999": 1020},
	...  # 10 rows total
]

df = pd.DataFrame(data)
df.set_index("Higher Paying Job Wage").plot(kind='bar', figsize=(12, 6))
plt.title('Tax Table: Single or Married Filing Separately')
plt.ylabel('Tax Amount')
plt.savefig('tax_bar_chart.png')
The extracted table:
|
Higher Paying Job Wage |
$0 - 9,999 |
$10,000 - 19,999 |
$20,000 - 29,999 |
$30,000 - 39,999 |
|
$0 - 9,999 |
$0 |
$940 |
$1,020 |
$1,020 |
|
$10,000 - 19,999 |
$940 |
$1,540 |
$1,620 |
$2,020 |
|
$20,000 - 29,999 |
$1,020 |
$1,620 |
$2,100 |
$3,100 |
|
$30,000 - 39,999 |
$1,020 |
$2,020 |
$3,100 |
$4,100 |
|
$40,000 - 59,999 |
$1,870 |
$3,470 |
$4,550 |
$5,550 |
|
$60,000 - 79,999 |
$1,870 |
$3,470 |
$4,690 |
$5,890 |
|
$80,000 - 99,999 |
$2,000 |
$3,810 |
$5,090 |
$6,290 |
|
$100,000 - 124,999 |
$2,040 |
$3,840 |
$5,120 |
$6,320 |
|
$125,000 - 149,999 |
$2,040 |
$3,840 |
$5,120 |
$6,910 |
|
$150,000 - 174,999 |
$2,220 |
$4,830 |
$6,910 |
$8,910 |
And the generated bar chart:
The full untruncated output is available in this gist.
One API call produced a structured DataFrame, a summary with max/min rows identified, and a publication-ready bar chart. The prompt listed four things (crop, extract, chart, summarize), and the model treated each as a stage in a pipeline where the output of one step fed into the next.
Earlier examples used the loop to refine a single operation (better crops, better annotations). This one shows the loop chaining different operations together, each building on what the previous round produced.
Agentic vision turns a single API call into a feedback loop where the model writes code, looks at what it produced, and decides what to do next.
The grocery shelf example showed the basic pattern: crop regions that are too small to read, then answers from the enlarged versions. The bar menu added a second dimension, where the model ran one round of crops, decided they weren't enough, and zoomed further into the problem areas on its own.
For the coins, annotation turned a guess into a checkable artifact. The tax table chained four distinct operations (crop, extract, compute, plot) inside a single request.
Each example also revealed something about prompting. Setting a completeness bar ("list all products") pushed the model toward thoroughness. Leaving the method open let it choose its own preprocessing path.
But ambiguous verbs like "draw" sometimes sent it down the wrong track, and switching to "Use Python to draw" fixed that.
The pattern: describe what you want produced, be specific about the tool when the task is ambiguous, and let the loop handle the rest.
All code from this tutorial runs with gemini-3-flash-preview and the google-genai SDK. If you want to go deeper, DataCamp's Introduction to AI Agents course covers the loop pattern behind all of this.
Top DataCamp Courses
Programma
Corso
Corso
Tutorial
Abid Ali Awan
Tutorial
François Aubry
Tutorial
François Aubry
Tutorial
François Aubry
Tutorial
Aashi Dutt
Tutorial
Abid Ali Awan