Curso
Como cientistas de dados, é fundamental entender a variabilidade de nossos dados. O coeficiente de variação (CV) é uma métrica útil que expressa essa variabilidade como uma proporção da média, permitindo comparações entre conjuntos de dados com unidades diferentes.
Neste tutorial, aprenderemos sobre o coeficiente de variação como um conceito estatístico e como encontrar o coeficiente de variação no Excel.
Se você está procurando uma introdução abrangente ao Excel, confira este curso de habilidades de cinco cursos do Excel Fundamentals.
Primeiro, vamos dar uma olhada em uma resposta bem curta e depois acrescentar mais detalhes.
Resposta curta: Como calcular o coeficiente de variação no Excel
Aqui está o processo passo a passo para você encontrar o coeficiente de variação no Excel:
- Calcule o desvio padrão: Em uma célula vazia, inserimos a fórmula
=STDEV.P(A1:A10), substituindoA1:A10pelo intervalo real dos nossos dados. - Calcule a média: Em outra célula vazia, inserimos a fórmula
=AVERAGE(A1:A10)usando o mesmo intervalo de dados. - Calcule o coeficiente de variação: Em uma célula final, inserimos a fórmula
=STDEV.P(A1:A10)/AVERAGE(A1:A10). Isso divide o desvio padrão pela média.
O que é o coeficiente de variação?
O coeficiente de variação (CV) é uma medida estatística que quantifica a variabilidade relativa de um conjunto de dados em relação à sua média.
Normalmente, expressamos esse valor como uma porcentagem e o calculamos dividindo o desvio padrão do conjunto de dados pela média e, em seguida, multiplicando o resultado por 100.
A fórmula para calcular o coeficiente de variação é a seguinte:

O CV nos permite comparar a variabilidade de dois ou mais conjuntos de dados que podem ter unidades diferentes ou médias diferentes, fornecendo uma medida padronizada de dispersão.
Um CV mais baixo indica que os pontos de dados estão agrupados mais próximos da média, refletindo uma menor variabilidade. Por outro lado, um CV mais alto sugere uma dispersão mais ampla dos pontos de dados em torno da média.
A força do CV está na comparação da variabilidade entre conjuntos de dados com unidades diferentes. Isso o torna particularmente útil em áreas como finanças, onde ele pode avaliar a relação risco-recompensa de diferentes carteiras de investimento.
Da mesma forma, no controle de qualidade, o CV pode ajudar a comparar a consistência dos processos de produção que usam diferentes escalas de medição.
Vamos dar uma olhada mais profunda nos aplicativos do mundo real.
Aplicações do coeficiente de variação
Em finanças e avaliação de risco, os investidores usam o CV para identificar ativos que oferecem retornos mais altos em relação ao seu risco inerente. Isso permite que eles criem portfólios diversificados e gerenciem os riscos de forma eficaz. Esse aplicativo é especialmente útil em mercados em que os retornos absolutos podem ser enganosos devido aos níveis variáveis de volatilidade.
O CV também desempenha um papel importante no controle de qualidade da fabricação. Isso ajuda a garantir a qualidade consistente do produto em diferentes lotes de produção. Um CV mais baixo indica menos variação nas características do produto, o que é fundamental para manter os padrões da marca e a satisfação do cliente.
Setores como o farmacêutico e o automotivo, em que a confiabilidade do produto é fundamental, dependem muito do CV para avaliar e controlar os processos de produção.
Pesquisadores e meteorologistas o utilizam para analisar a consistência dos padrões climáticos, como variações de precipitação em diferentes regiões ou períodos de tempo. Essa análise ajuda a melhorar a precisão das previsões meteorológicas e no planejamento de atividades agrícolas que dependem muito das condições meteorológicas.
Lembre-se de que o CV é uma medida relativa de dispersão. Seu ponto forte está na comparação da variabilidade entre vários conjuntos de dados ou variáveis. É menos informativo quando usado para descrever a variabilidade de um único conjunto de dados isoladamente. As aplicações do CV vão além desses exemplos, tornando-o uma ferramenta valiosa em muitos setores.
Agora, vamos aprender a calcular o coeficiente de variação no Excel usando um exemplo.
Como encontrar o coeficiente de variação no Excel
Diferentemente de outros cálculos no Excel, não temos uma função de uma linha para calcular o CV. No entanto, o processo ainda é simples, como veremos em breve.
Imagine que você é um analista de dados financeiros encarregado de avaliar carteiras de investimentos para a equipe de gestão de ativos de uma empresa. Para orientar suas decisões estratégicas, você precisa avaliar o risco associado a cada portfólio. O currículo é útil aqui.
Ao comparar o desvio padrão dos retornos de cada portfólio com o retorno médio, você pode determinar seus perfis de risco-retorno. Essa medida pode mostrar quais carteiras oferecem retornos mais altos em relação ao nível de risco envolvido.
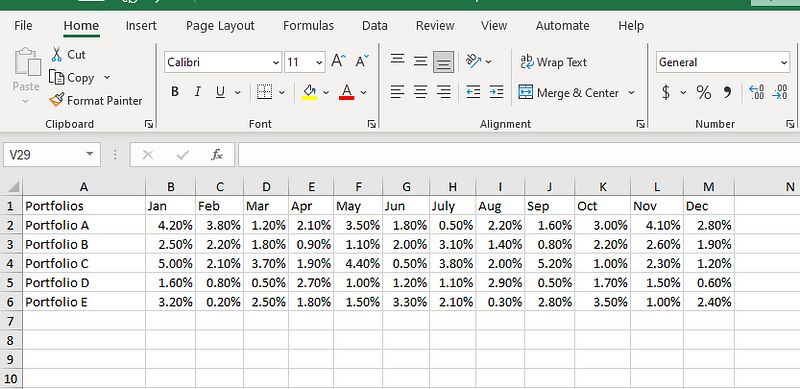
Para calcular o coeficiente de variação de cada carteira, vamos começar tabulando os retornos de cada carteira para cada mês do ano:

Dados de retorno de portfólio.
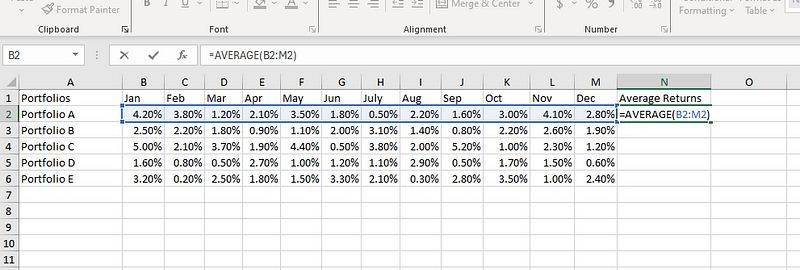
Calcularemos a média de cada portfólio (lembre-se de que a fórmula do CV exige que você saiba a média). Vamos digitar a fórmula abaixo na célula N2:
=AVERAGE(B2:M2)
Calculando a média no Excel.
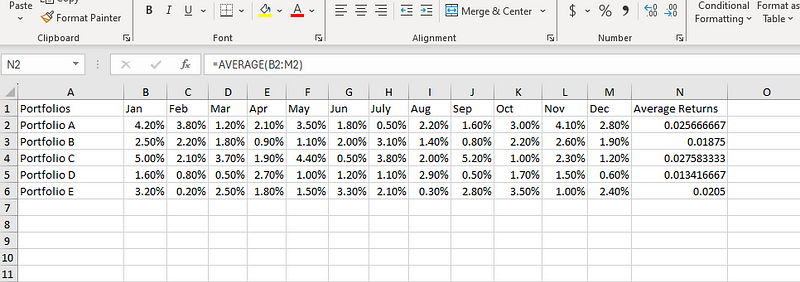
Agora, arrastamos a alça de preenchimento (o pequeno quadrado no canto inferior direito de N2) para estender a fórmula aos outros portfólios.

Estendendo a média calculada para outros portfólios.
Temos a média, mas precisamos de outro elemento para nossa fórmula de CV: o desvio padrão. Vamos selecionar O2 e usar a seguinte fórmula para calcular o desvio padrão:
=STDEV.P(B2:M2)
Cálculo do desvio padrão no Excel.
Agora, arrastamos a alça de preenchimento para estender a fórmula aos outros portfólios. Como observação lateral, usamos STDEV.P() em vez de STDEV.S() porque, em nosso exemplo, estamos assumindo que nosso conjunto de dados é uma população em vez de uma amostra.
Agora que temos a média e o desvio padrão, podemos calcular o CV. Vamos dividir o desvio padrão pela média em P2:
=N2/O2
Calculando o coeficiente de variação no Excel.
Como antes, arrastamos a alça de preenchimento para estender a fórmula às carteiras restantes.
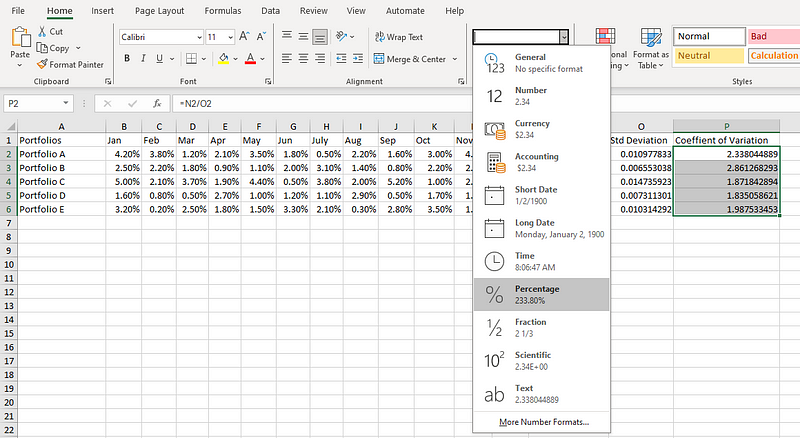
Como o CV é normalmente expresso como uma porcentagem, selecionamos P2 para P6 e alteramos a formatação do número para Porcentagem, conforme mostrado no diagrama abaixo.

Transformando os valores em porcentagens.
E é isso, todos os nossos valores de CV estão na coluna P!

Dados finais com todos os cálculos.
Aprenda os fundamentos do Excel
Interpretação do coeficiente de variação
Um CV mais baixo indica que o portfólio tem um risco menor por unidade de retorno, sugerindo um desempenho mais estável ou consistente em relação ao seu retorno médio. Um CV mais alto sugere maior risco por unidade de retorno, o que implica que os retornos são voláteis ou inconsistentes em relação aos retornos médios indicados.
Com base nos resultados acima, poderíamos incluir as seguintes conclusões em nosso relatório:
- O portfólio D oferece o menor retorno e também tem o menor CV, o que o torna potencialmente adequado para investidores avessos ao risco que priorizam a estabilidade em vez de altos retornos.
- O portfólio B, apesar de ter um retorno médio moderado, tem a maior variabilidade (CV mais alto), o que pode ser adequado apenas para investidores tolerantes ao risco que podem lidar com flutuações significativas de retorno.
- A Carteira C pode ser a opção mais equilibrada para muitos investidores, graças à sua combinação de maior retorno e volatilidade relativamente baixa. Ele oferece um bom equilíbrio entre risco e recompensa.
Coeficiente de variação: Considerações práticas
Agora que sabemos o que é o CV e como calculá-lo no Excel, vamos dar uma olhada em alguns aspectos práticos.
O coeficiente de variação com médias zero ou próximas de zero
Ao interpretar o CV, precisamos estar atentos às médias zero ou quase zero. Isso pode acontecer se todos os nossos pontos de dados forem zero ou se os valores positivos e negativos se equilibrarem perfeitamente. Nesses casos, o cálculo do CV tenta dividir por zero, levando a resultados sem sentido.
Da mesma forma, uma média muito pequena pode nos induzir ao erro. O CV pode ser extremamente alto, sugerindo alta variabilidade, mesmo que a dispersão real em nossos dados seja mínima. Imagine analisar os retornos de investimento com alguns valores ligeiramente positivos e outros ligeiramente negativos, o que leva a uma média próxima de zero. O CV pode exagerar o risco percebido.
Para médias zero ou quase zero, precisamos considerar medidas alternativas como intervalo, intervalo interquartil ou apenas o desvio padrão. Se você quiser saber mais sobre medidas de variabilidade, confira este curso de Introdução à Estatística.
O coeficiente de variação e a distribuição de dados
O CV funciona melhor quando os dados são normalmente distribuídos ou, pelo menos, simétricos. Se nossos dados forem distorcidos ou tiverem valores discrepantes, a média e o desvio padrão podem ser distorcidos, levando a um CV impreciso.
É útil explorar nossos dados usando estatísticas descritivas ou visualizações antes de usar o CV. Isso nos ajudará a entender a distribuição e a identificar qualquer assimetria ou valores discrepantes que possam afetar a confiabilidade do CV.
Se você quiser usar o Excel para visualizar dados, confira este curso sobre visualização de dados no Excel.
O coeficiente de variação com escalas de proporção e intervalo
O CV é mais útil para dados de escala de proporção com um ponto zero que realmente representa uma ausência de quantidade (por exemplo, alturas, pesos ou preços). Nesses casos, um valor zero significa realmente zero - um peso de zero significa que não há peso presente.
Entretanto, a aplicação do CV a dados de intervalo, como temperaturas ou datas, pode ser enganosa. Seu ponto zero não significa necessariamente a ausência da quantidade. Por exemplo, zero graus Celsius não significa que não há calor presente.
No entanto, se realizarmos transformações nos dados de temperatura, como a medição de anomalias de temperatura, em que zero significa inexistência, isso se tornará um caso de uso adequado.
A conclusão é que, antes de usar o CV, precisamos considerar se nosso tipo de dados está alinhado com as suposições do cálculo do CV para garantir resultados confiáveis.
Conclusão
O coeficiente de variação (CV) é uma ferramenta valiosa para os cientistas de dados, pois nos oferece uma maneira padronizada de comparar a variabilidade dos conjuntos de dados, mesmo quando eles usam unidades diferentes. Como vimos, ele tem aplicações em diversos campos, como finanças, manufatura e análise meteorológica.
O cálculo do CV no Excel é um processo simples. Ao aproveitar as funções integradas para o desvio padrão e a média, podemos calcular facilmente o CV.
Se você deseja aprimorar suas habilidades de análise de dados no Excel, considere este curso sobre Análise de dados no Excel.
Avance em sua carreira com o Excel
Adquira as habilidades para maximizar o Excel - não é necessário ter experiência.

Como cientista de dados sênior, eu projeto, desenvolvo e implanto soluções de aprendizado de máquina em larga escala para ajudar as empresas a tomar melhores decisões baseadas em dados. Como redator de ciência de dados, compartilho aprendizados, conselhos de carreira e tutoriais práticos e detalhados.