Course
Data Preparation in Excel
3 hr
85.3K
As data scientists, it’s crucial to understand the variability of our data. The coefficient of variation (CV) is a useful metric that expresses this variability as a proportion of the mean, allowing for comparisons across datasets with different units.
In this tutorial, we’ll learn about the coefficient of variation as a statistical concept and how to find the coefficient of variation in Excel.
If you’re looking for a comprehensive introduction to Excel, check out this five-course Excel Fundamentals skill track.
Let's first look at a very short answer and then add more details.
Here's the step-by-step process to find the coefficient of variation in Excel:
=STDEV.P(A1:A10), replacing A1:A10 with the actual range of our data.=AVERAGE(A1:A10) using the same data range.=STDEV.P(A1:A10)/AVERAGE(A1:A10). This divides the standard deviation by the mean.The coefficient of variation (CV) is a statistical measure that quantifies the relative variability of a dataset relative to its mean.
We typically express it as a percentage and calculate it by dividing the dataset's standard deviation by the mean and then multiplying the result by 100.
The formula to calculate the coefficient of variation is:
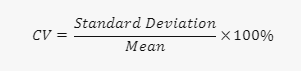
The CV allows us to compare the variability of two or more datasets that may have different units or different means, providing a standardized measure of dispersion.
A lower CV indicates that the data points are clustered closer to the mean, reflecting lower variability. Conversely, a higher CV suggests a wider spread of data points around the mean.
The CV's strength lies in comparing variability across datasets with different units. This makes it particularly useful in areas like finance, where it can assess the risk-to-reward ratio of different investment portfolios.
Similarly, in quality control, the CV can help compare the consistency of production processes that use different measurement scales.
Let’s take a deeper look at real-world applications.
In finance and risk assessment, investors use CV to identify assets that offer higher returns relative to their inherent risk. This allows them to build diversified portfolios and manage risk effectively. This application is especially useful in markets where the absolute returns might be misleading due to varying volatility levels.
The CV also plays a significant role in quality control in manufacturing. It helps ensure consistent product quality across different production batches. A lower CV indicates less variation in product characteristics, which is crucial for maintaining brand standards and customer satisfaction.
Industries like pharmaceuticals and automotive manufacturing, where product reliability is paramount, rely heavily on CV to assess and control production processes.
Researchers and meteorologists use it to analyze the consistency of weather patterns, such as rainfall variations across different regions or time periods. This analysis helps improve the accuracy of weather forecasts and in planning agricultural activities that are heavily dependent on weather conditions.
Remember, the CV is a relative measure of dispersion. Its strength lies in comparing variability across multiple datasets or variables. It's less informative when used to describe the variability of a single dataset in isolation. The CV's applications extend beyond these examples, making it a valuable tool in many industries.
Now, let’s learn how to calculate the coefficient of variation in Excel using an example.
Unlike other calculations in Excel, we don’t have a one-line function to calculate the CV. However, the process is still straightforward as we’ll see shortly.
Imagine you're a financial data analyst tasked with evaluating investment portfolios for a firm's asset management team. To guide their strategic decisions, you need to assess the risk associated with each portfolio. The CV comes in handy here.
By comparing each portfolio's standard deviation of returns to the mean return, you can determine their risk-return profiles. This measure can show which portfolios offer higher returns relative to the level of risk involved.
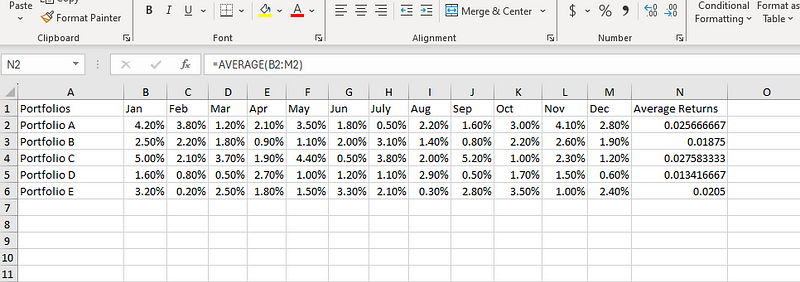
To calculate each portfolio’s coefficient of variation, let’s start by tabulating the returns of each portfolio for every month of the year:
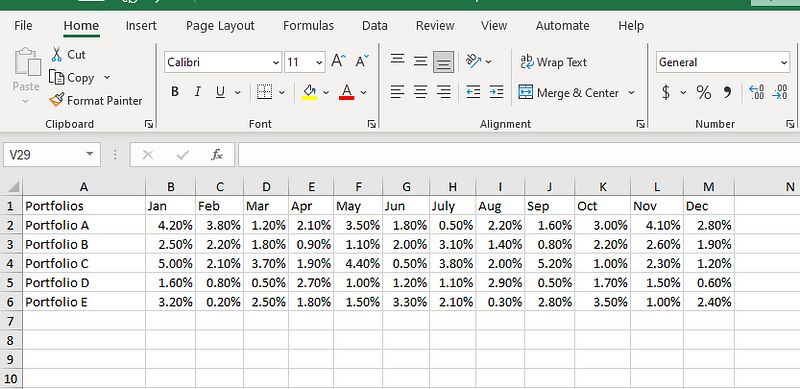
Portfolio returns data.
We’ll calculate the mean for each portfolio (remember that the formula of CV requires us to know the mean). Let’s type the formula below in the cell N2:
=AVERAGE(B2:M2)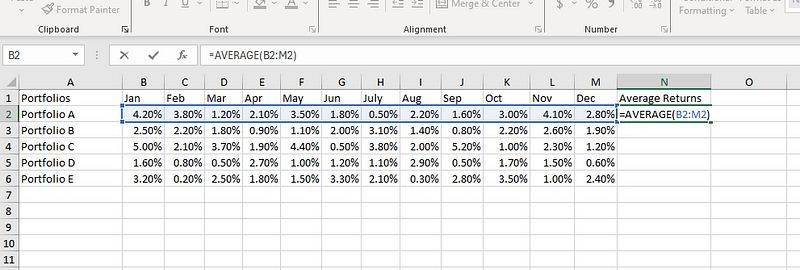
Calculating the mean in Excel.
Now, we drag the fill handle (the small square at the bottom right corner of N2) to extend the formula to the other portfolios.
Extending the calculated mean to other portfolios.
We have the mean, but we need another element for our CV formula: the standard deviation. Let’s select O2 and use the following formula to calculate the standard deviation:
=STDEV.P(B2:M2)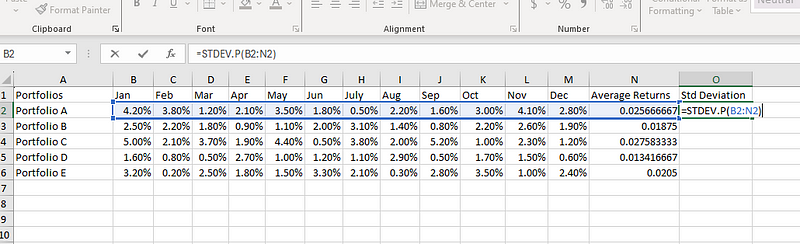
Calculating standard deviation in Excel.
We now drag the fill handle to extend the formula to the other portfolios. As a sidenote, we used STDEV.P() instead of STDEV.S() because in our example we’re assuming our dataset is a population instead of a sample.
Now that we have both the mean and the standard deviation, we can calculate the CV. Let’s divide the standard deviation by the mean in P2:
=N2/O2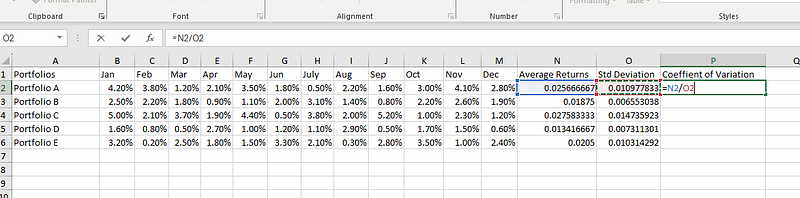
Calculating the coefficient of variation in Excel.
As before, we drag the fill handle to extend the formula to the remaining portfolios.
Since the CV is typically expressed as a percentage, we select P2 to P6, and change the number formatting to Percentage as shown in the diagram below.
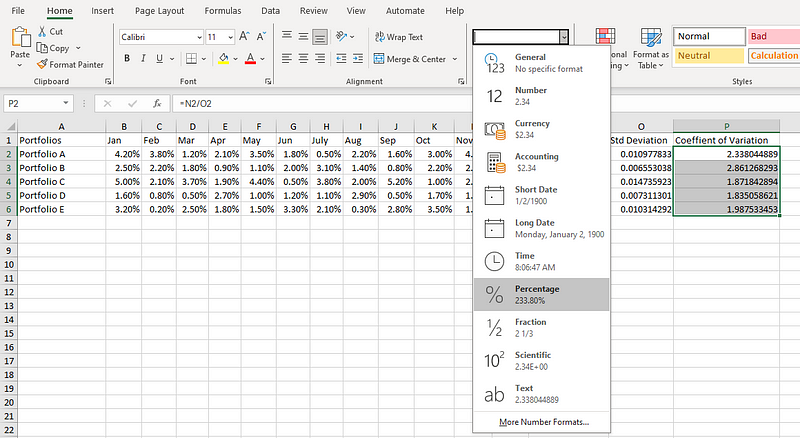
Transforming the values into percentages.
And that’s it, all our CV values are in the P column!
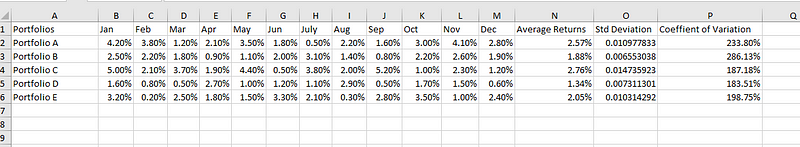
Final data with all calculations.
Gain the skills to maximize Excel—no experience required.
Become a data analyst in Excel!
Course
Course
Course
Tutorial
Arunn Thevapalan
Tutorial
Arunn Thevapalan
Tutorial
Arunn Thevapalan
Tutorial
Allan Ouko
Tutorial
Arunn Thevapalan
Tutorial
Jachimma Christian