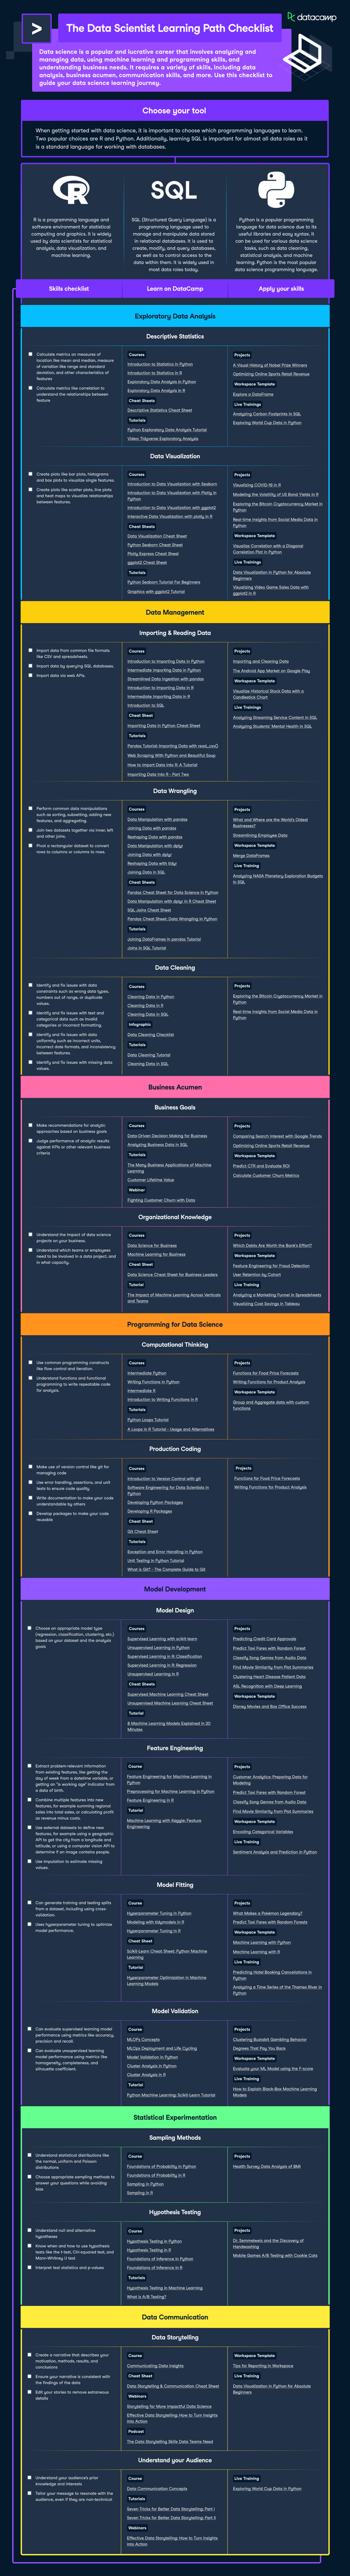
Why is data science so important for organizations? It allows us to draw meaningful conclusions from all the data around us.
As you may know, we recently launched a non-coding course to help business leaders make sense of how data science can best position their organizations for success. This course touches on a wide range of topics: the skills necessary for data teams, the different types of data sources and storage options, the best way to visualize data through dashboards, special topics in machine learning, and more.
To supplement the course, we’ve also created a cheat sheet for business leaders to use as a reference on the hot topics in data science they need to know, including building your data science team and the common steps in the data science workflow.
Click the image below to download the cheat sheet.
Have this cheat sheet at your fingertips
Download PDFTo learn how DataCamp can help your team become proficient in data science and analytics, schedule a demo of our platform.

Data Science Basics
Types of Data Science
- Descriptive Analytics (Business Intelligence): Get useful data in front of the right people in the form of dashboards, reports, and emails
- Which customers have churned?
- Which homes have sold in a given location, and do homes of a certain size sell more quickly?
- Predictive Analytics (Machine Learning): Put data science models continuously into production
- Which customers may churn?
- How much will a home sell for, given its location and number of rooms?
- Prescriptive Analytics (Decision Science): Use data to help a company make decisions
- What should we do about the particular types of customers that are prone to churn?
- How should we market a home to sell quickly, given its location and number of rooms?
The Standard Data Science Workflow
- Data Collection: Compile data from different sources and store it for efficient access
- Exploration and Visualization: Explore and visualize data through dashboards
- Experimentation and Prediction: The buzziest topic in data science—machine learning!
Building a Data Science Team
Your data team members require different skills for different purposes.
| Data Engineer | Data Analyst | Machine Learning Engineer | Data Scientist |
| Store and maintain data | Visualize and describe data | Write production-level code to predict with data | Build custom models to drive business decisions |
| SQL/Java/Scala/Python | SQL + BI Tools + Spreadsheets | Python/Java/R | Python/R/SQL. |
Data Science Team Organizational Models
| Centralized/Isolated | Embedded | Hybrid |
| The data team is the owner of data and answers requests from other teams |
Data experts are dispersed across an organization and report to functional leaders |
Data experts sit with functional eams and also report to the Chief Data Scientist—so data is an organizational priority |
Exploration and Visualization
The type of dashboard you should use depends on what you’ll be using it for.
Common Dashboard Elements
Type: Time Series
What is it best for?: Tracking a value over time
Example:
Type: Stacked bar chart
What is it best for?: Tracking composition over time
Example:
Type: Bar chart
What is it best for?: Categorical comparison
Example:
Popular Dashboard Tools
Spreadsheets
![]() Excel
Excel ![]() Sheets
Sheets
BI Tools
![]() Power BI
Power BI
![]() Tableau
Tableau
 Looker
Customized Tools
![]() R Shiny
R Shiny
![]() d3.js
d3.js
When You Should Request a Dashboard
 When you'll use it multiple times
 When you'll need the information updated regularly
 When the request will always be the same
Experimentation and Prediction
Machine Learning
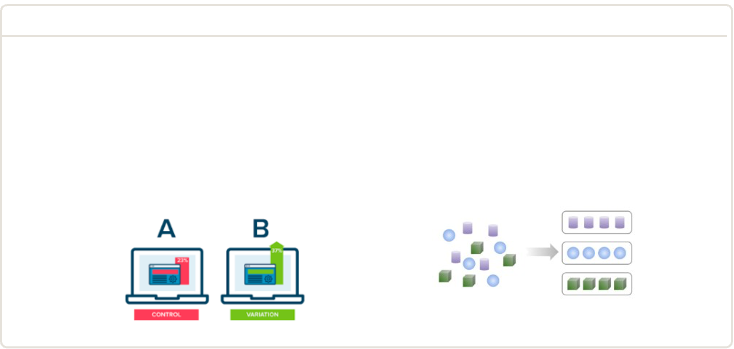
Machine learning is an application of artificial intelligence (AI) that builds algorithms and statistical models to train data to address specific questions without explicit instructions.
| Supervised Machine Learning | Unsupervised Machine Learning | |
| Purpose |
Makes predictions from data with labels and features |
Makes predictions by lustering data with no labels into categories |
| Example |
Recommendation systems, email subject optimization, churn rediction |
Image segmentation, customer segmentation |
Special Topics in Machine Learning
Time Series Forecasting is a technique for predicting events through a equence of time and can capture seasonality or periodic events.
Natural Language Processing (NLP) allows computers to process and analyze arge amounts of natural language data.
- Text as input data
- Word counts track the important words in a text
- Word embeddings create features that group similar words
|
Deep Learning / Neural Networks enables unsupervised machine learning using data that is unstructured or unlabeled. |
Explainable AI is an emerging field in machine learning that applies AI such that results can be easily understood. |
| Highly accurate predictions | Understandable by humans |
| Better for "What?" | Better for "Why?" |