
Track
Data Scientist in Python
26 hr
Regardless of whether you are a student, an aspiring data scientist, or a professional looking for a career switch, if you want to become an experienced data scientist, you have to follow a path. This isn’t always easy, as the data science landscape has become quite broad and as a result, there are different types of data science professionals with different activities and skill sets.
To approximate a data science pathway, this article provides an overview of the data science landscape so that you can see which roles match your ambitions. In addition, it provides pointers on how to move into or grow towards different roles within that landscape, answering questions such as: What skills should you develop and what methods should you familiarize yourself with?
Let’s get started with our data science roadmap.
In this article, we dive deep into all aspects of the roadmap. However, if you're looking for a quick summary of the outline, you can find it below:
By following this roadmap, you can effectively navigate the data science landscape, build essential skills, and pursue a rewarding career in the field.
In order to understand the context of a data science roadmap, it is crucial to have an idea of what Data Science is. We’ve got a full guide covering data science definitions and explanations, but for the sake of this article, we will consider data science as the set of activities aimed at resolving problems by using data.
A problem experienced very often is “I have a question, but do not know the answer”, so if you run an SQL query on a sales database to figure out how much revenue an organization made last month, you’re a data scientist!
Often, the problems/solutions are more complex and require a more diverse set of skills. To be able to discuss this wide range of data science roles and skills throughout this data science roadmap, we will use a data science project lifecycle as a portmanteau. This will allow us to map the different activities and roles and will serve as a basis to lay out the lands of data science.
Data science projects mostly start with a business question or problem. A problem triggers an initiation phase, in which a set of possible solutions is defined, and initial feasibility is assessed. Initial data collection or an exploratory data analysis of available data is done to see what is possible and what isn’t. Is the data rich enough? Does it contain enough features?
Once all lights are green, we start developing a predictive model. The model will use input to predict the outcomes. Initially, this might just be a one-shot model, trained, tested, and validated on a k-fold cross-validation set (a machine learning technique to assess how well a model is likely to perform on unseen data) . This is the work typically done by classic data scientists. Once the model is performing well enough, it’s time to start productionizing it and placing it in a pipeline in the existing infrastructure, where performance will be monitored, and the model will be retrained when necessary.
Each of these phases requires different skills. During the initiation phase, people need to have business acumen, be familiar with data transformation, cleaning, descriptive statistics, and basic inferential statistics. This is work that can be done by a data analyst and/or a data scientist.
In the modeling phase, predictive models need to be built. Simple models, such as regressions, can be built by a data analyst, but if it becomes more complex, you’ll need a data scientist to build a model using an existing algorithm or even a machine learning engineer to alter current or create new algorithms.
When deploying and productionizing the model you enter the realm of the machine learning engineer or the data engineer. As opposed to the earlier stages there is not necessarily a tight link to business, and the task at hand revolved around creating and monitoring a pipeline around the predictive model to provide reliable output to the right target systems.
Throughout the entire process all data should be available in the right places with the right meta information, which is the role of the data architect. As new data is ingested or existing data is transformed into new information, they similarly ensure that the data ends up at the right place.
The way the different roles contribute through the different phases in the life cycle is illustrated in the image below. Since different roles contribute in different stages, they require different skills.
Roles at the beginning of the life cycle require more business acumen and less engineering, whereas later phases require less business acumen and more engineering and algorithm optimization. To illustrate the point, as a data scientist, you can get by with suboptimal computational performance to show the value and performance of your model. But as soon as you’re responsible with productionizing models, you need to be able to optimize the computational complexity to ensure your pipeline is (cost-)efficient.
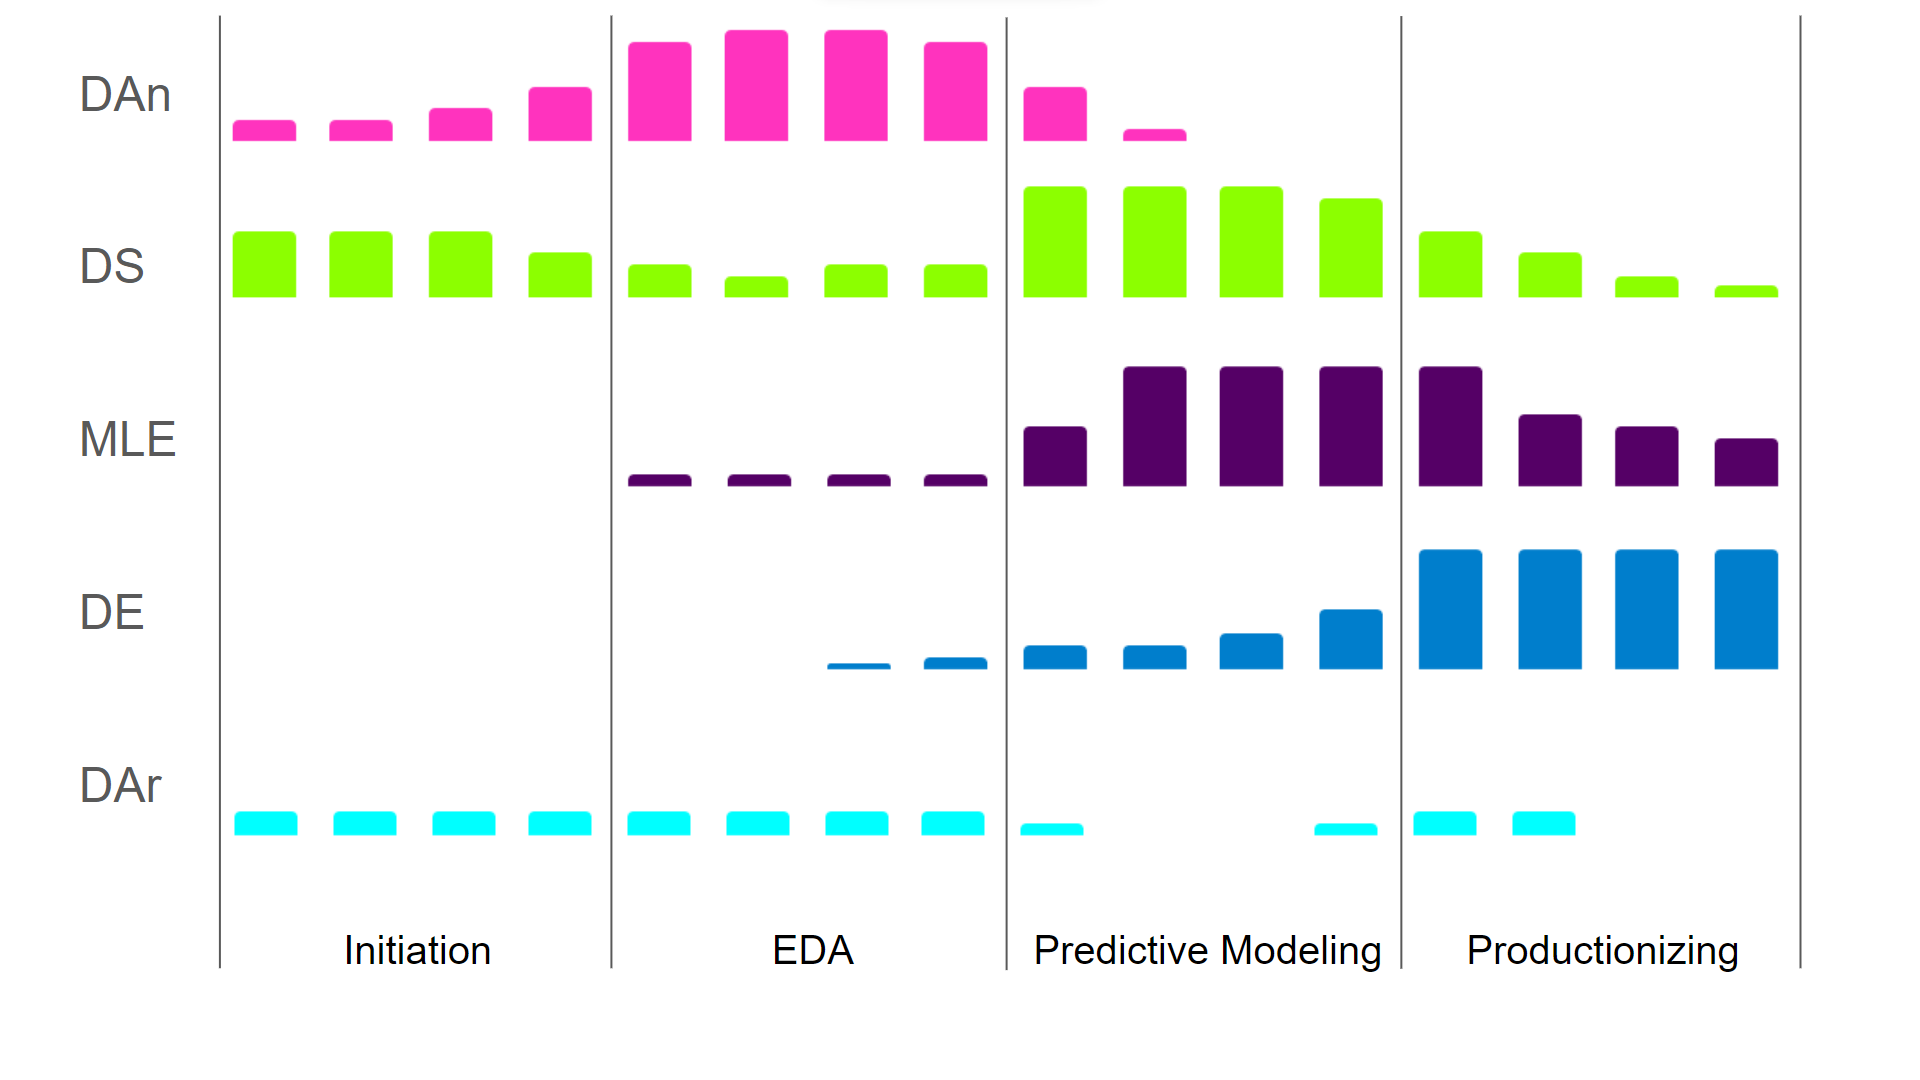
The level of contribution of the different Data Science Roles throughout a Data Science Project (DAn - Data Analyst, DS - Data Scientist, MLE - Machine Learning Engineer, DE - Data Engineer, DAr - Data Architect - Image by Author
It is important to know that the delineations between the roles are not strict. Many data scientists already think of the right source/target systems and computational efficiency and consider those in their code. A machine learning engineer might realize that certain feature generation approaches could improve model performance. A data analyst might have good advice on where in the data catalog to store the features generated for the data architect. In other words, all roles should, to some extent, be aware of the work of the other roles, but they do not have to understand each others’ responsibilities in depth.
With regard to the skills and tools you’ll need, there is a clear foundation. Regardless of where in the life cycle of a data science project you contribute, you will need to have some basic understanding of math and stats, collaborative software development, and data manipulation. Broadly, the start of any data science roadmap consists of:
There are different types of data science roles with different skill requirements: a Data Analyst will need a deeper knowledge of SQL than a Data Engineer. A Data Scientist needs to know Machine Learning better than a Data Architect. So this is where the data science roadmap splits: depending on where your ambitions lie in the data science landscape, you will need to learn different skills. The following sections will describe the different branches in the roadmap you can think of.
Regardless of how far along a data science roadmap you are, whether you are a seasoned veteran or someone just starting out, all data science projects start with understanding your data.
Getting a thorough understanding of your data is crucial to assess the feasibility of your project. Starting with basic questions such as ‘what variables do I have?’ and ‘how many observations do I have?’ and ending with more complex questions such as ‘what are the relationships between variables?’
Quite often the results of an EDA itself can be the answer to your stakeholder’s questions. When properly visualized and presented in a coherent way in for example a dashboard, the outcomes of a simple data analysis can be used to answer complex questions. This, however, does rely on the data visualization skill.
But just showing through your EDA that, for example, different segments of website visitors exist, you have contributed value in a data scientist way.
There are multiple ways to visualize your outcomes. Either in visualization libraries/packages in the language you use (such as R’s ggplot2 and Python’s matplotlib) or in dedicated data visualization tools (such as PowerBI, Tableau, or even Excel)
Especially when we focus more on the tasks of a Data Analyst, having a deeper understanding of data visualization helps.
For most data science roles, visualizations can serve to check assumptions through scatter plots and histograms, but when the analysis itself is the deliverable, such as for a Data Analyst, you will run into situations where you want to make the analysis outcomes a joy to digest.
Think of custom house styles, new visualizations, or infographics to serve as input for a decision-making unit. In these situations, it helps to be able to create a data visualization that is practically a work of art. Understanding Data Visualization is a course that really helps to deepen your dataviz competences.
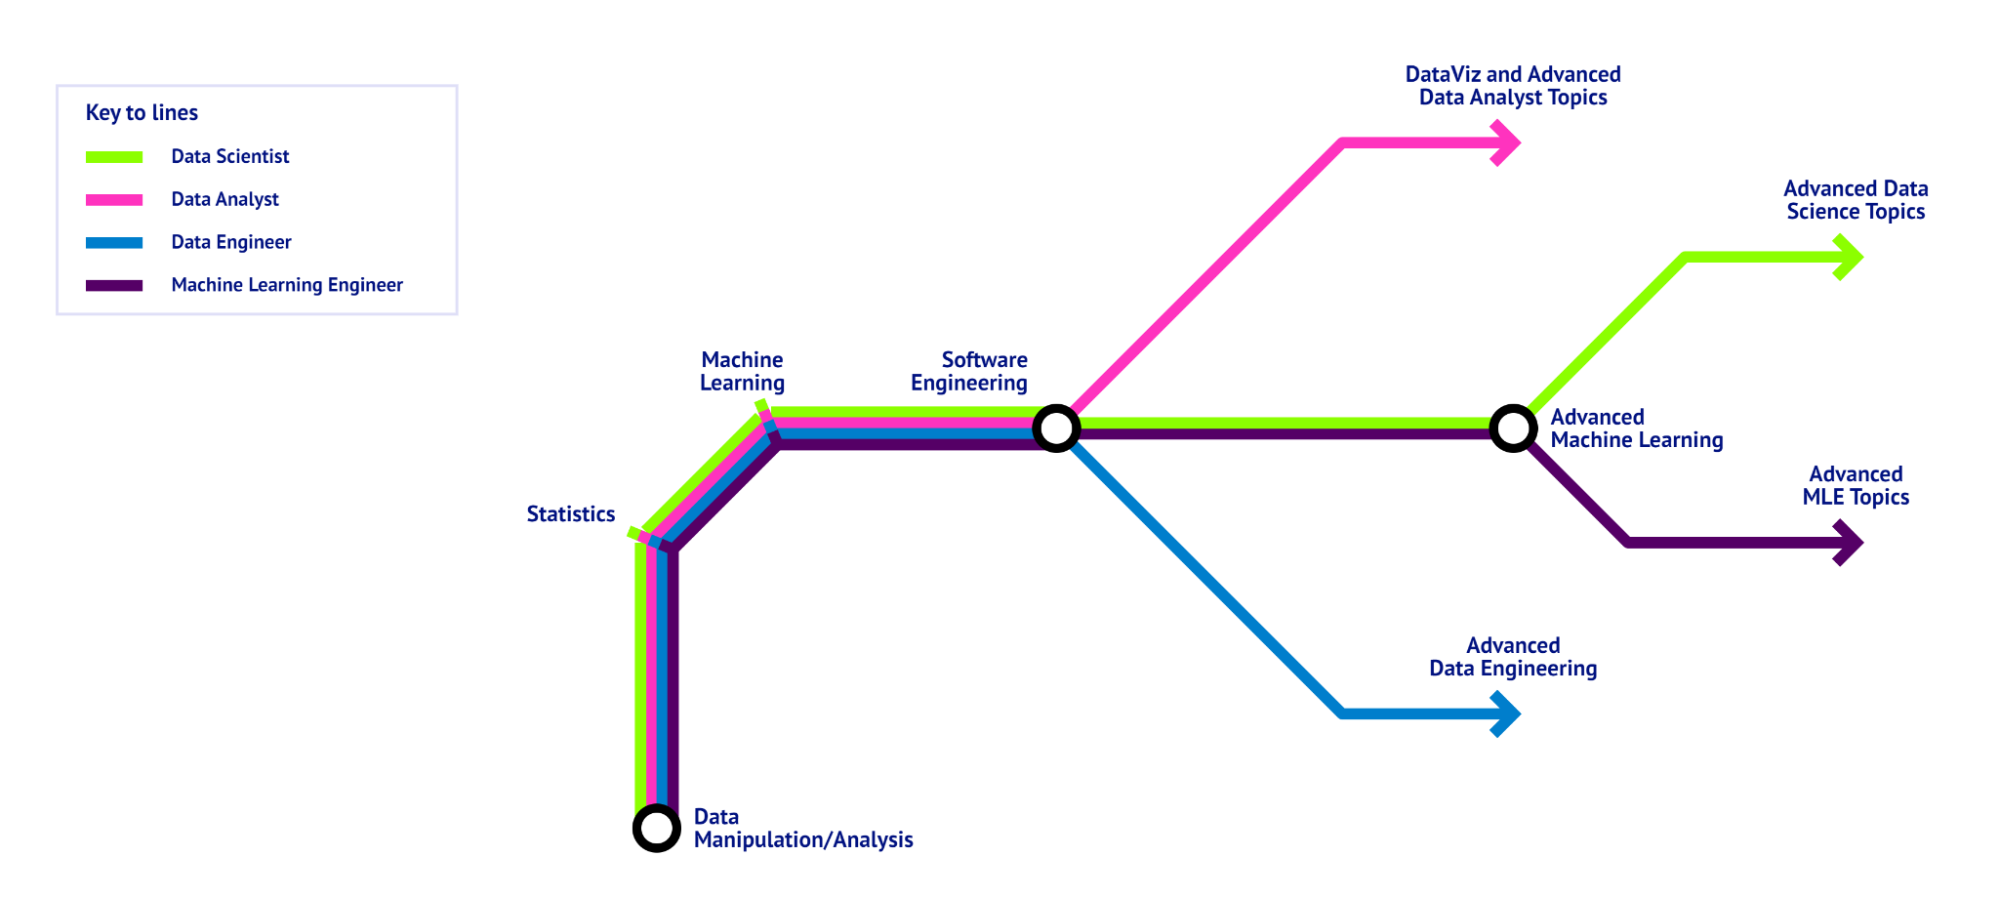
A Data Science Roadmap, visualized as a metro map, showing the foundation all data science Roles have in common and the skills specific to the different roles. - Image by Author
Another one of the first stops along a data science roadmap is statistics. Some basic statistical concepts should be second nature to any type of data scientist.
At any time, you will have to be able to describe your data and subgroups in your data. What is the average income in your dataset? What are the minimum and maximum incomes? What is the standard deviation, or what are other measures of spread? And if you have categorical values, how many unique values are there? What is the most occurring one? Do all values occur equally often, or is it distributed less uniformly?
Answering questions with descriptive analytics over groups/sub-groups can already provide valuable insights, but most often, you have to look at the relationship between variables in your dataset and move towards inferential statistics.
The challenging and interesting part of inferential statistics is the different types of categorical and numerical values and the relationships between those. Such examples includ:
To be able to answer these questions, you need to know the different types of statistical tests, ranging from the easiest T-Test to more complex methods such as multivariate linear regressions or time series analysis.
You can follow relevant courses to deepen your understanding of statistics in: Python, R, and even independent of tools. These courses provide a proper basis to start working with machine learning. By statistically understanding the relationship between predictors and target variables, you understand the principles of the algorithms used to make supervised learning models.
How deep you want to delve into this area depends again on where on the data science roadmap you want to go. If you’re aiming to be a data analyst, understanding the basics of statistics might suffice. Data architects may need no statistical knowledge at all. But data scientists and machine learning engineers will definitely encounter situations in which they have to rely on their statistical expertise.
Data science is built around numbers and calculations and, consequently, mathematics plays a large role. While an advanced math degree is not a necessary stop on a data science roadmap, understanding algebra and calculus will help you conceptually understand a number of methods often used in data science. Most dimensionality reduction approaches (such as PCA and Matrix Factorization) rely on Linear Algebra, and a lot of optimization algorithms (such as gradient descent) rely on Calculus.
And just as with statistics and data analysis, this knowledge is not necessarily relevant to all data science roles. If you are aiming to become a machine learning engineer, there is no way around mathematics. But most other roles - even a data scientist - might be able to get away without knowing their algebra and calculus.
To learn more about and understand algebraic concepts, check out our course on Linear Algebra for Data Science in R
Machine learning is the art of creating software that learns from data. It is really the bread and butter for data scientists, machine learning engineers, and even data engineers. The part of your solution that provides the expected sales revenue for your firm, based on your inventory and pricing? That’s built through machine learning!
The minimum level of knowledge you need as a data scientist is being able to train and evaluate models. In certain situations, you might want to delve deeper and learn how to alter existing algorithms or even write new algorithms, entering the realm of the machine learning engineer.
You have a lot of freedom in how you do your machine learning. You can either code everything yourself (in Python, or R, or C# or Java, with relevant libraries), you can use local software packages (such as Weka and RapidMiner), or you can use cloud solutions (such as Databricks and AWS SageMaker). While this makes it difficult to decide what to learn, the expertise you develop does transfer quite easily. A good idea to decide on what machine learning toolkit to start using would be either starting from a language you already know or checking what tools people use in the industry you’re interested in.
You can get started with our Machine Learning Scientist with Python career track, which covers many of the fundamentals you’ll need to start your career.
The relationship between machine learning, deep learning, and AI is debatable.
Back when I taught machine learning, my first lecture was always a lively class debate on the statement, “Machine Learning is a form of AI.” While they are sometimes used interchangeably, I am a firm believer that machine learning enables AI, but that does not mean that if you use machine learning, you have created AI.
For a data application to become AI, it is essential that there is a feedback loop in which the application or model learns from its output. In this case, a one-shot supervised learning algorithm is not necessarily AI. If you feedback the output of the model to the model (such as with reinforcement learning), you do get AI, as you have a system that automatically keeps on learning from its correct and incorrect predictions.
Deep learning is not much more than neural networks on steroids. What makes for interesting applications is that Deep Learning allows for super tangible outcomes, as these models can output text, images, and speech. If you work on a data science project where it is essential that the models output something that can be perceived or experienced by human end users, understanding deep learning can be a real advantage. A course that is a great starter is Introduction to Deep Learning in Python.
No data science effort lives in a vacuum. As you progress along your pathway, it is important to keep and showcase the artifacts you produce. Part of being a data scientist is being able to demonstrate what you can do.
To me, the most exciting part of data science is that you do not need much. You just need a public dataset and some creativity to come up with an interesting question and then answer that question using the data. Or you can just hop on DataLab or Kaggle and start working on the assignments and/or contests, getting inspiration from other submissions.
Alternatively, you can collect and use your own data. I’ve analyzed my cycling data downloaded from Strava and I’ve scraped real estate data to help me in my search of the housing market.
The most important part is that you document what you do. Try to make your work reproducible, explain the steps you took, share your code, and share the output of your analysis or system. Who knows? Maybe your practice exercise is the exact solution to someone’s problem.

In my opinion the most interesting projects are those that come from your own passion and interests. If you use a dataset from somewhere that you know well, odds are you can come up with unique and interesting questions. You know the domain, and you know the data... But if you really start from scratch, there are plenty of things to start working on, including dating applications, trading, sports.
You can also find a huge range of data science projects on DataCamp, that allow you to get familiar with the type of work. Whether starting with some data analytics projects or working on specific Python projects, you can work up to machine learning and even AI projects. There are plenty of options to help you get started.
If, despite everything that is there, you cannot find a way to get started, another useful alternative might be participating in hackathons. Many research institutes and bigger companies organize periodic hackathons.
These hackathons often have the goal to have teams of data scientists input on a relevant problem and they thus provide an opportunity to collaborate with and learn from other data science professionals. It allows you to thus build a network and be noticed by potential employers while gaining useful experience.
Nowadays it is hard to imagine a data scientist that does not have a GitHub, DataCamp portfolio, or a Medium page or a blog with code. A portfolio is something crucial in data science, just as in other creative industries.
Being able to demonstrate past projects is a great way to convince people that you have what it takes. This is why it is worthwhile to start documenting your work on a portfolio. Alternatively, you can document your work and viewpoints as blog posts or even as academic publications. Check out our post on showcasing your data expertise with a portfolio for some inspiration.
Regardless of what you choose, make sure to keep a presentable overview of the projects you worked on.
This entire post has highlighted the different skills, knowledge, and tools that are available to a data scientist. But where to start when deciding on a career?
In my opinion, this really depends on where your ambitions are. This post so far should have made it clear that I do not believe there is a one-size-fits-all data science roadmap.
Of course, every data science role builds on a foundation of statistics, data manipulation, machine learning, and software engineering. But other than that, it really depends.
A data scientist uses algorithms, while a machine learning engineer alters or creates algorithms. The data scientist can thus suffice with knowing a lot of algorithms and when to apply them, while the machine learning engineer really has to understand the mathematical concepts behind the algorithms.
Similarly, if you get your energy from sharing outcomes of analysis, such as a data scientist or data analyst, you will most likely benefit more from a thorough knowledge of data visualization and EDA than from being very good at data modeling.
Thus, the data science roadmap has quite a few forks, and you can decide for yourself how deep you want to go in the different data science branches.
Despite the differences between the roles, in any interview you will be tested on hard and soft skills. These tests will be different for the role you are pursuing.
If you are not looking for a role like a machine learning or data engineer, you will most likely not be asked questions such as “How would you optimize algorithm A or B?”. So it is important to focus on the skills and thus questions you are expected and willing to work on. Getting questions about topics you are not familiar with may be a sign that the role is not for you.
Because in this fairly new field, especially in firms where data is relatively new, there are a lot of misconceptions about what data scientists are or what they do.
I know I have applied to the role of data scientist where the interviewer interchangeably used data scientist and machine learning engineer. It is thus quite possible that the hiring manager messed up if you get asked questions you cannot answer. Hardly ever should a data engineer be asked how they would do stakeholder management in a project, for example.
Thankfully, there are several resources available to help prepare for interviews in the field depending on the role you’re applying for:
The field of data science is very dynamic, and it is crucial to stay up to date with the latest trends. With ChatGPT, Generative AI became mainstream, and it’s now hard to imagine a data scientist who does not at least have some notion of token embeddings and/or attention models. Similarly, the introduction of MLOps makes it hard to imagine a data engineer manually checking model performance and drift.
With this dynamic growth, different aspects of AI become important. Currently, a lot of attention goes out to the ethical and legal aspects of AI, as demonstrated by several academic and political debates that have among others, resulted in new rules and regulations.
Regardless of the decisions of governments with regard to AI, nobody wants to be responsible for the next scandal in data science. The only way to avoid this is by remaining aware of ethical and legal boundaries. Or better yet, as a data science professional, you can start contributing to these developments by using your background and forming and vocalizing an opinion.
There are many ways to remain up to date. Of course, there is DataCamp as a platform, but you can also start looking for and following inspiring data science practitioners in your field. Check out if they have blogs, X or Medium posts, or anything else where you can get a glimpse of how they view the changing and dynamic landscape.

As we’ve highlighted throughout this article, there are many resources available to anyone wanting to either start or grow in the data science field. Alternatively, if you want to be really close to the source, you can look at technical conferences such as NeurIPS, ICML, or KDD. Check out these and more on our the list of the Top Data Science Conferences for 2026.
Although there are many stops on the data science roadmap, there is no one single data science pathway. Navigating the data science landscape requires you to have 1) an idea of the landscape (which you hopefully get from this post) and 2) an idea of your strengths, weaknesses, and interests, so that you can decide what to pursue.
If you have these, you can rely on this article to push you in the right direction and what skills to put your emphasis on during your training. Thankfully, there are some helpful resources to get you started, such as DataCamp’s career tracks, which arm with with the skills you need to start exploring different professions:
Start Your Data Science journey Today!
Track
Course
Course
blog
Matt Crabtree
9 min
blog
Jose Jorge Rodriguez Salgado
12 min
blog
DataCamp Team
3 min
blog
Javier Canales Luna
13 min
blog
Andrei Kurtuy
10 min
Tutorial
Karlijn Willems