R is one of the most popular programming languages in data science and is widely used across various industries and in academia. Given that it’s open-source, easy to learn, and capable of handling complex data and statistical manipulations, R has become the preferred computing environment for many data scientists today.
This cheat sheet will cover an overview of getting started with R. Use it as a handy, high-level reference for a quick start with R. You can also try this cheat sheet out interactively on DataCamp Workspace, just follow this link to do so!
Have this cheat sheet at your fingertips
Download PDFAccessing Help in R
?max: Shows the help documentation for the max function?tidyverse: Shows the documentation for the tidyverse package??"max": Returns documentation associated with a given inputstr(my_df): Returns the structure and information of a given objectclass(my_df): Returns the class of a given object
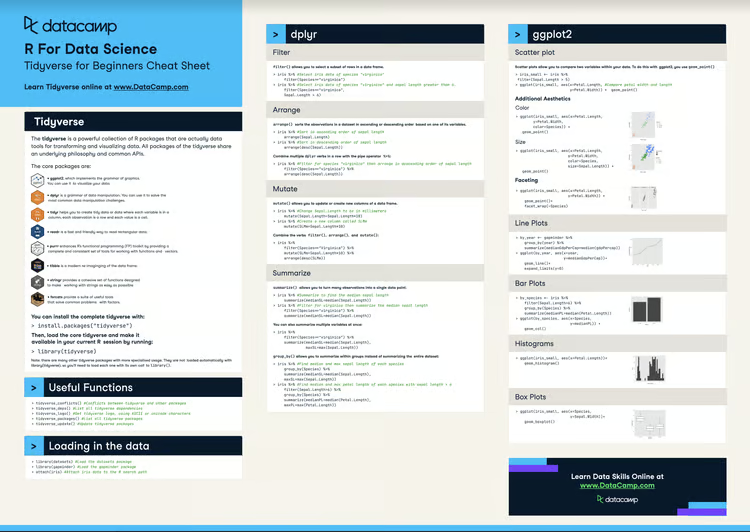
Using Packages in R
R packages are collections of functions and tools developed by the R community. They increase the power of R by improving existing base R functionalities, or by adding new ones.
install.packages(“tidyverse”): Lets you install new packages (e.g., tidyverse package)library(tidyverse): Lets you load and use packages (e.g., tidyverse package)
The Working Directory
The working directory is a file path that R will use as the starting point for relative file paths. That is, it's the default location for importing and exporting files. An example of a working directory looks like ”C://file/path"
getwd(): Returns your current working directorysetwd(“C://file/path”): Changes your current working directory to a desired file path
Operators in R
Arithmetic Operators in R
| Operator | Description |
a + b |
Sums two variables |
a - b |
Subtracts two variables |
a * b |
Multiply two variables |
a / b |
Divide two variables |
a ^ b |
Exponentiation of a variable |
a %% b |
The remainder of a variable |
a %/% b |
Integer division of variables |
Relational Operators in R
| Operator | Description |
a == b |
Tests for equality |
a != b |
Tests for inequality |
a > b |
Tests for greater than |
a < b |
Tests for smaller than |
a >= b |
Tests for greater or equal than |
a <= b |
Tests for smaller or equal than |
Logical Operators in R
| Operator | Description |
! |
Logical NOT |
& |
Element-wise Logical AND |
&& |
Logical AND |
| |
Element-wise Logical OR |
|| |
Logical OR |
Assignment Operators in R
| Operator | Description |
|
|
Assigns a variable to x |
Other Operators in R
| Operator | Description |
%in% |
Identifies whether an element belongs to a vector |
$ |
Allows you to access objects stored within an object |
%>% |
Part of magrittr package, it’s used to pass objects to functions |
Getting Started with Vectors in R
Vectors are one-dimension arrays that can hold numeric data, character data, or logical data. In other words, a vector is a simple tool to store data.
Creating Vectors in R
| Input | Output | Description |
c(1,3,5) |
1 3 5 |
Creates a vector using elements separated by commas |
1:7 |
1 2 3 4 5 6 7 |
Creates a vector of integers between two numbers |
seq(2,8,by = 2) |
2 4 6 8 |
Creates a vector between two numbers, with a specified interval between each element. |
rep(2,8,times = 4) |
2 8 2 8 2 8 2 8 |
Creates a vector of given elements repeated a number of times. |
rep(2,8,each = 3) |
2 2 2 8 8 8 |
Creates a vector of given elements repeating each element a number of times. |
Vector Functions in R
sort(my_vector): Returnsmy_vectorsortedrev(my_vector): Reverses the order ofmy_vectortable(my_vector): Count the values in a vectorunique(my_vector): Distinct elements in a vector
Selecting Vector Elements in R
my_vector[6]: Returns the sixth element ofmy_vectormy_vector[-6]: Returns all but the sixth elementmy_vector[2:6]: Returns elements two to sixmy_vector[-(2:6)]: Returns all elements except those between the second and the sixthmy_vector[c(2,6)]: Returns the second and sixth elementsmy_vector[x == 5]: Returns elements equal to5my_vector[x < 5 ]: Returns elements less than5my_vector[x %in% c(2, 5 ,8 )]: Returns elements in the set{2, 5, 8}
Math Functions in R
log(x): Returns the logarithm of a variableexp(x): Returns exponential of a variablemax(x): Returns the maximum value of a vectormin(x): Returns the minimum value of a vectormean(x): Returns the mean of a vectorsum(x): Returns the sum of a vectormedian(x): Returns the median of a vectorquantile(x): Percentage quantiles of a vectorround(x, n): Round to n decimal placesrank(x): Rank of elements in a vectorsignif(x, n): Round off n significant figuresvar(x): Variance of a vectorcor(x, y): Correlation between two vectorssd(x): Standard deviation of a vector
Getting Started with Strings in R
The “stringr” package makes it easier to work with strings in R - you should install and load this package to use the following functions.
Find matches
#Detects the presence of a pattern match in a string
str_detect(string, pattern, negate = FALSE)
#Detects the presence of a pattern match at the beginning of a string
str_starts(string, pattern, negate = FALSE) #Finds the index of strings that contain pattern match
str_which(string, pattern, negate = FALSE) #Locates the positions of pattern matches in a string
str_locate(string, pattern)#Counts the number of pattern matches in a string
str_count(string, pattern)Subset
#Extracts substrings from a character vector
str_sub(string, start = 1L, end = -1L)
#Returns strings that contain a pattern match
str_subset(string, pattern, negate = FALSE) #Returns first pattern match in each string as a vector
str_extract(string, pattern) #Returns first pattern match in each string as a matrix with a column for each group in the pattern
str_match(string, pattern)Mutate
#Replaces substrings by identifying the substrings with str_sub() and assigning them to the results.
str_sub() <- value
#Replaces the first matched pattern in each string.
str_replace(string, pattern, replacement) #Replaces all matched patterns in each string
str_replace_all(string, pattern, replacement) #Converts strings to lowercase
str_to_lower(string) #Converts strings to uppercase
str_to_upper(string) #Converts strings to title case
str_to_title(string) Join and split
#Repeats strings n times
str_dup(string, n)
#Splits a vector of strings into a matrix of substrings
str_split_fixed(string, pattern, n) Getting Started with Data Frames in R
A data frame has the variables of a data set as columns and the observations as rows.
#This creates the data frame df, seen below
df <- data.frame(x = 1:3, y = c(“h”, “i”, “j”), z = 12:14)| x | y | z |
| 1 | h | 12 |
| 2 | i | 13 |
| 3 | j | 14 |
#This selects all columns of the third row
df[3, ]| x | y | z |
| 3 | j | 14 |
#This selects the column z
df$z| z |
| 12 |
| 13 |
| 14 |
#This selects all rows of the second column
df[ ,2]| y |
| h |
| i |
| j |
#This selects the third column of the second row
df[2,3]

13
Manipulating Data Frames in R
#Takes a sequence of vector, matrix or data-frame arguments and combines them by columns
bind_cols(df1, df2)
#Takes a sequence of vector, matrix or data frame arguments and combines them by rows
bind_rows(df1, df2)#Extracts rows that meet logical criteria
filter(df, x == 2)#Removes rows with duplicate values
distinct(df, z)#Selects rows by position
slice(df, 10:15)#Selects rows with the highest values
slice_max(df, z, prop = 0.25)#Extracts column values as a vector, by name or index
pull(df, y)#Extracts columns as a table
select(df, x, y)#Moves columns to a new position
relocate(df, x, .after = last_col())#Renames columns
rename(df, “age” = z)#Orders rows by values of a column from high to low
arrange(df, desc(x))#Computes table of summaries
summarise(df, total = sum(x))#Computes table of summaries.
summarise(df, total = sum(x))#Use group_by() to create a "grouped" copy of a table grouped by columns (similarly to a pivot table in spreadsheets). dplyr functions will then manipulate each "group" separately and combine the results
df %>%
group_by(z) %>%
summarise(total = sum(x))