Have this cheat sheet at your fingertips
Download PDF
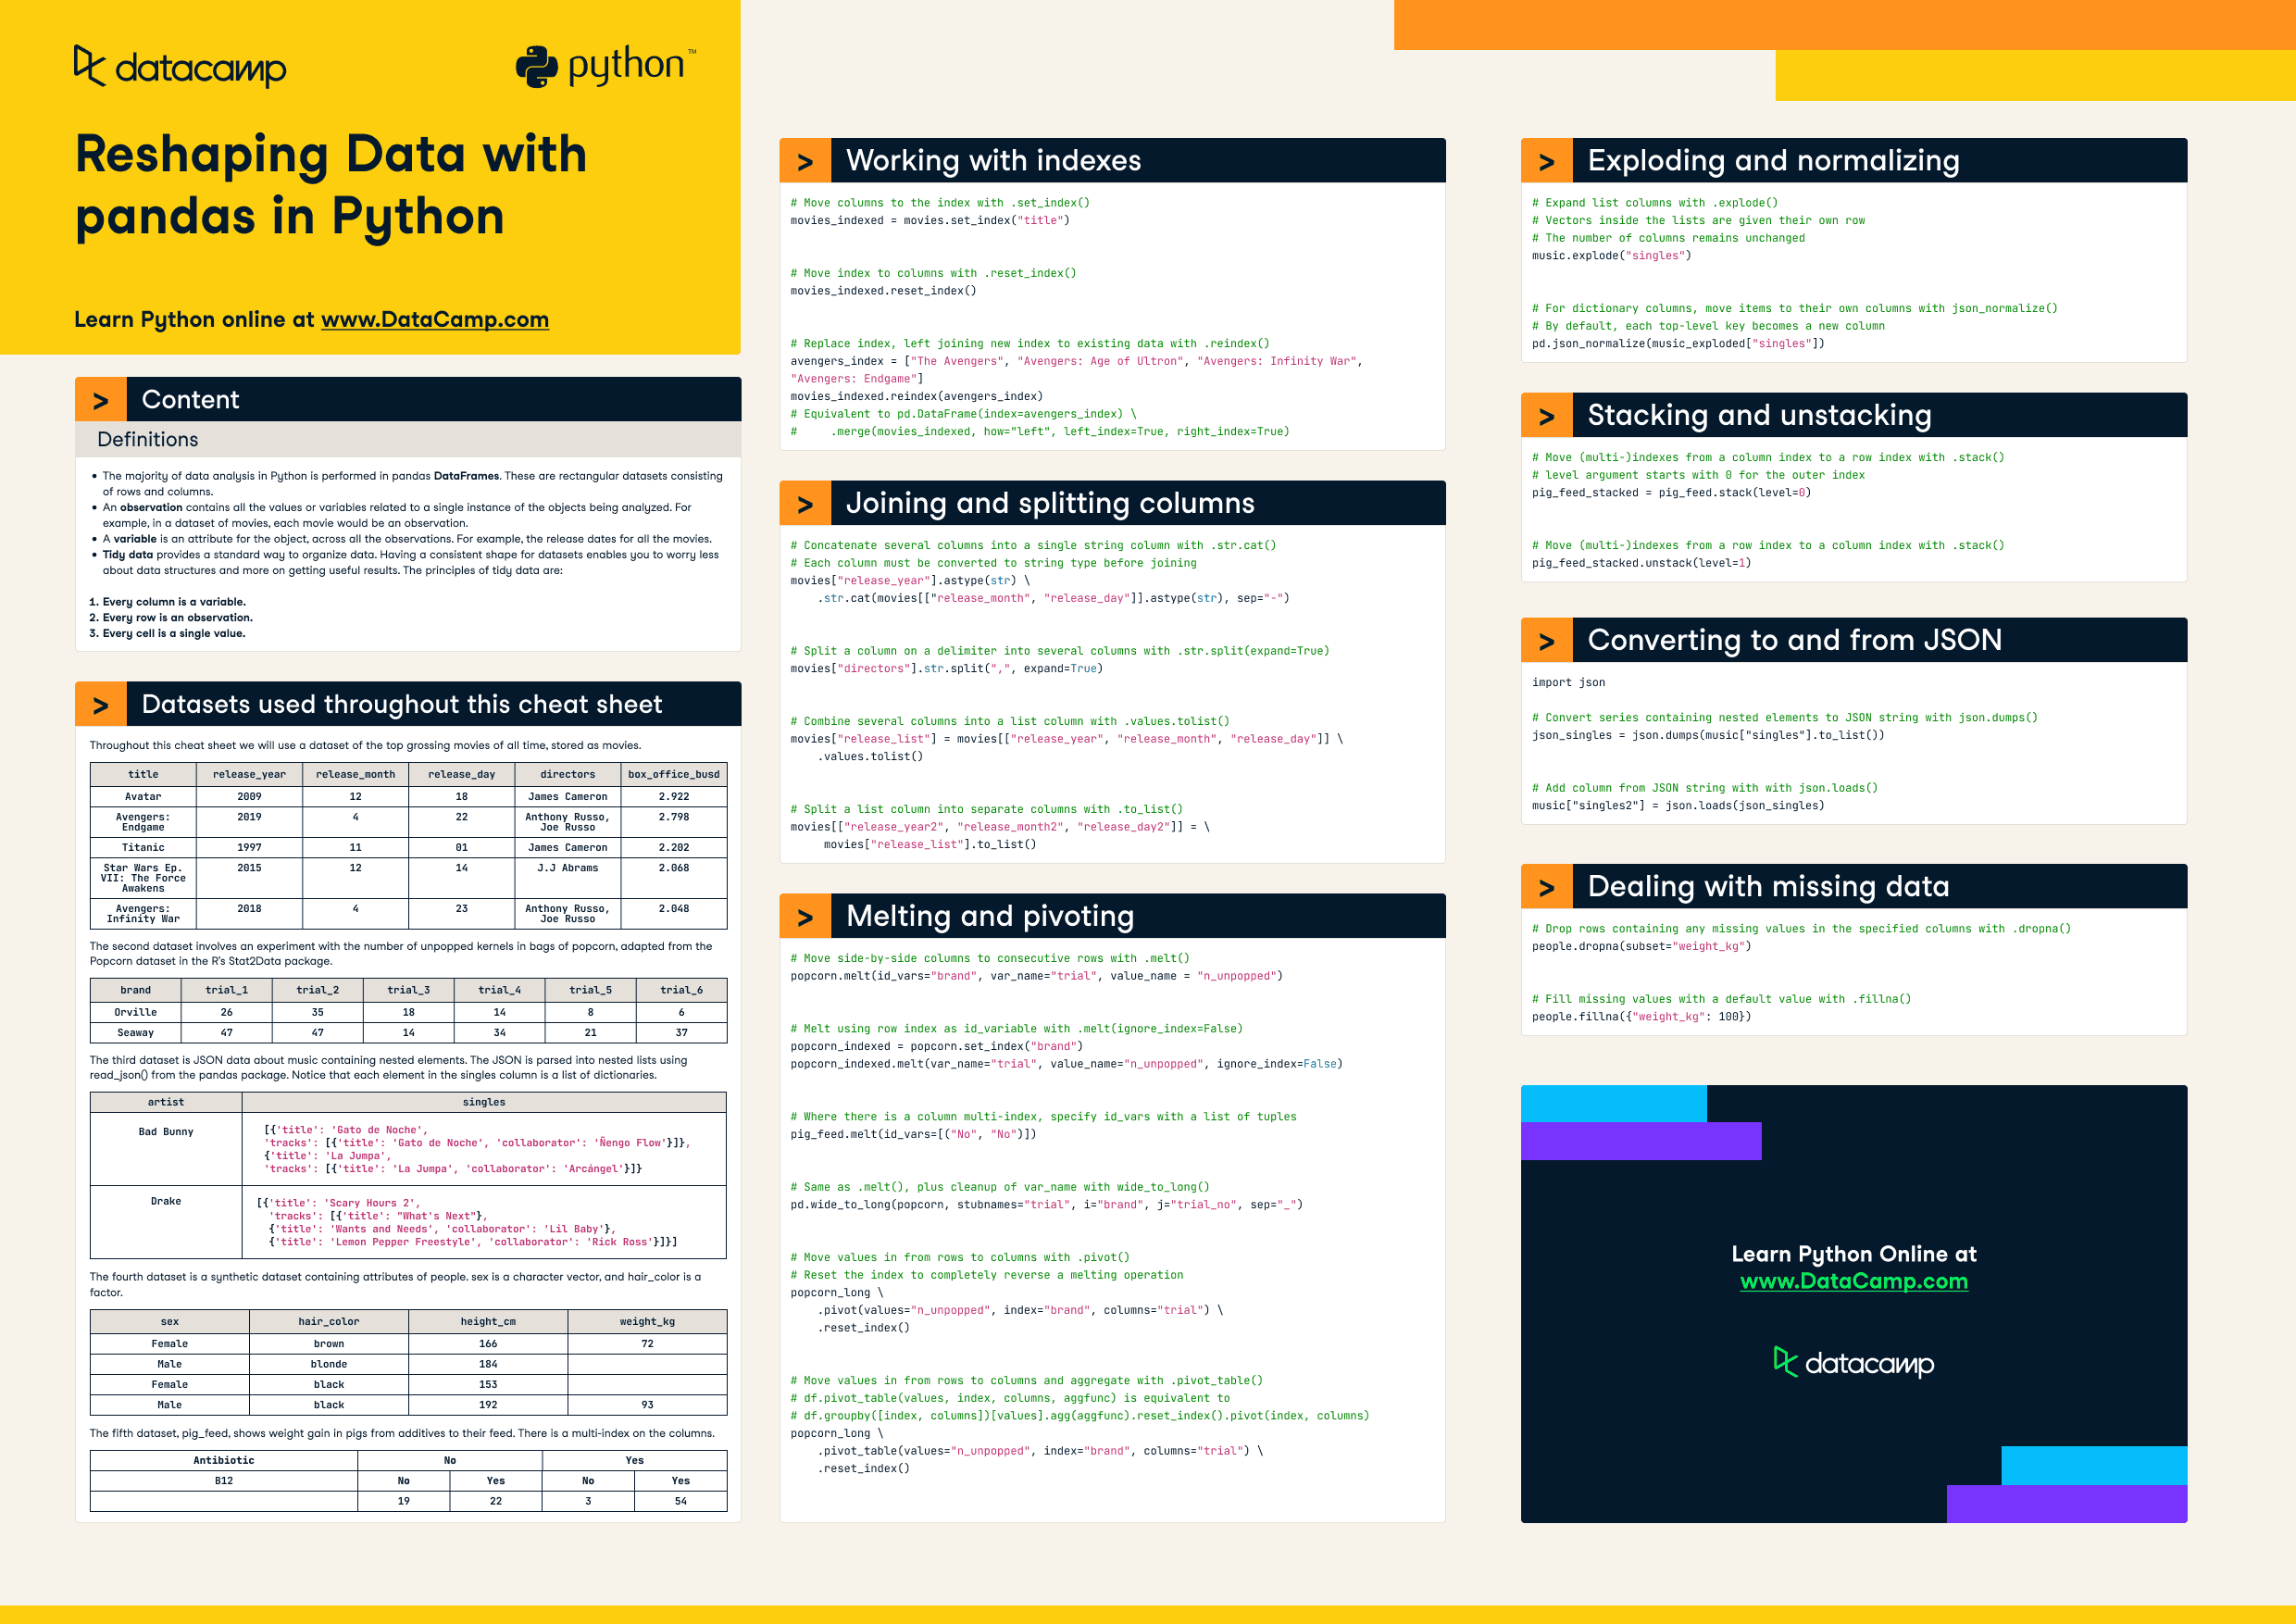
Definitions
- The majority of data analysis in Python is performed in pandas DataFrames. These are rectangular datasets consisting of rows and columns.
- An observation contains all the values or variables related to a single instance of the objects being analyzed. For example, in a dataset of movies, each movie would be an observation.
- A variable is an attribute for the object, across all the observations. For example, the release dates for all the movies.
- Tidy data provides a standard way to organize data. Having a consistent shape for datasets enables you to worry less about data structures and more on getting useful results. The principles of tidy data are:
-
- Every column is a variable.
- Every row is an observation.
- Every cell is a single value.
Datasets used throughout this cheat sheet
Throughout this cheat sheet we will use a dataset of the top grossing movies of all time, stored as movies.
|
title |
release_year |
release_month |
release_day |
directors |
box_office_busd |
|
Avatar |
2009 |
12 |
18 |
James Cameron |
2.922 |
|
Avengers: Endgame |
2019 |
4 |
22 |
Anthony Russo,Joe Russo |
2.798 |
|
Titanic |
1997 |
11 |
01 |
James Cameron |
2.202 |
|
Star Wars Ep. VII: The Force Awakens |
2015 |
12 |
14 |
J. J. Abrams |
2.068 |
|
Avengers: Infinity War |
2018 |
4 |
23 |
Anthony Russo,Joe Russo |
2.048 |
The second dataset involves an experiment with the number of unpopped kernels in bags of popcorn, adapted from the Popcorn dataset in the R's Stat2Data package.
|
brand |
trial_1 |
trial_2 |
trial_3 |
trial_4 |
trial_5 |
trial_6 |
|
Orville |
26 |
35 |
18 |
14 |
8 |
6 |
|
Seaway |
47 |
47 |
14 |
34 |
21 |
37 |
The third dataset is JSON data about music containing nested elements. The JSON is parsed into nested lists using read_json() from the pandas package. Notice that each element in the singles column is a list of dictionaries.
|
artist |
singles |
|
|
Bad Bunny |
|
|
|
Drake |
|
|
The fourth dataset is a synthetic dataset containing attributes of people. sex is a character vector, and hair_color is a factor.
|
sex |
hair_color |
height_cm |
weight_kg |
|
female |
brown |
166 |
72 |
|
male |
blonde |
184 |
|
|
female |
black |
153 |
|
|
male |
black |
192 |
93 |
The fifth dataset, pig_feed, shows weight gain in pigs from additives to their feed. There is a multi-index on the columns.
|
Antibiotic |
No |
Yes |
||
|
B12 |
No |
Yes |
No |
Yes |
|
19 |
22 |
3 |
54 |
|
Working with indexes
# Move columns to the index with .set_index()
movies_indexed = movies.set_index("title")
# Move index to columns with .reset_index()
movies_indexed.reset_index()# Replace index, left joining new index to existing data with .reindex()
avengers_index = ["The Avengers", "Avengers: Age of Ultron", "Avengers: Infinity War", "Avengers: Endgame"]
movies_indexed.reindex(avengers_index)
# Equivalent to pd.DataFrame(index=avengers_index) \
# .merge(movies_indexed, how="left", left_index=True, right_index=True)Joining and splitting columns
# Concatenate several columns into a single string column with .str.cat()
# Each column must be converted to string type before joining
movies["release_year"].astype(str) \
    .str.cat(movies[["release_month", "release_day"]].astype(str), sep="-")
# Split a column on a delimiter into several columns with .str.split(expand=True)
movies["directors"].str.split(",", expand=True)# Combine several columns into a list column with .values.tolist()
movies["release_list"] = movies[["release_year", "release_month", "release_day"]] \
.values.tolist()# Split a list column into separate columns with .to_list()
movies[["release_year2", "release_month2", "release_day2"]] = \
movies["release_list"].to_list()Melting and pivoting
# Move side-by-side columns to consecutive rows with .melt()
popcorn.melt(id_vars="brand", var_name="trial", value_name = "n_unpopped")
# Melt using row index as id_variable with .melt(ignore_index=False)
popcorn_indexed = popcorn.set_index("brand")
popcorn_indexed.melt(var_name="trial", value_name = "n_unpopped", ignore_index=False)# Where there is a column multi-index, specify id_vars with a list of tuples
pig_feed.melt(id_vars=[("No", "No")])# Same as .melt(), plus cleanup of var_name with wide_to_long()
pd.wide_to_long(popcorn, stubnames="trial", i="brand", j="trial_no", sep="_")# Move values in from rows to columns with .pivot()
# Reset the index to completely reverse a melting operation
popcorn_long \
.pivot(values="n_unpopped", index="brand", columns="trial") \
.reset_index()# Move values in from rows to columns and aggregate with .pivot_table()
# df.pivot_table(values, index, columns, aggfunc) is equivalent to
# df.groupby([index, columns])[values].agg(aggfunc).reset_index().pivot(index, columns)
popcorn_long \
.pivot_table(values="n_unpopped", index="brand", columns="trial") \
.reset_index()Exploding and normalizing
# Expand list columns with .explode()
# Vectors inside the lists are given their own row
# The number of columns remains unchanged
music.explode("singles")
# For dictionary columns, move items to their own columns with json_normalize()
# By default, each top-level key becomes a new column
pd.json_normalize(music_exploded["singles"])Converting to and from JSON
import json# Convert series containing nested elements to JSON string with json.dumps()
json_singles = json.dumps(music["singles"].to_list())# Add column from JSON string with with json.loads()
music["singles2"] = json.loads(json_singles)Stacking and unstacking
# Move (multi-)indexes from a column index to a row index with .stack()
# level argument starts with 0 for the outer index
pig_feed_stacked = pig_feed.stack(level=0)
# Move (multi-)indexes from a row index to a column index with .stack()
pig_feed_stacked.unstack(level=1)Dealing with missing data
# Drop rows containing any missing values in the specified columns with .dropna()
people.dropna(subset="weight_kg")
# Fill missing values with a default value with .fillna()
people.fillna({"weight_kg": 100})