
3. Qlik Sense
Qlik Sense is a strong pick for larger teams that want an associative data model, where clicking one value instantly filters every other chart to show what is related.
It deploys on-premises or in the cloud and can clean and sort data on the way in, which suits big analytics teams. It is best suited to people who already have some data analysis experience, and its pricing sits above Power BI.
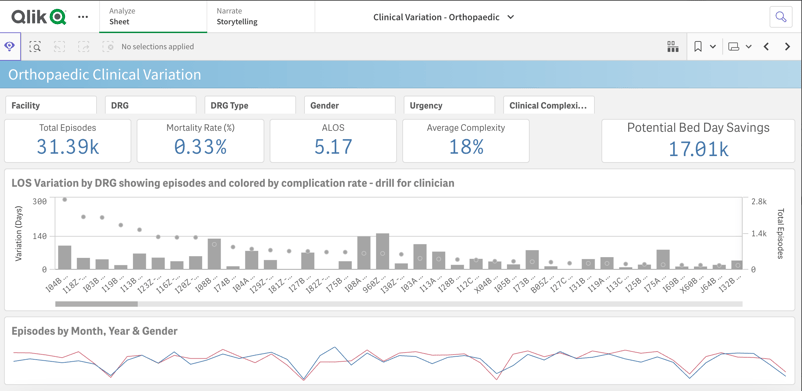
Best for: established analytics teams that want associative, self-service exploration.
4. Sigma
Sigma is the newest tool on this list and the one to watch if your company's data lives in a cloud warehouse.
Built by Sigma Computing, it gives you a spreadsheet-like interface that queries Snowflake, BigQuery, Databricks, and Redshift live, so dashboards reflect current data with no extracts to refresh. The catch is that it only makes sense once your data is already in a supported warehouse, so it is less relevant for a solo analyst working from spreadsheets.
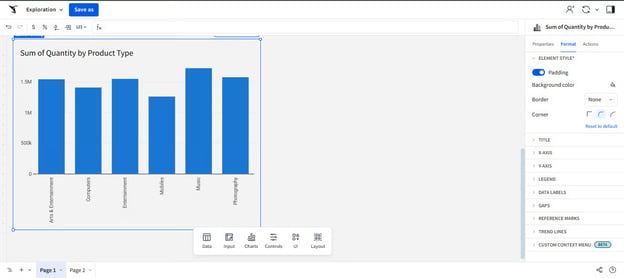
Best for: analysts building dashboards on live cloud-warehouse data.
Learn it with DataCamp: Introduction to Sigma, Visualizations in Sigma, the Sigma Fundamentals skill track, and many more courses.
5. Google Data Studio
Google Data Studio, formerly Looker Studio, is the budget choice for dashboards built on Google data.
The core product is free, and it connects natively to Google Analytics 4, Google Sheets, and BigQuery, which makes it the default for marketing and web reporting. It is less suited to heavy modeling or non-Google sources, where a full BI tool does more.
Best for: free marketing and web dashboards on Google data sources.
6. Microsoft Excel
Excel is still where a large share of business reporting actually happens, and it is often the fastest way to a first dashboard.
With PivotCharts, slicers, and sparklines, you can build an interactive summary on data you already hold, without learning a new platform. Its limits show up at scale: large datasets and live refresh are where a dedicated BI tool takes over.
Best for: quick dashboards and reports on data that already sits in a spreadsheet.
Learn it with DataCamp: the Data Visualization in Excel course (rated 4.8, 3 hours) is built around dashboard best practices.
No-Code Tools for Charts and Web Publishing
These tools make single charts, not full reporting dashboards. Reach for them when you need to publish a clean, interactive graphic to a website or article without writing code.
7. Datawrapper
Datawrapper is the tool of choice for data journalism and web-ready charts. The Washington Post, The Guardian, Vox, and The Wall Street Journal all use it, and its free tier includes a built-in color-blindness checker that few competitors match. You can only import from a few data sources, and the more advanced features sit behind paid plans.
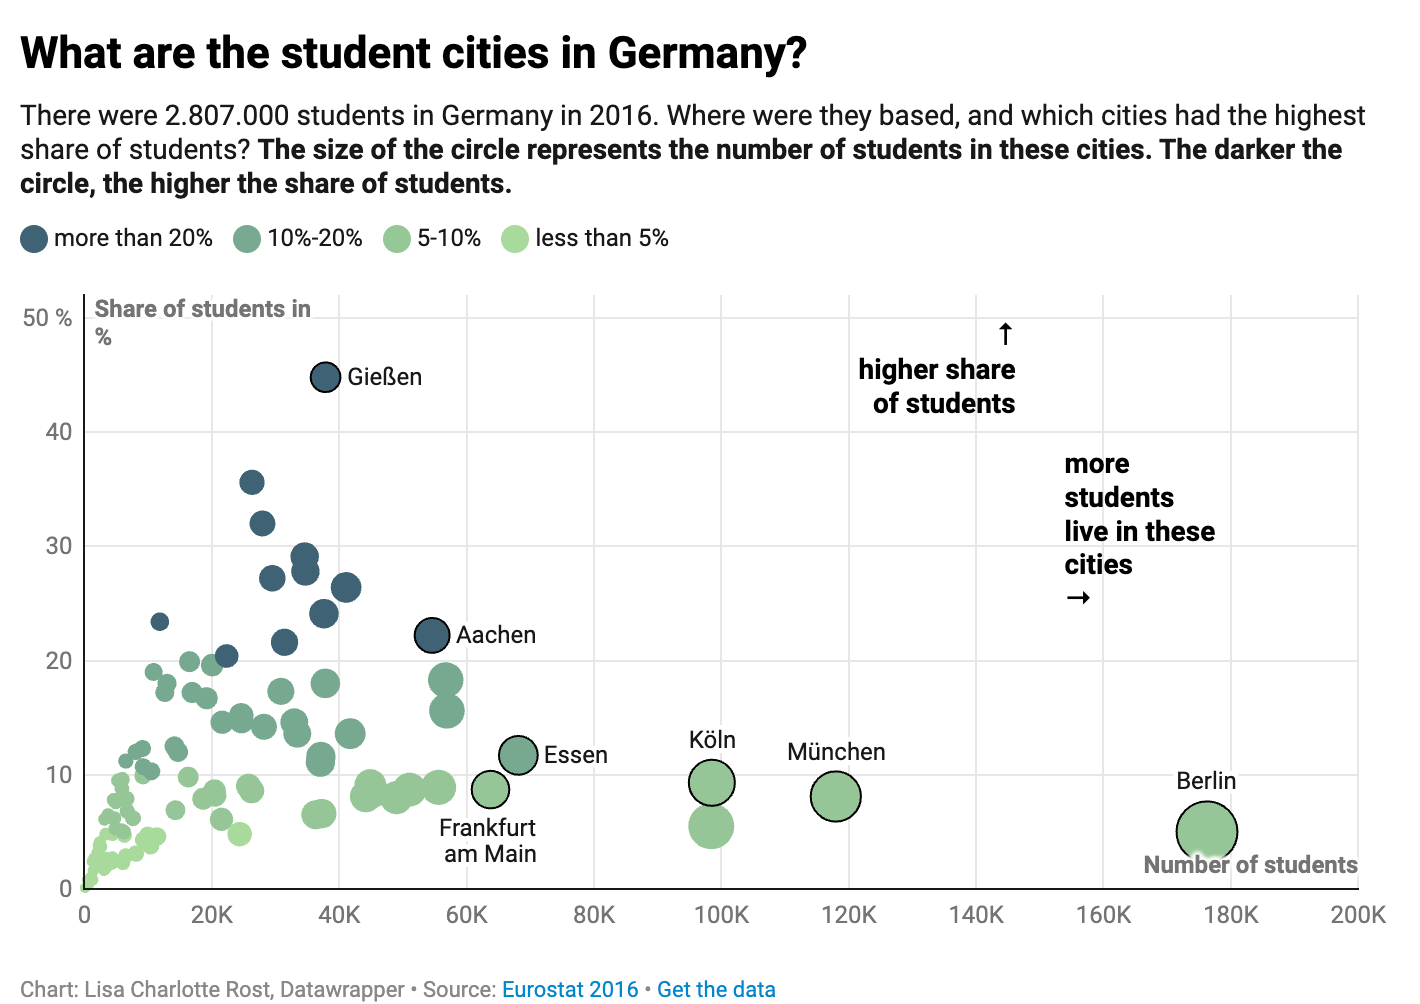
Best for: publishing polished, accessible charts to a website or article.
8. Google Charts
Google Charts is a free JavaScript library for embedding interactive charts on a website. It works across every major browser and has an easy interface for picking chart types, though publishing your own visualization needs basic JavaScript knowledge and its styling options are limited.
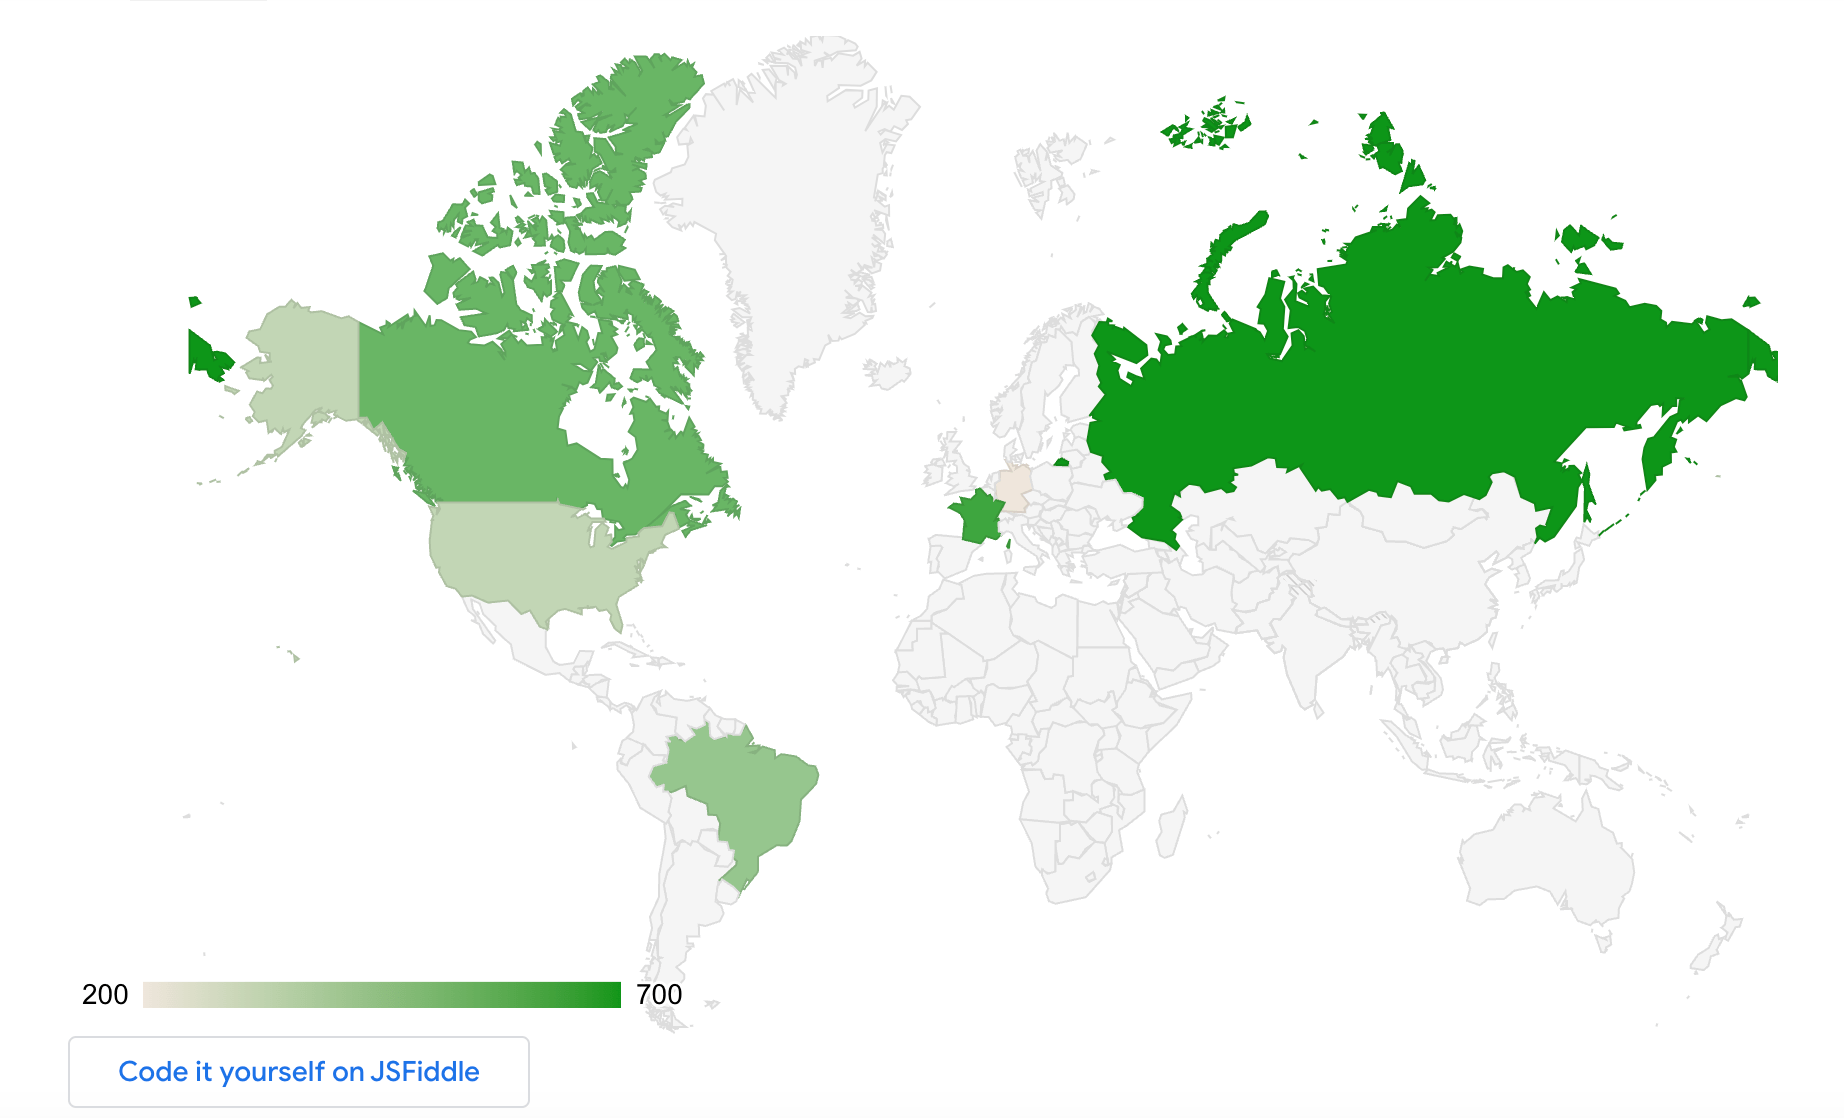
Best for: free interactive charts embedded on a web page.
9. RAWGraphs
RAWGraphs is a free, open-source, no-code tool that turns a pasted spreadsheet into a chart in the browser. Launched in 2013, it needs no account or setup and exports to several formats, which makes it handy for quick, unusual chart types. Its chart library is small and offers only a few styling controls.
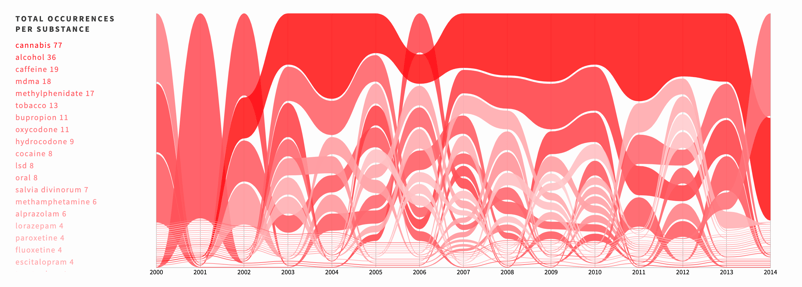
Best for: fast, one-off charts with no sign-up.
Python Libraries for Custom Data Visualization
Once you outgrow no-code tools and want full control, Python libraries let you script every element of a chart. These take longer to learn, so treat them as the next step after you are comfortable with a BI tool, not the starting point for dashboard work.
10. Matplotlib
Matplotlib is the standard Python library for data visualization and the foundation most others build on. Created by John D. Hunter in 2003, it draws line plots, histograms, bar charts, and scatter plots in a few lines of code and exports to PDF, PNG, and SVG. Its flexibility is also its cost: the documentation is dense and getting a plot exactly right can take real time.
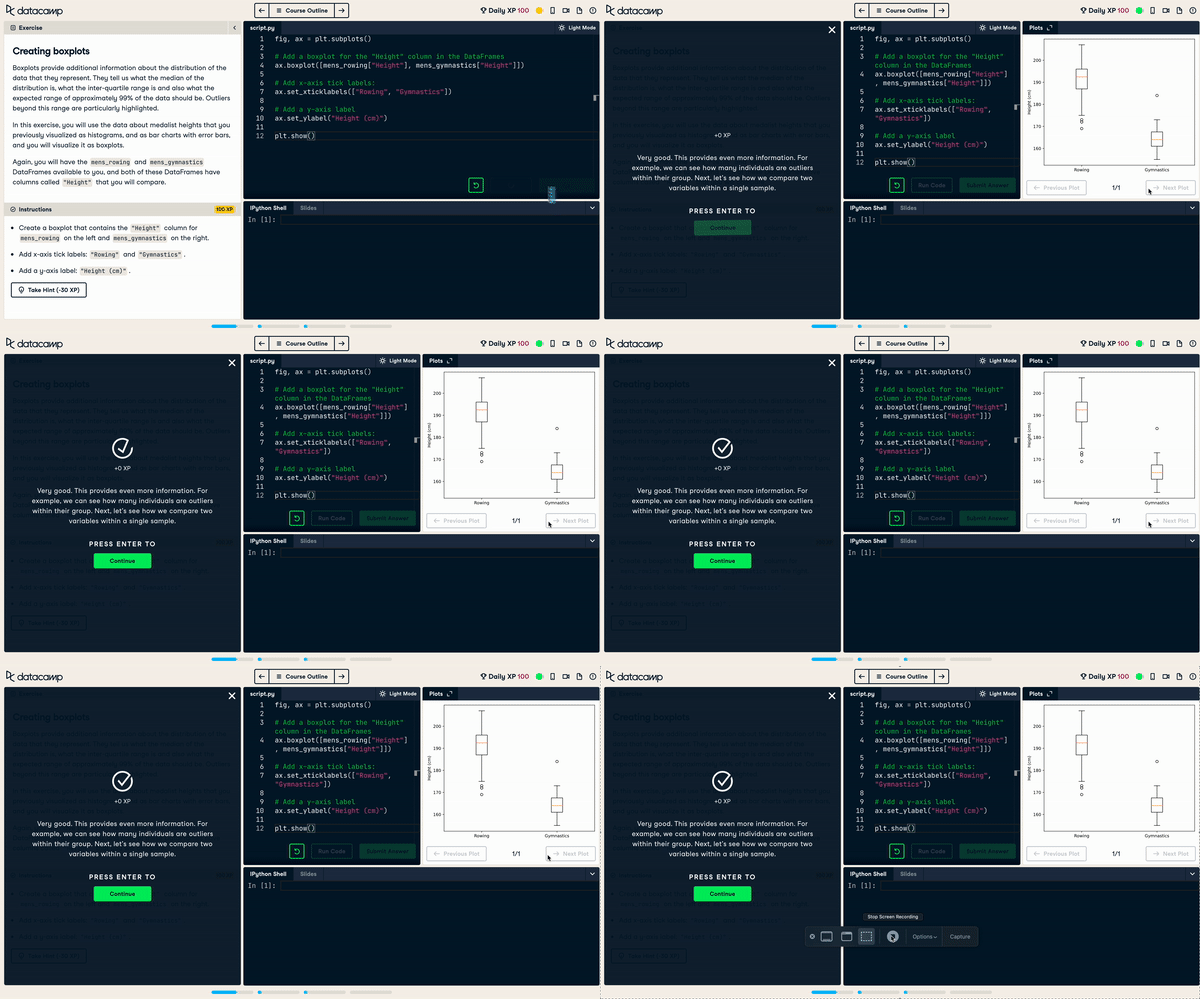
Best for: full, code-level control over static charts in Python.
Learn it with DataCamp: Introduction to Data Visualization with Matplotlib.
11. Seaborn
Seaborn sits on top of matplotlib and makes attractive statistical charts far quicker to produce. Its high-level interface builds plots in a few lines and looks good by default, which is why analysts reach for it over raw matplotlib for statistical work. It offers less fine-grained customization, and complex tweaks still send you back to matplotlib.
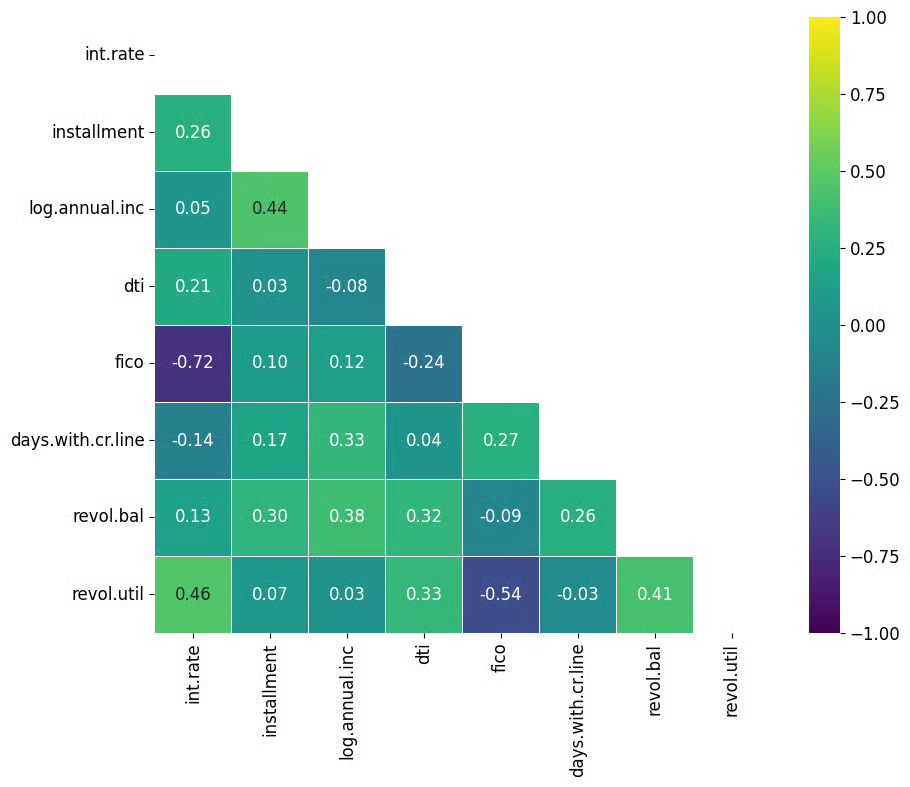
Best for: quick, good-looking statistical charts in Python.
Learn it with DataCamp: Introduction to Data Visualization with Seaborn.
12. Bokeh
Bokeh is the Python library to use when you need interactivity, not static images. It builds interactive plots that respond to the user and embeds them in web browsers, and it can scale up to dashboards with streaming data. Combining Python and JavaScript can get awkward, and its plot-design flexibility is narrower than matplotlib's.
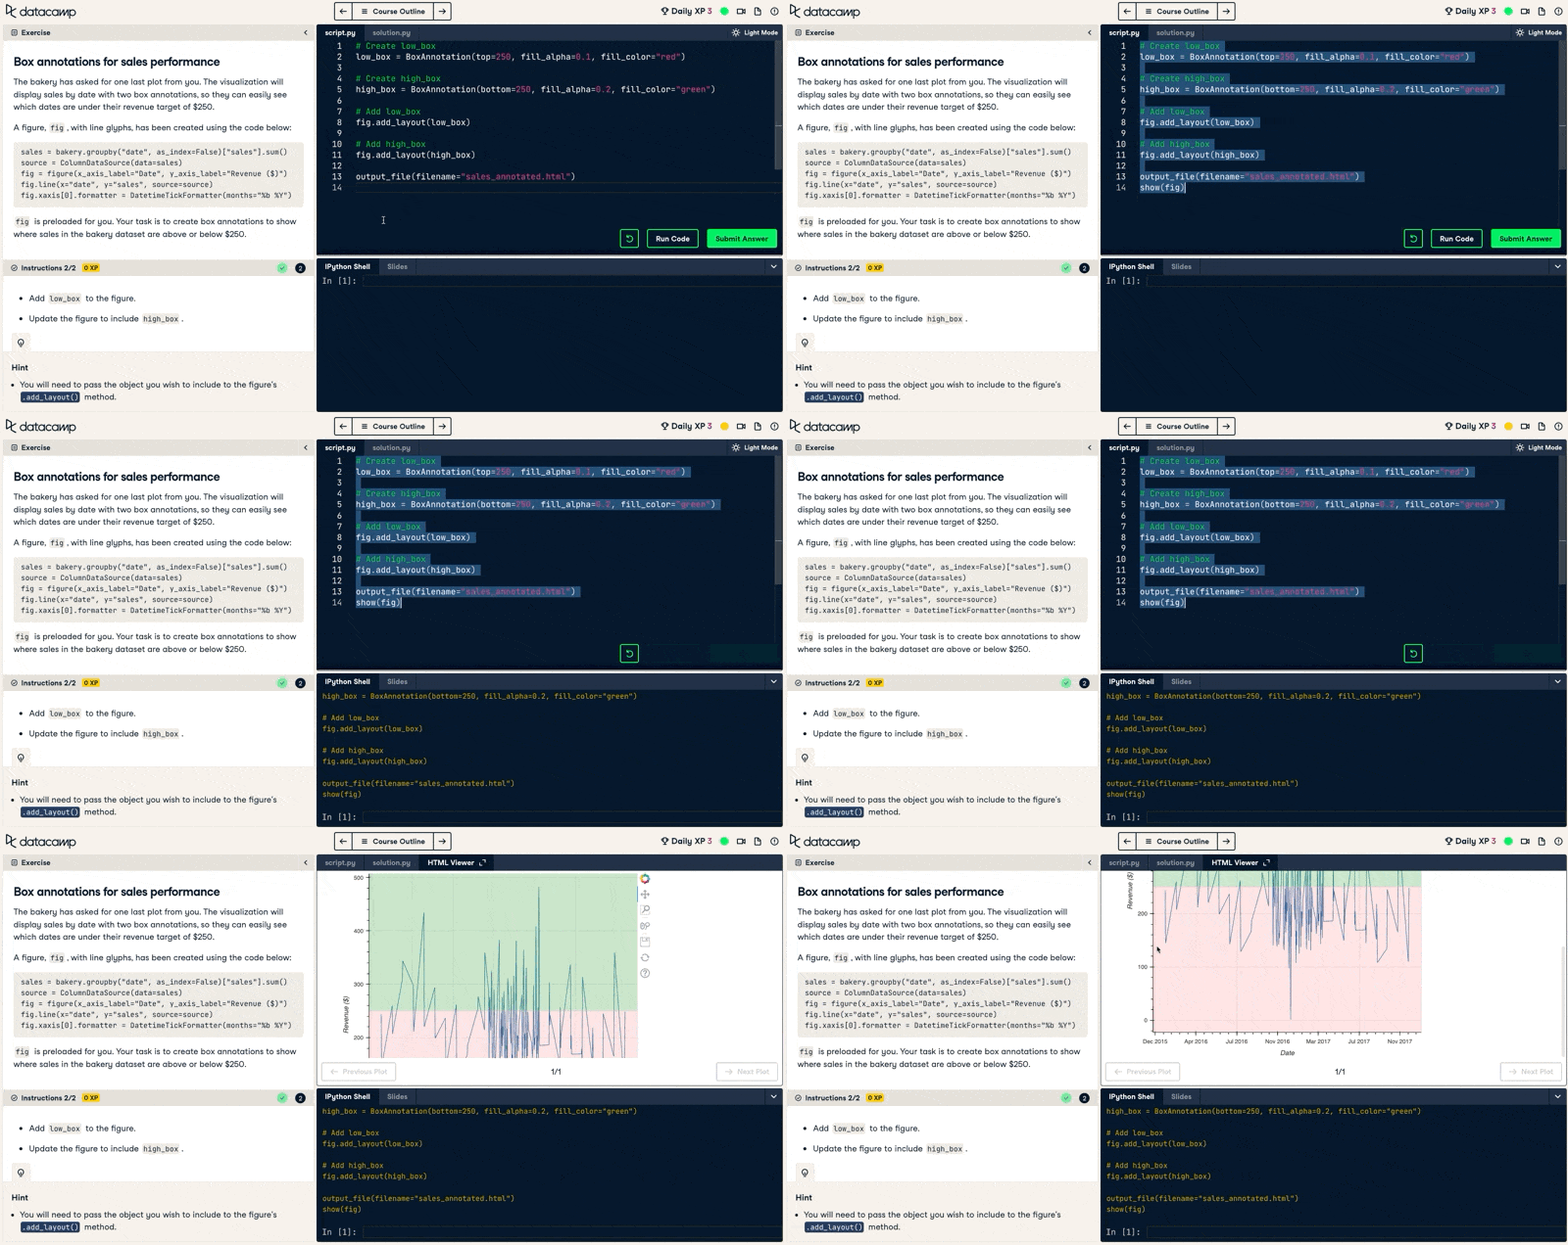
Best for: interactive, browser-embedded plots built in Python.
Learn it with DataCamp: Interactive Data Visualization with Bokeh.
R Libraries for Custom Data Visualization
If you work in R, these three cover most of what you will need, from publication-quality statistical charts to interactive maps.
13. ggplot2
ggplot2 is R's most-used visualization package and the go-to for flexible, professional plots. Created by Hadley Wickham in 2007 and included in the tidyverse, it is built on the grammar of graphics, so you specify each component of a chart and combine them with a consistent syntax. It can be slower than other R packages and its syntax differs from base R, which trips up some beginners.
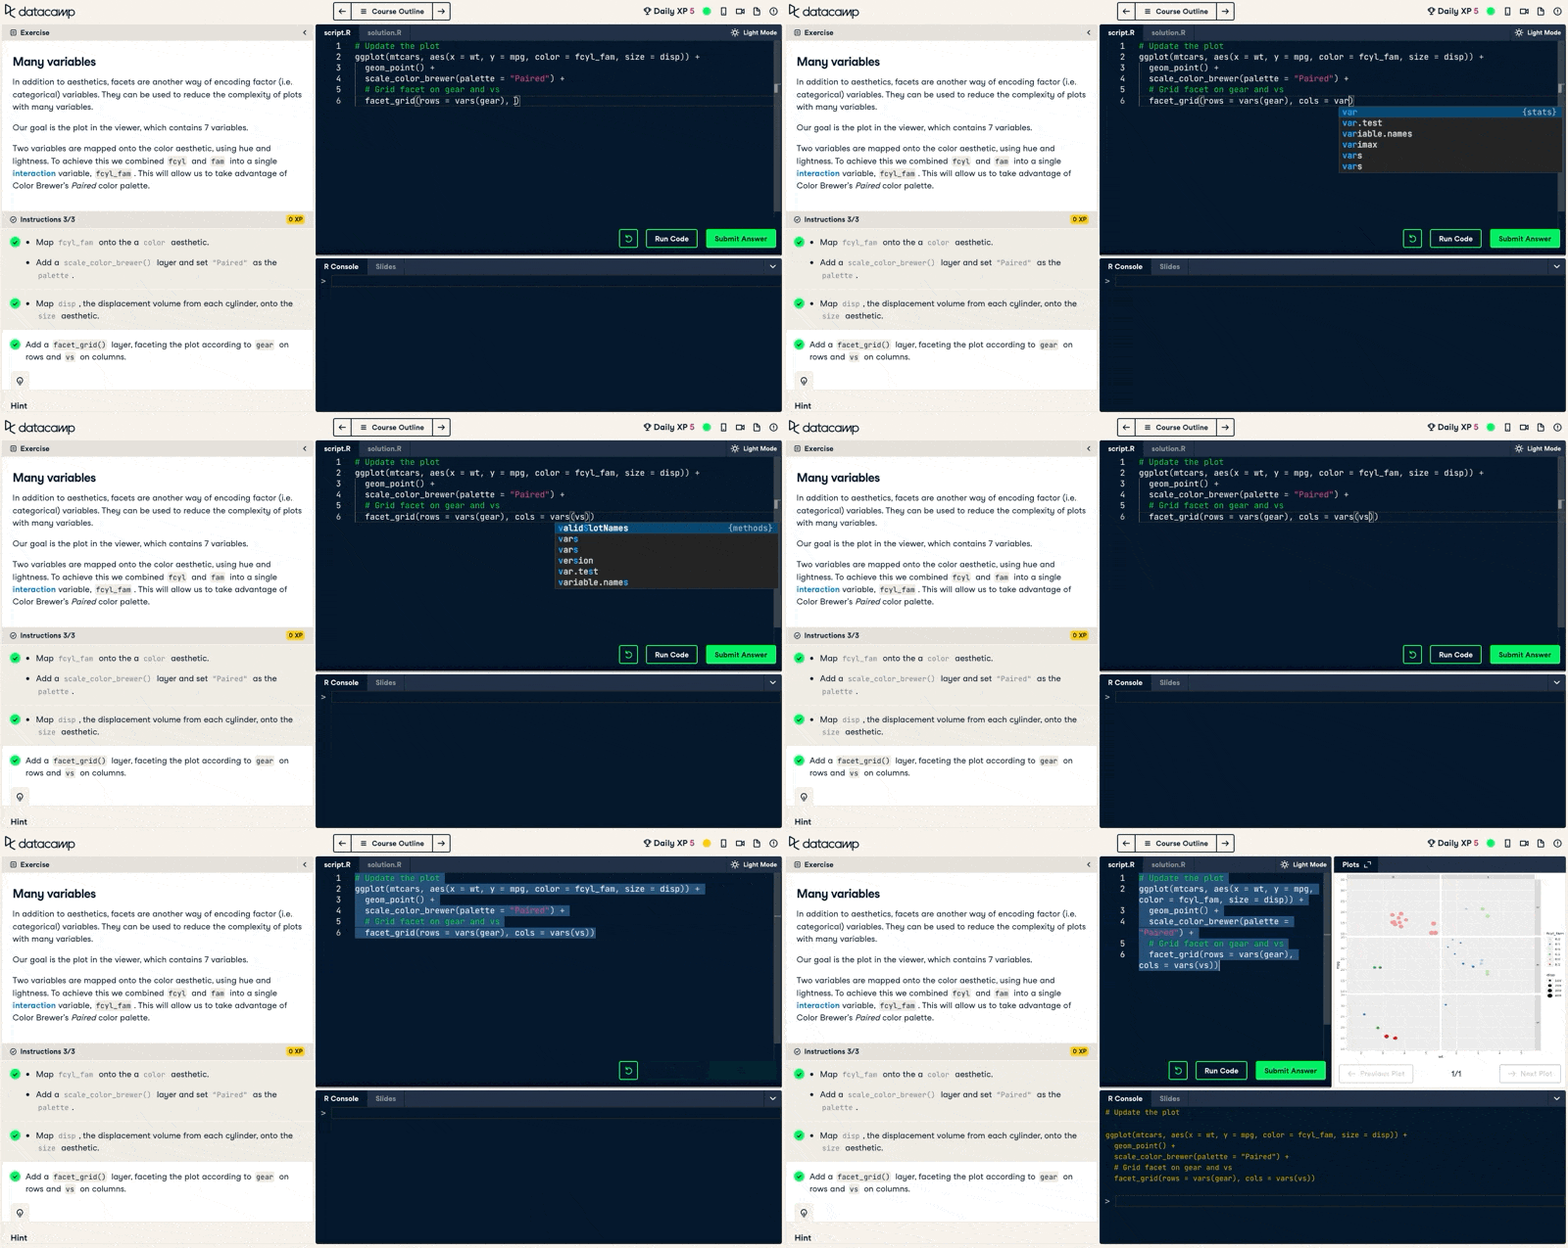
Best for: publication-quality statistical charts in R.
Learn it with DataCamp: Introduction to Data Visualization with ggplot2 and the intermediate follow-up.
14. Plotly
Plotly is the standard library for interactive, publication-quality graphs in R, and it works in Python, Julia, and MATLAB too. It uses a simple syntax but renders through JavaScript, so charts look right in modern web browsers. On the community version your visualizations are always public, and the palette and styling options are narrower than some competitors.
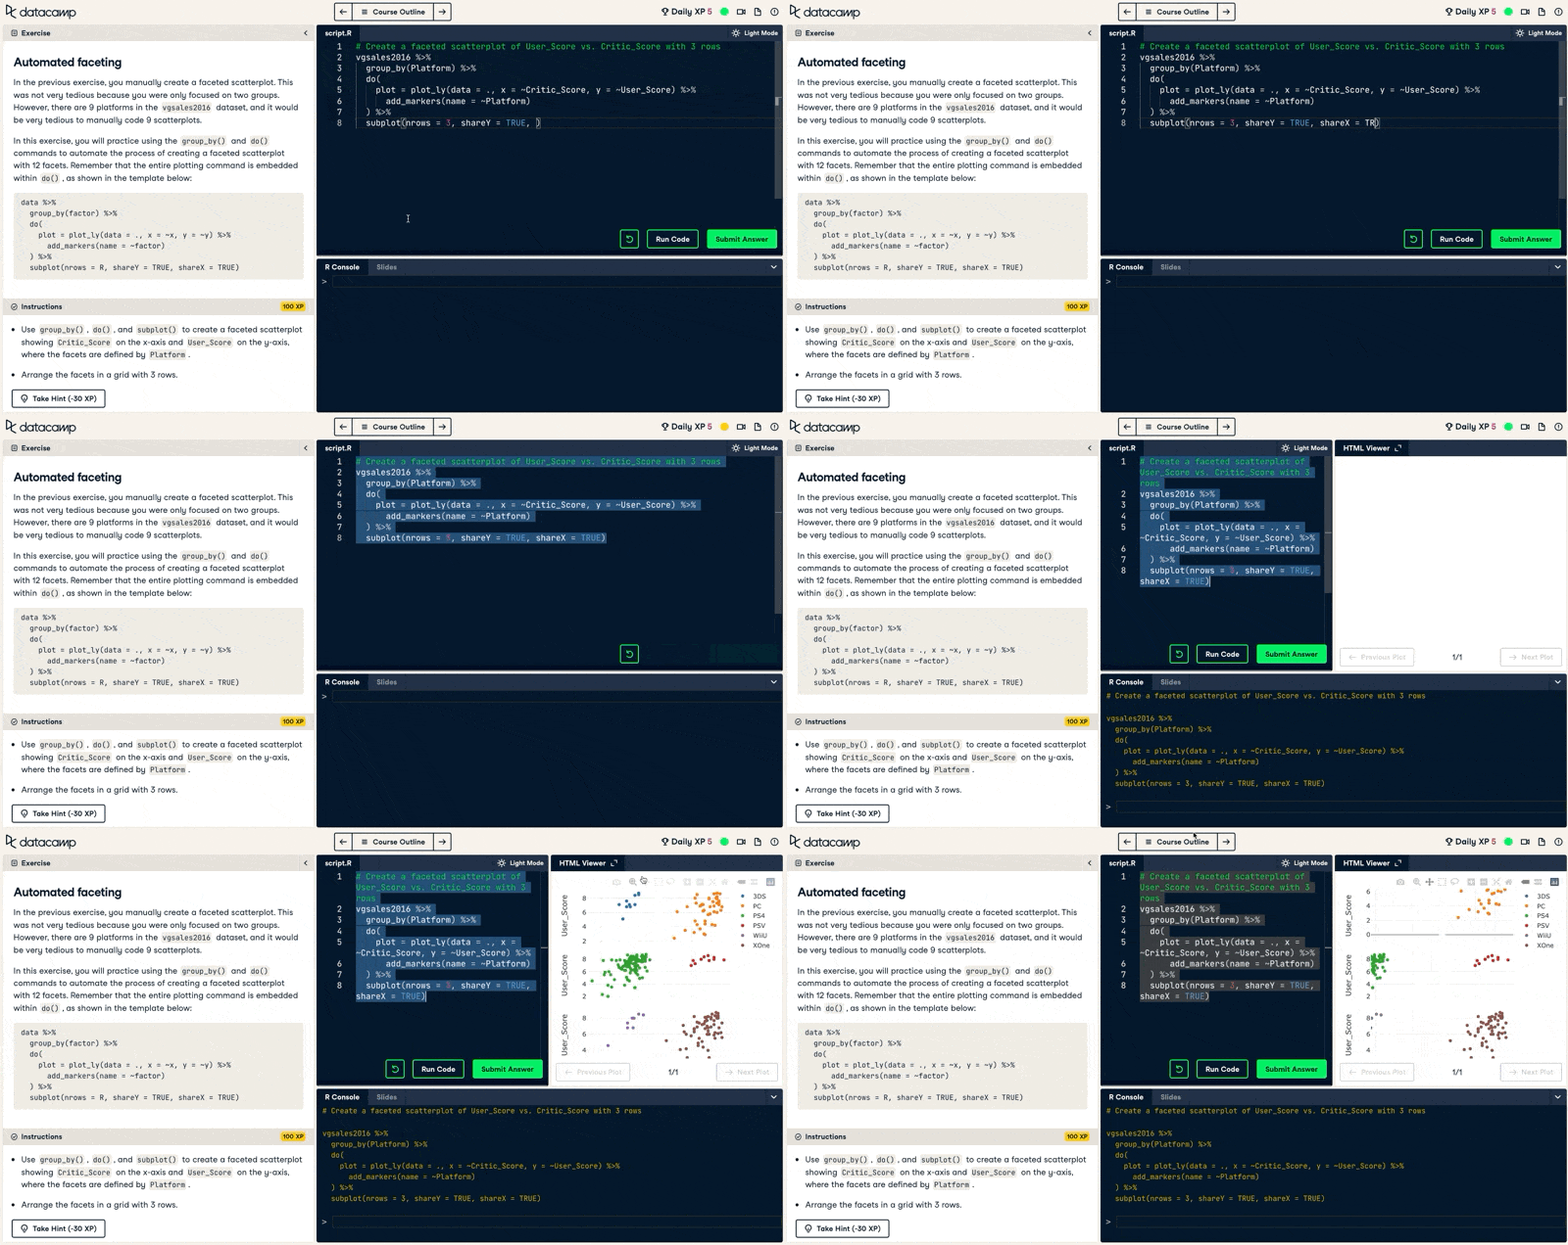
Best for: interactive charts you want to publish online, in R or Python.
Learn it with DataCamp: Introduction to Data Visualization with Plotly in Python.
15. Leaflet
Leaflet is the tool for interactive maps in R. Originally a JavaScript library used by The New York Times and Mapbox, the R package builds attractive web maps from spatial data and embeds them in R Markdown documents and Shiny apps. It has its own syntax to learn, and its static maps are not as clean as ggplot2's.
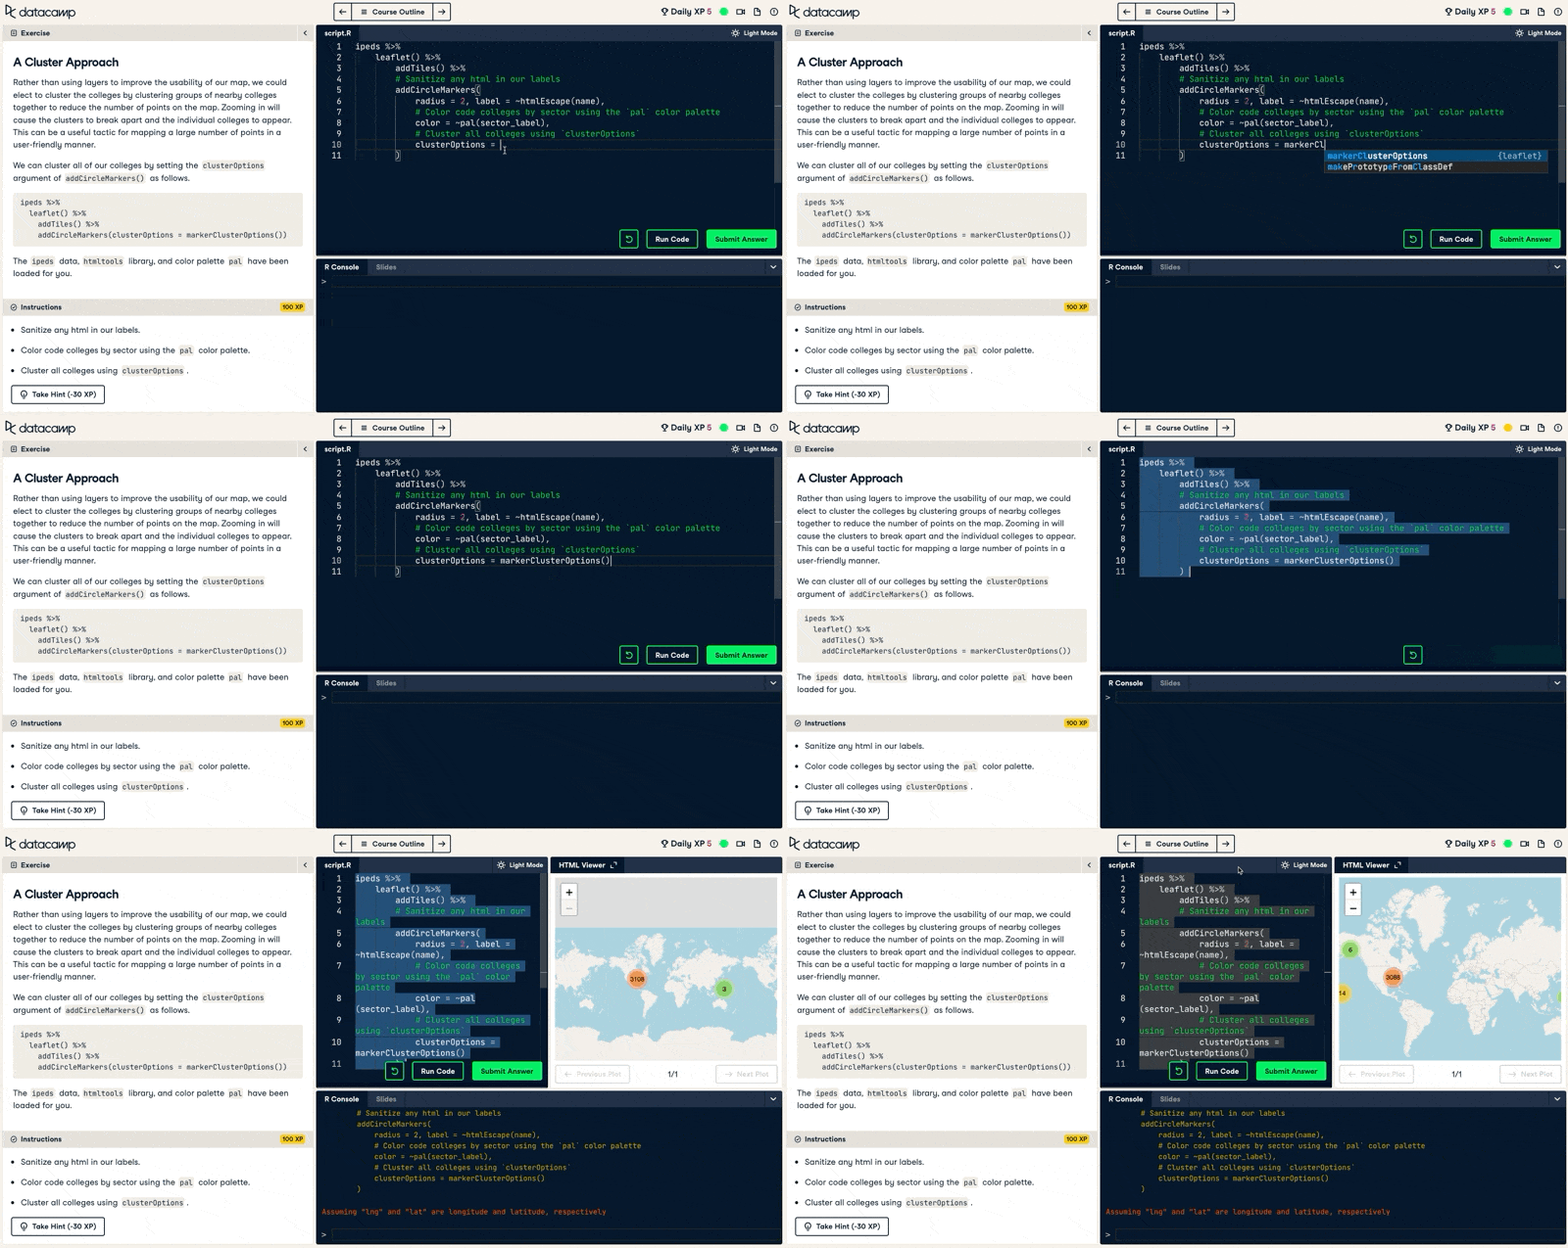
Best for: interactive web maps built from spatial data in R.
Learn it with DataCamp: Interactive Maps with leaflet in R.
Comparison Table
Here are all 15 tools side by side, sorted from the dashboard and reporting tools most analysts should learn first down to the code libraries you only need for custom work.
| Tool | Type | Coding needed? | Cost | Best for |
|---|---|---|---|---|
| Power BI | BI dashboard | No | Free Desktop; $14/user/mo Pro | Business dashboards in a Microsoft shop |
| Tableau | BI dashboard | No | Free (Public); $75/user/mo Creator | Deep interactive dashboards |
| Qlik Sense | BI dashboard | No | Paid (above Power BI) | Associative self-service analytics |
| Sigma | BI dashboard | No | Paid | Live dashboards on cloud warehouses |
| Looker Studio | BI dashboard | No | Free | Marketing and Google-data dashboards |
| Microsoft Excel | Spreadsheet | No | Microsoft 365 subscription | Quick dashboards on spreadsheet data |
| Datawrapper | No-code web charts | No | Free tier; paid plans | Data journalism and web charts |
| Google Charts | No-code web charts | Some JS | Free | Charts embedded on websites |
| RAWGraphs | No-code web charts | No | Free | Fast one-off charts, no sign-up |
| Matplotlib | Python library | Yes | Free | Full control over static charts |
| Seaborn | Python library | Yes | Free | Quick statistical charts |
| Bokeh | Python library | Yes | Free | Interactive browser plots |
| ggplot2 | R library | Yes | Free | Publication-quality R charts |
| Plotly | Python/R library | Yes | Free tier | Interactive charts online |
| Leaflet | R library | Yes | Free | Interactive maps |
Final Thoughts
For an aspiring analyst who needs to build dashboards for business reporting, learn Power BI first. It is free to start, it is what most companies use for internal reporting, and the PL-300 certification gives you a credential to show for it. If your organization runs on Salesforce or you want the deepest interactive analytics, learn Tableau instead, and practice for free on Tableau Public.
The Python and R libraries near the bottom of this list are worth learning later, once you want chart control that no-code tools can't give you. They are the wrong place to start if your goal this quarter is a working business dashboard.
Whichever tool you pick, the fastest way in is a hands-on course where you build real visualizations rather than watch them. Our guide to the best interactive data visualization courses maps out a learning path, our dashboard design best practices cover what separates a good dashboard from a cluttered one, and our Understanding Data Visualization course teaches the fundamentals with no coding involved.
Data Visualization Tools FAQs
What is the best data visualization tool for building business dashboards?
For most analysts, Power BI is the best tool for business dashboards, especially in companies that already use Microsoft 365. Tableau is the stronger choice if you want deeper interactive analytics or work outside the Microsoft ecosystem. Both are no-code, so you do not need programming to get started.
Do I need to know how to code to build dashboards?
No. Power BI, Tableau, Looker Studio, and Excel are all no-code tools that build dashboards through a visual interface. You only need Python or R libraries like Matplotlib or ggplot2 when you want custom charts that a BI tool can't produce.
Is Power BI or Tableau better for business reporting?
Power BI is usually better for internal business reporting because it is cheaper, at $14 per user per month versus $75 for Tableau Creator, and it connects directly to Excel and Teams. Tableau wins on visualization depth and handling very large datasets. For a first job in analytics, Power BI is the safer bet.
What is the easiest data visualization tool to learn?
Excel is the easiest starting point because most analysts already know the basics, and PivotCharts turn that knowledge into dashboards quickly. Among dedicated BI tools, Power BI and Looker Studio have the gentlest learning curves. A structured course will get you to a working dashboard faster than trial and error.
Is Looker Studio good for business dashboards?
Looker Studio is a good, free option for dashboards built on Google data such as Google Analytics 4, Google Sheets, and BigQuery. It is less suited to heavy data modeling or non-Google sources, where Power BI or Tableau do more. For marketing and web reporting on a budget, it is hard to beat.

I am a freelance data analyst, collaborating with companies and organisations worldwide in data science projects. I am also a data science instructor with 2+ experience. I regularly write data-science-related articles in English and Spanish, some of which have been published on established websites such as DataCamp, Towards Data Science and Analytics Vidhya As a data scientist with a background in political science and law, my goal is to work at the interplay of public policy, law and technology, leveraging the power of ideas to advance innovative solutions and narratives that can help us address urgent challenges, namely the climate crisis. I consider myself a self-taught person, a constant learner, and a firm supporter of multidisciplinary. It is never too late to learn new things.


Data visualization is a must-have skill across data roles, from data analysts working on dashboards and reports to data stewards explaining how the company's data warehouse is organized. Data visualization is also a central pillar of data storytelling, an approach that advocates for using visuals, narrative, and data to turn data insights into action.
If you are an aspiring analyst who needs to build a dashboard for a business report, the short answer is Power BI. It is free to start, it is what most companies already use for internal reporting, and it gets you to an interactive dashboard in hours rather than weeks. Tableau is the main alternative if you want deeper visual analytics or work outside the Microsoft ecosystem.
This guide covers 15 data visualization tools, and it leads with the business intelligence tools that fit dashboard and reporting work, then no-code chart makers, and last the Python and R libraries such as Matplotlib and ggplot2, which give you full control over custom or statistical charts once a no-code tool isn't enough. I judged each tool on its learning curve, dashboard and reporting fit, cost, and how easily you can actually learn it.
When to Choose Which Data Visualization Tool
Start here. This table maps the most common analyst situations to the tool that fits, so you can skip to the entries that matter for your work.
What an Aspiring Analyst Should Look For
No single tool is best for every job. Before you commit time to learning one, weigh it against four things that matter most for dashboard and reporting work.
The Best BI and Dashboard Tools for Business Reporting
These are the tools built for the exact job in the target query: interactive dashboards for business reporting. If you only learn one tool from this article, learn one of these.
1. Power BI
Power BI is the best choice for most analysts building business dashboards, especially in a company that already runs Microsoft 365.
Microsoft's tool connects directly to Excel, Teams, and Azure, uses Power Query for data prep and DAX for calculations, and Gartner has named it a Magic Quadrant leader in analytics platforms for over a decade. The honest limitation is DAX: it has a steep learning curve, and it is often mentioned as the main friction point for new users.
Pricing is a genuine advantage. Power BI Desktop is free for building reports on your own machine, and sharing costs $14 per user per month for Pro or $24 for Premium Per User on Microsoft's 2026 pricing. It is also the tool behind the PL-300 certification, a common goal for analysts moving into BI.
Best for: aspiring analysts building business dashboards in a Microsoft environment.
Learn it with DataCamp: Introduction to Power BI, Data Visualization in Power BI, and the Data Analyst in Power BI career track.
2. Tableau
Tableau is the strongest tool for standalone interactive dashboards and deep visual exploration, whatever your data source.
Founded at Stanford in 2003 and acquired by Salesforce in 2019, it handles large datasets and offers more visualization depth than any other BI tool, which is why it wins on design-heavy analytics. The trade-off is cost: Tableau Creator runs $75 per user per month on Salesforce's published pricing, well above Power BI.
You can practice for free. Tableau Public lets you build and publish dashboards at no cost, so you can build a portfolio before your employer buys a license.
Best for: analysts who want the deepest interactive dashboards and are not tied to Microsoft.
Learn it with DataCamp: Introduction to Tableau, Data Visualization in Tableau, and the Data Analyst in Tableau career track.