In today's data-driven world, businesses can't rely on intuition alone to make critical decisions. Instead, they need to use statistical techniques like hypothesis testing to back up their actions with solid data. One popular test for this purpose is the t-test, which allows you to compare the means of two groups and determine whether they're statistically different.
But how do you apply the t-test in practice, and how do you interpret the results? In this tutorial, we'll explore these questions and more. Specifically, we'll walk you through an example scenario where you want to assess the success of a new feature a business has launched. We'll show you how to use t-tests in Python and its powerful libraries to analyze the output.
By the end of this tutorial, you'll have a solid understanding of t-tests and be able to apply them to your own data with confidence.
In this tutorial, we’ll explore the different types of t-tests – one-sample test, two-sample test, paired t-test, and welch’s test – as well as their applications and when to use them.
Terminology Explained
Before we delve deeper into the details of the t-test, let us quickly understand some of the associated terminologies that will help strengthen your conceptual grasp of this statistical test.
Hypothesis Testing
Hypothesis testing is the process of starting with an assumption or null hypothesis and attempting to find evidence to reject it. The null hypothesis represents the status quo, while the alternative hypothesis represents the opposite of the null hypothesis.
For example, we can use hypothesis testing to determine whether a new feature launched by a business receives a good customer response and is reflected in the success metric. Check out our hypothesis testing course to learn more about the subject.
P-Value
The p-value is the probability of obtaining results as extreme as the observed ones, assuming the null hypothesis is true. A small p-value indicates that the probability of obtaining the observed results is very low, given that the null hypothesis is correct.
Significance Level
The significance level, denoted by alpha, represents the probability of rejecting the null hypothesis, assuming it is true. It is also known as a Type 1 error.
Statistical Significance
Statistical significance refers to the confidence that the observed result is not due to chance. It is important to note that statistical significance does not necessarily mean practical significance, as the observed result could still be negligible in practical terms. Sampling error can also contribute to statistical significance if the sample does not accurately represent the larger population.
T-test assumptions
Understanding the assumptions of a statistical test is crucial to ensure accurate and reliable results. The t-test is no exception. Any violation of its assumptions could lead to misleading conclusions, which would be counterproductive. Let's explore the four assumptions of the t-test in detail:
Property of Independence
Firstly, the property of independence states that observations are not influenced by any implicit factor in the data and are not correlated over time. To ensure independence, various techniques can be applied to deal with dependent data, as explained by the University of Texas at Austin.
Identically Distributed
Secondly, the presence of outliers, or anomalous data records, can impact the lower t-statistic value and lead to increased variance in the data, affecting the probability of rejecting the null hypothesis. Therefore, it's crucial to identify and understand the underlying reasons for anomalous behavior to determine whether it is legitimate or erroneous data. Consulting a domain expert can help in comprehending the data's true behavior.
Normally Distributed
Thirdly, the t-test is only valid for normally distributed data. Skewed data may lead to incorrect rejection of the null hypothesis. However, it's difficult to test for normal distribution with limited data points. In such cases, nonparametric tests that do not assume the data's distribution can be used, or data transformation can be performed as a corrective measure to achieve normality.cases, it is suggested to either use a nonparametric test (which does not make a distributional assumption of data) or perform data transformation as a corrective measure toward normality.
Equal Variances
Finally, the two populations being compared should have equal variances for the t-test to hold. This can be tested graphically using a Q-Q plot.
Now that we have a better understanding of the t-test assumptions, let's explore different types of t-tests through a Python example. By the end of this tutorial, you will have the necessary knowledge to perform t-tests and interpret their results with confidence.
One-sample t-test
The one-sample t-test is a statistical hypothesis test that helps determine if an unknown population mean (mu) does not equal a claimed value.

Where,
x = sample mean
𝝁 = population mean
S = sample standard deviation
n = number of examples in the sample
t = t-statistic
Let’s understand this by using an example. A company claims to produce ball bearings of 10 cm diameter (null hypothesis), and you decide to audit if that is true. You collect 21 ball bearings from multiple shops around the city and measure their diameter. You must determine if the company’s claim is false (alternate hypothesis) based on the measurements.
The test is designed as follows:
Null Hypothesis: H0 : x = 𝝁
Alternate Hypothesis: Ha : x ≠ 𝝁
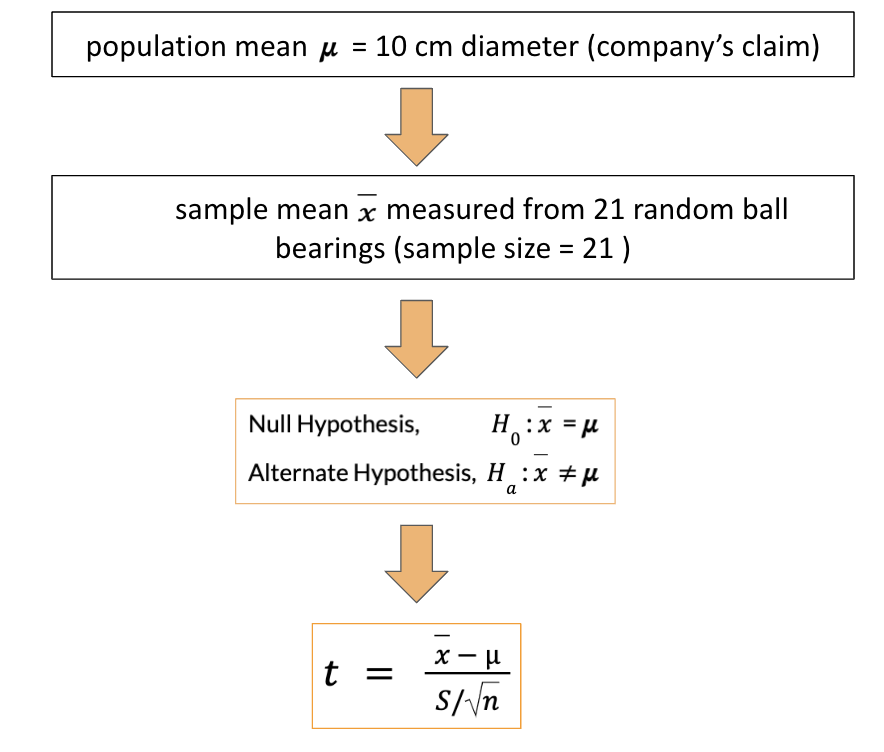
To declare the claims as false, you need to statistically prove that the measurements from the sample of bearings are different from the 10 cm claimed by the company. As the sample size is 21 (which is less than 30), we use a t-test. Here the sample mean is 11 cm, and the standard deviation is 1 cm.
One-sample t-test example in Python
Let us learn how to conduct a one-sample t-test in Python using the scipy.stats.ttest_1samp() function.
import numpy as np
from scipy import stats

# Population Mean
mu = 10

# Sample Size
N1 = 21

# Degrees of freedom
dof = N1 - 1

# Generate a random sample with mean = 11 and standard deviation = 1
x = np.random.randn(N1) + 11

# Using the Stats library, compute t-statistic and p-value
t_stat, p_val = stats.ttest_1samp(a=x, popmean = mu)
print("t-statistic = " + str(t_stat))
print("p-value = " + str(p_val))
t-statistic = 4.689539773390642
p-value = 0.0001407967502139183
Interpretation of the test results
The value of t-statistic comes out to be 4.69 which seems to be very far from the mean of zero in a t-distribution. To quantify such extreme value, we refer to a p-value (which is introduced in the terminology section). The p-value is less than the default significance level of 0.05, which indicates that the probability of such an extreme outcome is close to zero and that the null hypothesis can be rejected.
Note that the significance level is set at the beginning of the experiment.
A different approach
Let’s perform the one sample t-test without the ttest_1samp() function. The t-statistic, in this case, is defined by the difference between sample and population means divided by the standard error, as discussed in the previous section.
- First, compute the sample mean (x_bar)
- Next, compute the sample standard deviation with the degree of freedom of one (it represents the standard deviation of the sample).
- Compute the standard error by dividing the standard deviation by the square root of the sample size.
- Use the one-sample t-statistic formula as explained earlier.
- Compute the p-value to establish the significance of the t-statistic.
# Sample Mean
x_bar = x.mean()

# Standard Deviation
std = np.std(x, ddof=1)

# Standard Error
ste = std/np.sqrt(N1)

# Calculating the T-Statistics
t_stat = (x_bar - mu) / ste

# p-value of the t-statistic
p_val = 2*(1 - stats.t.cdf(abs(t_stat), df = dof))
print("t-statistic = " + str(t_stat))
print("p-value = " + str(p_val))
t-statistic = 4.689539773390642
p-value = 0.0001407967502139183How to Perform Two-sample t-test in Python
Let’s extend our example by assuming that the company sets up another factory to produce identical ball bearings. We need to find out if the ball bearings from the two factories are of different sizes. For such a scenario, we use the two-sample test. Here the t-statistic is defined as below.
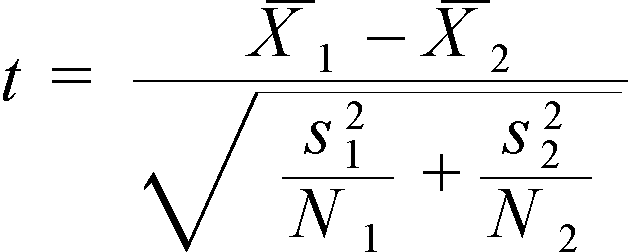
Where,
X1= first sample mean
X2 = second sample mean
S1 = first sample standard deviation
S2 = second sample standard deviation
N1 = first sample size
N2 = second sample size
Two-sample t-test example in Python
Let’s consider that the first factory shares 21 samples of ball bearings where the mean diameter of the sample comes out to be 10.5 cm. On the other hand, the second factory shares 25 samples with a mean diameter of 9.5 cm. Both have a standard deviation of 1 cm.
# Sample Sizes
N1, N2 = 21, 25

# Degrees of freedom
dof = min(N1,N2) - 1

# Gaussian distributed data with mean = 10.5 and var = 1
x = np.random.randn(N1) + 10.5

# Gaussian distributed data with mean = 9.5 and var = 1
y = np.random.randn(N2) + 9.5

## Using the internal function from SciPy Package
t_stat, p_val = stats.ttest_ind(x, y)
print("t-statistic = " + str(t_stat))
print("p-value = " + str(p_val))
t-statistic = 3.18913308431476
p-value = 0.0026296199823557754Interpretation of the test results
Referring to the p-value of 0.0026 which is less than the significance level of 0.05, we reject the null hypothesis stating that the bearings from the two factories are not identical.
How to Perform Paired t-test in Python
Upon sharing these results with the company, it decides to improve its manufacturing technology by introducing a new casting machine. It starts this pilot from one of the factories and conducts a test to identify if the new casting machine leads to a change in the diameter of the bearings by comparing two samples of 25 bearings – one before the new machine was introduced and the other sample after it.
The mean diameter comes out to be 10.5cm and 9.9cm, respectively.
Paired t-test example in Python
Let’s perform a paired t-test to verify if the change is statistically significant.
# Sample Sizes
N = 25

# Degrees of freedom
dof = N - 1

# Gaussian distributed data with mean = 10.5 and var = 1
x = np.random.randn(N) + 10.5

# Gaussian distributed data with mean = 9.9 and var = 1
y = np.random.randn(N) + 9.9

t_stat, p_val = stats.ttest_rel(x,y)
print("t-statistic = " + str(t_stat))
print("p-value = " + str(p_val))
t-statistic = 3.446152658909739
p-value = 0.0021043953630465787Interpretation of the test results
The low p-value indicates that the null hypothesis is rejected, i.e., there is no change in the diameter of the ball bearings after introducing the new casting machine.
Caveats of a paired t-test
The assumptions paired t-test are valid on the differences of the pair and not on the original observations. Hence, it is important to ensure that the differences between the pairs are symmetrically distributed and do not have outliers among them.
How to Perform Welch's t-test in Python
After a successful pilot from the new casting machine at one factory, the company wants to try another pilot at its second factory with a new rubbing machine. This machine is known to produce highly accurate ball bearings but is affected by temperature changes and power fluctuations. The company needs to identify if the ball bearings from the two factories are different by comparing 21 samples from the first factory and 25 from the second factory.
Welch’s t-test example in Python
The mean diameter of bearings from the first factory turns out to be 9.9 cm with a standard deviation of 1 cm, whereas the mean diameter from the second factory turns out to be 10 cm with a standard deviation of 3 cm. As the standard deviation of the two samples is different, we will use Welch’s t-test.
# Sample Sizes
N1, N2 = 21, 25

# Degrees of freedom
dof = min(N1,N2) - 1

# Gaussian distributed data with mean = 9.9 and var = 1
x = np.random.randn(N1) + 9.9

# Gaussian distributed data with mean = 10 and var = 3
y = 3*np.random.randn(N2) + 10

## Using SciPy Package
t_stat, p_val = stats.ttest_ind(x, y, equal_var = False)
print("t-statistic = " + str(t_stat))
print("p-value = " + str(p_val))
t-statistic = 1.3828843424092643
p-value = 0.17753505304053804Interpretation of the test results
The observed p-value is greater than the significance level of 0.05 which indicates that we fail to reject the null hypothesis implying that the bearings from the two factories are identical. We can not be sure of the results due to the high standard deviation of the samples from the second factory; hence we will need to collect more samples to perform the z-test.
Caveats of Welch's t-test
Unlike other t-tests, Welch's t-test is applicable for unequal population variances
Conclusion
Data has the power to uncover the true underlying phenomenon impacting business decisions only if interrogated rightly. It requires a robust understanding of different statistical tests to know which one to apply and when. This tutorial focuses on t-tests and explains their underlying assumptions, such as independent and identically distributed observations and normal distribution.
Besides giving a quick primer on hypothesis testing, this tutorial also gives a comprehensive view of different types of t-tests with the help of an example. You are highly encouraged to practice conducting a t-test using python and evaluate which one should be used to assess the statistical significance of your experiment.