Course
Introduction to Tableau
6 hr
319.7K
So, you've hit a milestone in your Tableau learning and have discovered LOD (Level of Detail) expressions in Tableau. That's great!
LOD expressions are an amazing way to create more advanced calculations and complex data visualizations. They help to scope out your data analysis better by specifying the level of detail you want to focus on.
To help you understand the logic behind these expressions and when to use them, I've put together this simple introduction guide to LOD in Tableau.
In Tableau, LOD (Level of Detail) expressions are used to compute values at different levels in a visualization. These expressions allow for more granular control over how data is aggregated and displayed in a visualization.
To put this simply, LOD expressions provide a way to isolate specific levels of data in a visualization, regardless of the other filters or dimensions present. This allows for more precise and flexible analysis of data.
Here’s a sample syntax:
{FIXED [Dimension]: AGG([Measure])}For example, suppose we have a dataset that contains sales information for different regions and product categories. We want to create a bar chart that shows the total sales for each region, but we also want to see the combined average sales for all regions.
This is where LOD expressions come in handy.
With an LOD expression, we can create a calculated field that determines the average sales for all regions, regardless of what is selected in the visualization. We can then add that to our bar chart and compare it to the total sales for each region.
This gives us a better understanding of how each region's sales compare to the overall average.
LOD expressions are important because they allow for more precise control over the level at which data is aggregated in a visualization. By default, Tableau aggregates data at the level of detail specified by the dimensions and measures in the visualization.
However, with LOD expressions, we can specify a different level of detail for our calculations, resulting in more accurate and meaningful insights.
There are three types of LOD expressions in Tableau: FIXED, INCLUDE, and EXCLUDE. Each type allows for a different level of control over how data is aggregated.
|
Feature |
Fixed LOD |
Include LOD |
Exclude LOD |
|
Definition |
Fixed LOD expressions compute a value using the specified dimensions, without regard to the dimensions present in the view. |
Include LOD expressions allow you to compute aggregations that are more granular than the view level, including additional dimensions. |
Exclude LOD expressions enable the computation of aggregations that are less granular than the view, excluding certain dimensions. |
|
Syntax Example |
{FIXED [Dimension]: AGG([Measure])} |
{INCLUDE [Dimension]: AGG([Measure])} |
{EXCLUDE [Dimension]: AGG([Measure])} |
|
Use Case |
Use Fixed LOD for calculations that need to be constant across the entire dataset or within specific groupings defined by the fixed dimensions |
Use Include LOD when you need to include additional dimensions in your calculation that are not in the view |
Use Exclude LOD when you want to remove certain dimensions from your calculation, making it less detailed than the current view |
|
View Impact |
Independent of the view's granularity. |
Adds detail beyond what is currently in the view |
Removes detail from the current view's level of detail |
|
Relevance to Filters |
|
|
|
|
Typical Applications |
|
|
|
A FIXED expression is used to specify a specific level of detail for a calculation. It allows us to specify the exact dimensions we want to include in our calculation.
This means that even if other dimensions or filters are applied in the visualization, the calculation will remain fixed at the specified level of detail.
Here's a sample syntax of a FIXED expression:
{FIXED [Dimension]: Calculation}The INCLUDE expression allows us to include additional dimensions in our calculation while still keeping the original dimensions present in the visualization. This can be useful when we want to compare data across multiple levels of detail.
Here's a sample syntax of an INCLUDE expression:
{INCLUDE [Dimension]: Calculation}The EXCLUDE expression is used to exclude specific dimensions from a calculation while still including all other dimensions in the visualization. This can be useful when we want to focus on a specific level of detail without being influenced by other dimensions.
Here's a sample syntax of an EXCLUDE expression:
{EXCLUDE [Dimension]: Calculation}Let's explore how we can use LOD expressions in different scenarios. We'll use the Superstore dataset found within Tableau.
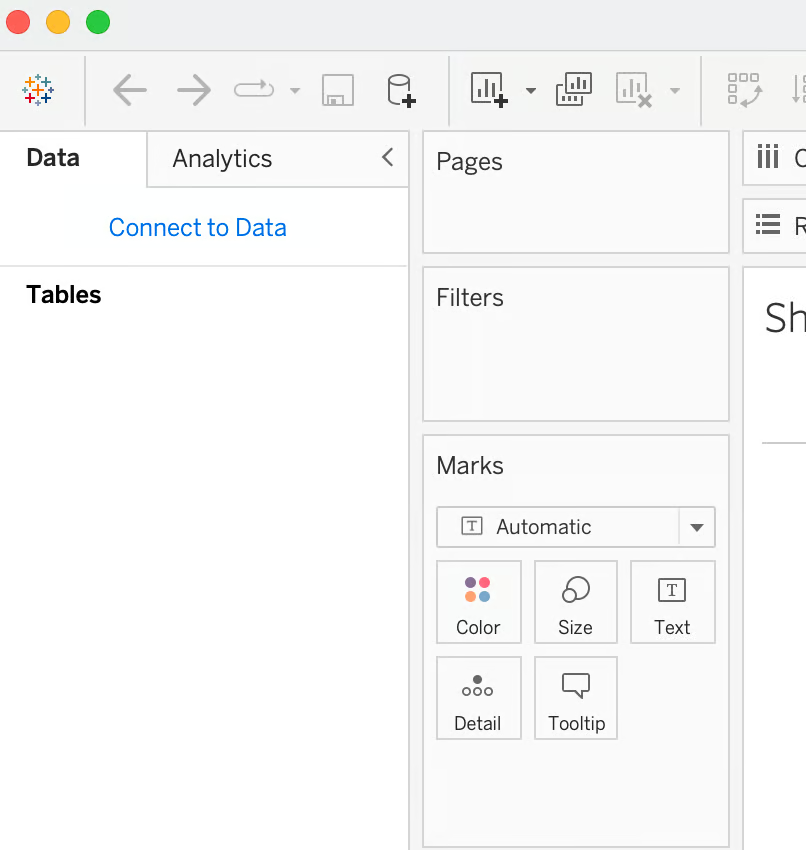
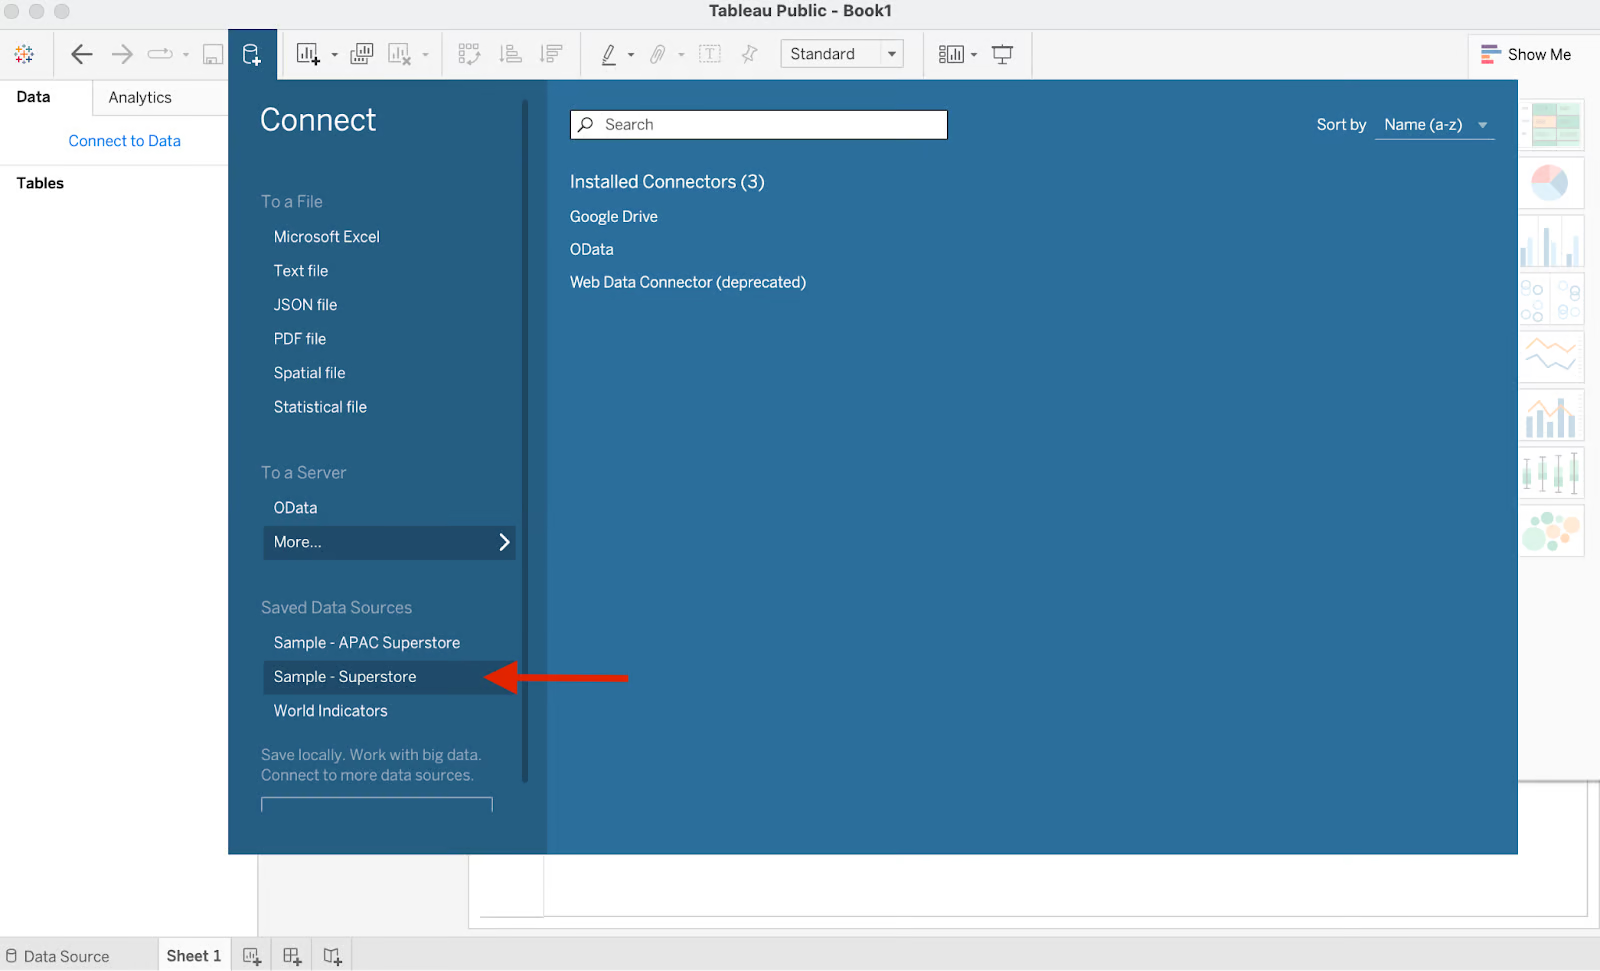
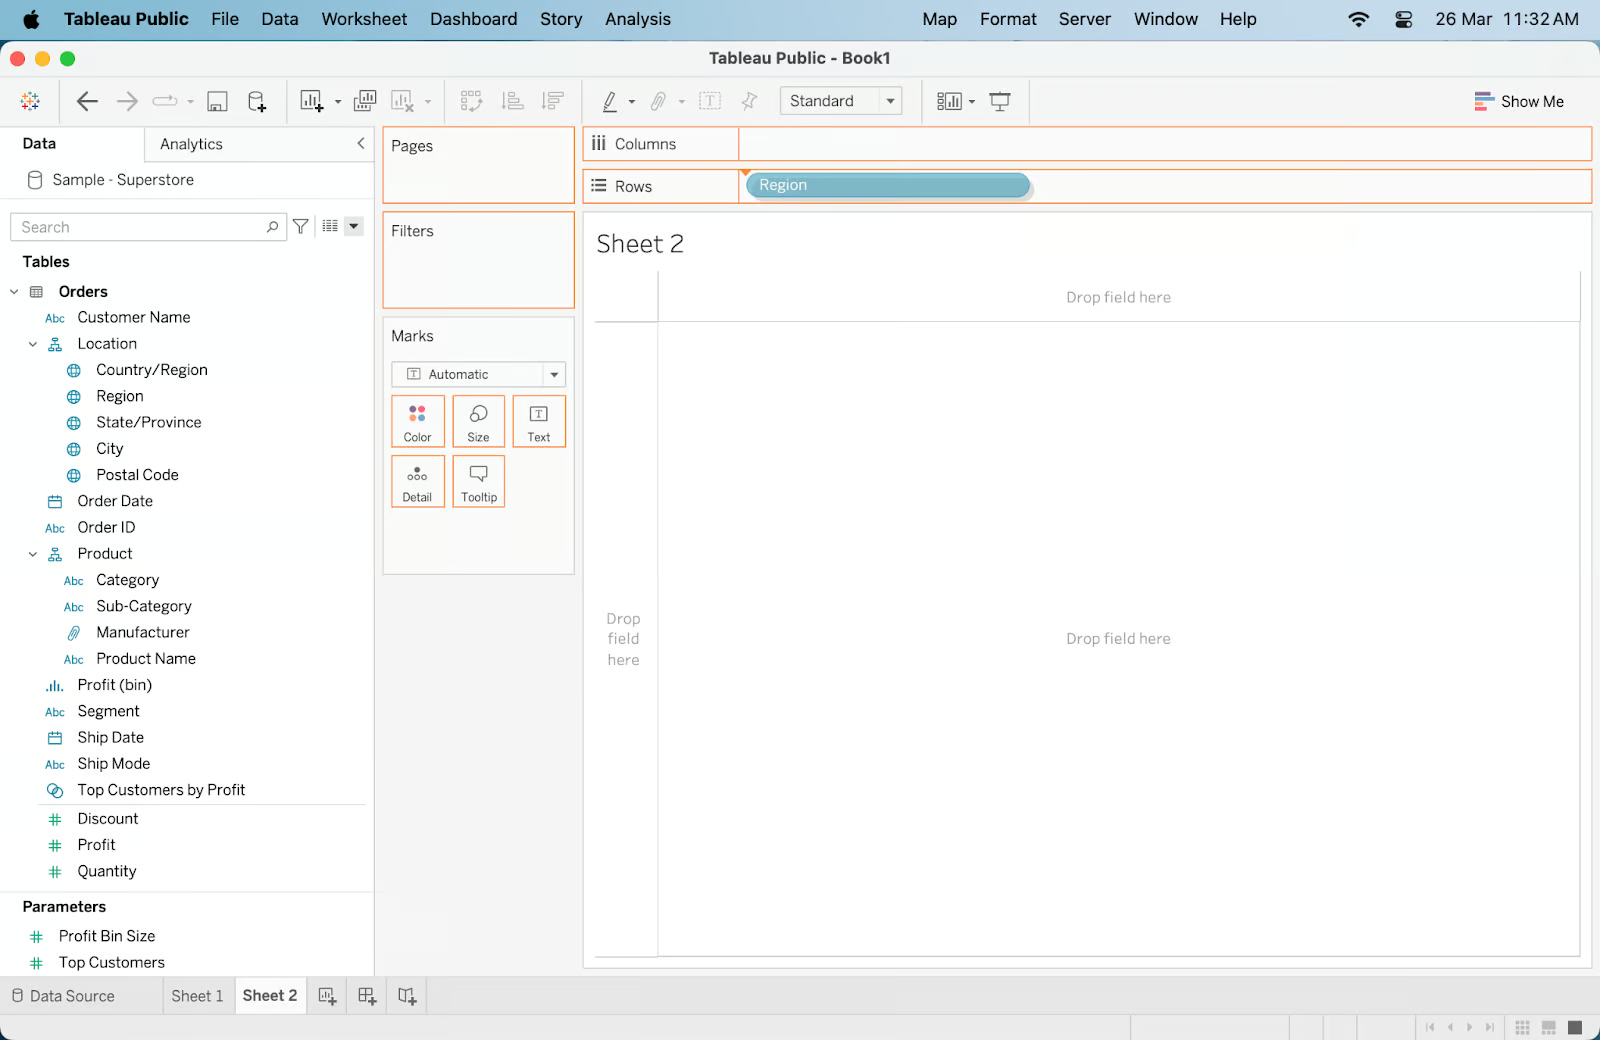
To load up this dataset, go into the main Tableau workspace and click on “Connect to Data” in the top left corner.
In the popup window that appears, click on “Sample - Superstore” under Saved Data Sources.
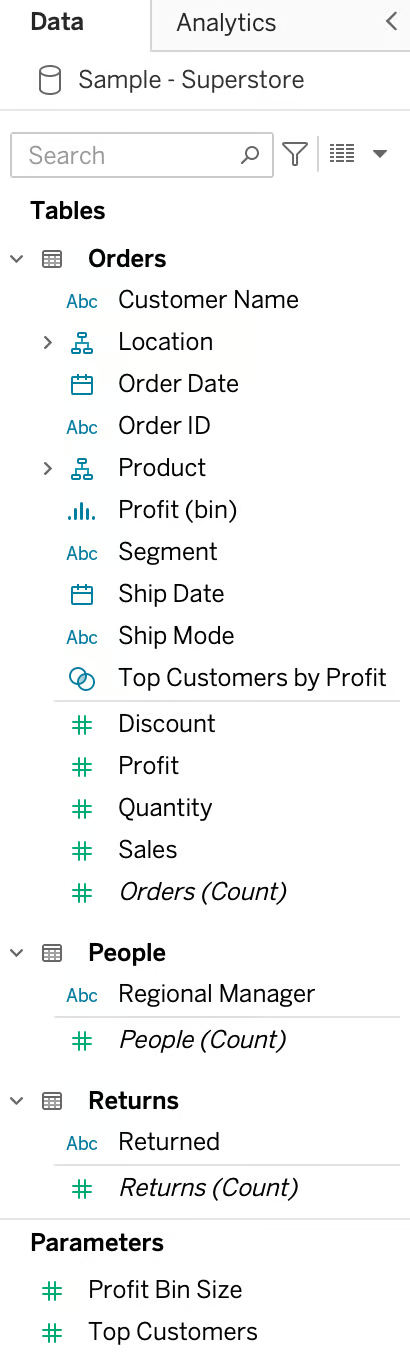
Next, check that the left panel is now populated with data from the Superstore dataset.
It should look something like this:
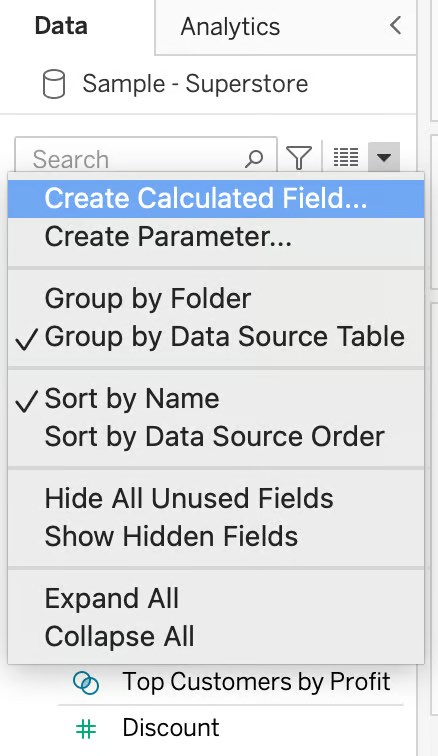
To use a LOD expression in Tableau, we first need to create a calculated field. We can do this by clicking on the dropdown arrow in the data pane followed by the "New Calculated Field" button.
Let's look at an example of how we can use each type of LOD expression to gain more insights from our data:
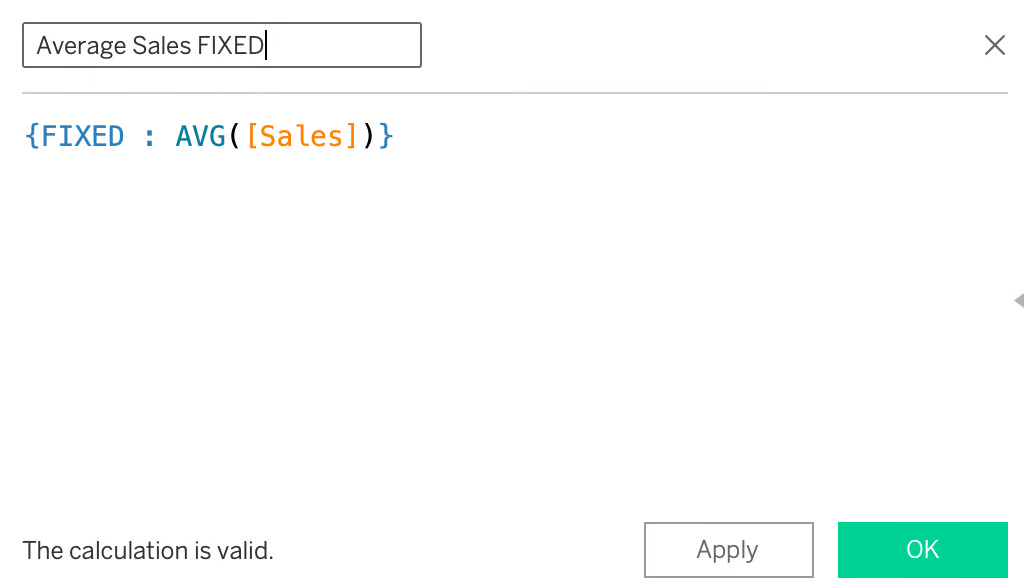
Suppose we want to compare the average sales for each region with the overall average sales. We can create a calculated field with the following formula:
{FIXED : AVG([Sales])}This will calculate the average sales for all regions, regardless of what is selected in the visualization.
We can then add this calculated field to our view and compare it to the average sales for each region.
To do that, we would simply add the Sales and Average Sales FIXED calculated fields to the "Columns" shelf, and Region to the Rows shelf.
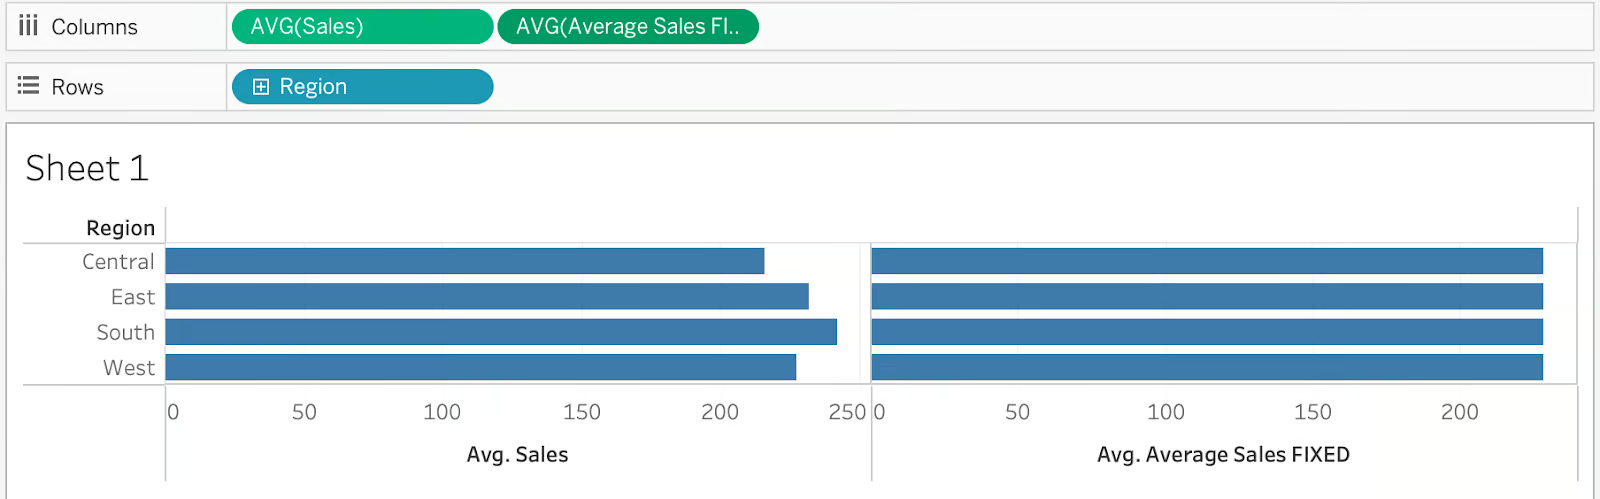
The calculated field with the FIXED LOD expression gave average sales for all regions, but the regular AVG(Sales) measure gave the average for each region.
This means that by specifying the FIXED LOD, adding any dimensions like region will not affect the value of the average sales.
Let's say we want to find the average sales per order for each region, regardless of the level of detail in our current view.
This can be particularly useful if you're visualizing data at a higher aggregation level but still want to incorporate more detailed calculations without changing the overall view.
Create a new Worksheet using the Create Worksheet button at the bottom left corner.
Navigate to the "Data" pane, select the dropdown arrow button, and select "Create Calculated Field" to open the calculation editor.
Name your calculated field something descriptive, like "Average Sales per Order INCLUDE".
Enter the following formula for an Include LOD expression:
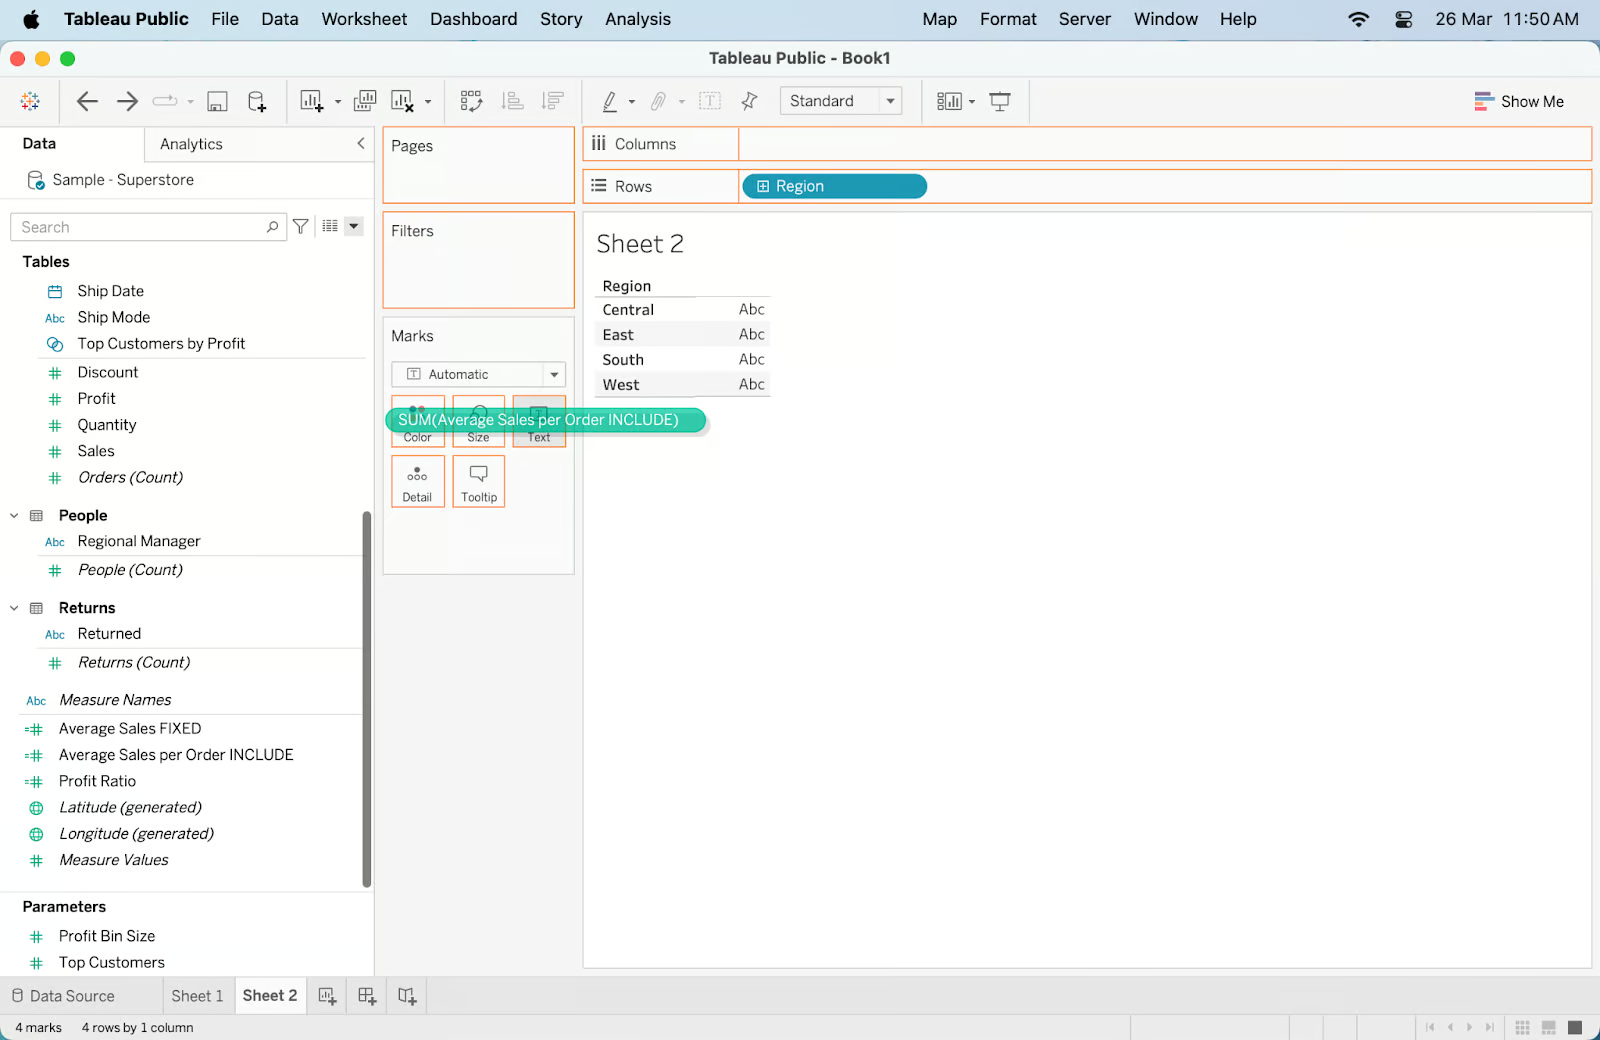
{INCLUDE [Order ID]: AVG([Sales])}It should look something like this:
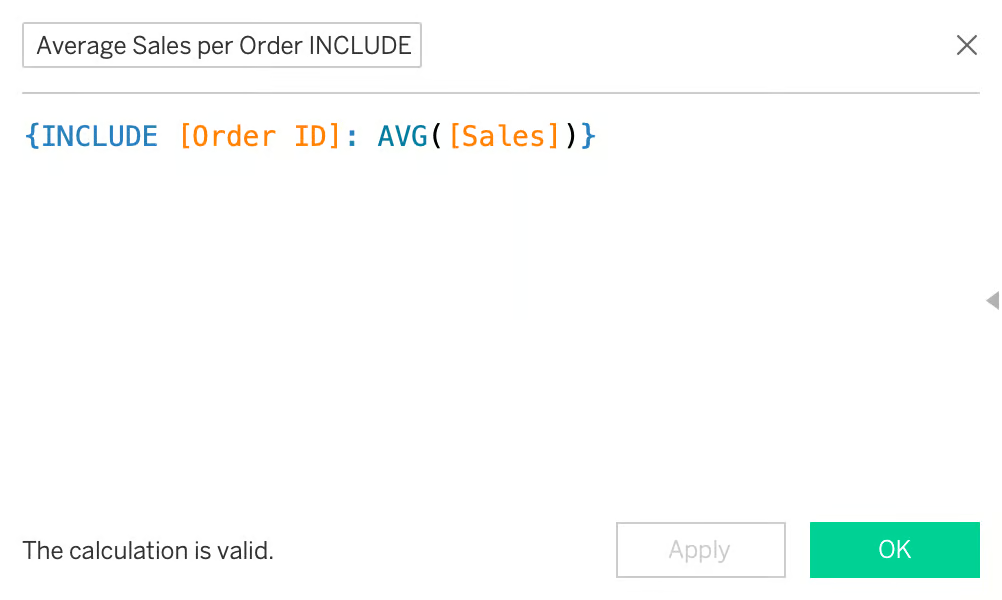
This formula tells Tableau to calculate the average sales per order (Order ID is unique to each order) across the entire dataset, including this detail in the calculation even if Order ID is not present in the view.
Drag the Region field to the Rows shelf. This action will define the primary level of detail in your visualization.
Next, drag your newly created "Average Sales per Order" field to the Text marks card. Tableau will now display the average sales per order for each region.
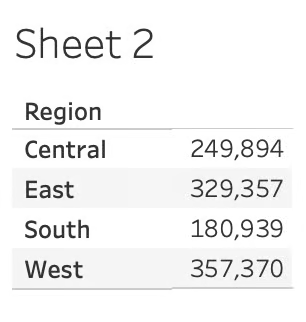
A text table should appear automatically and should look like this::
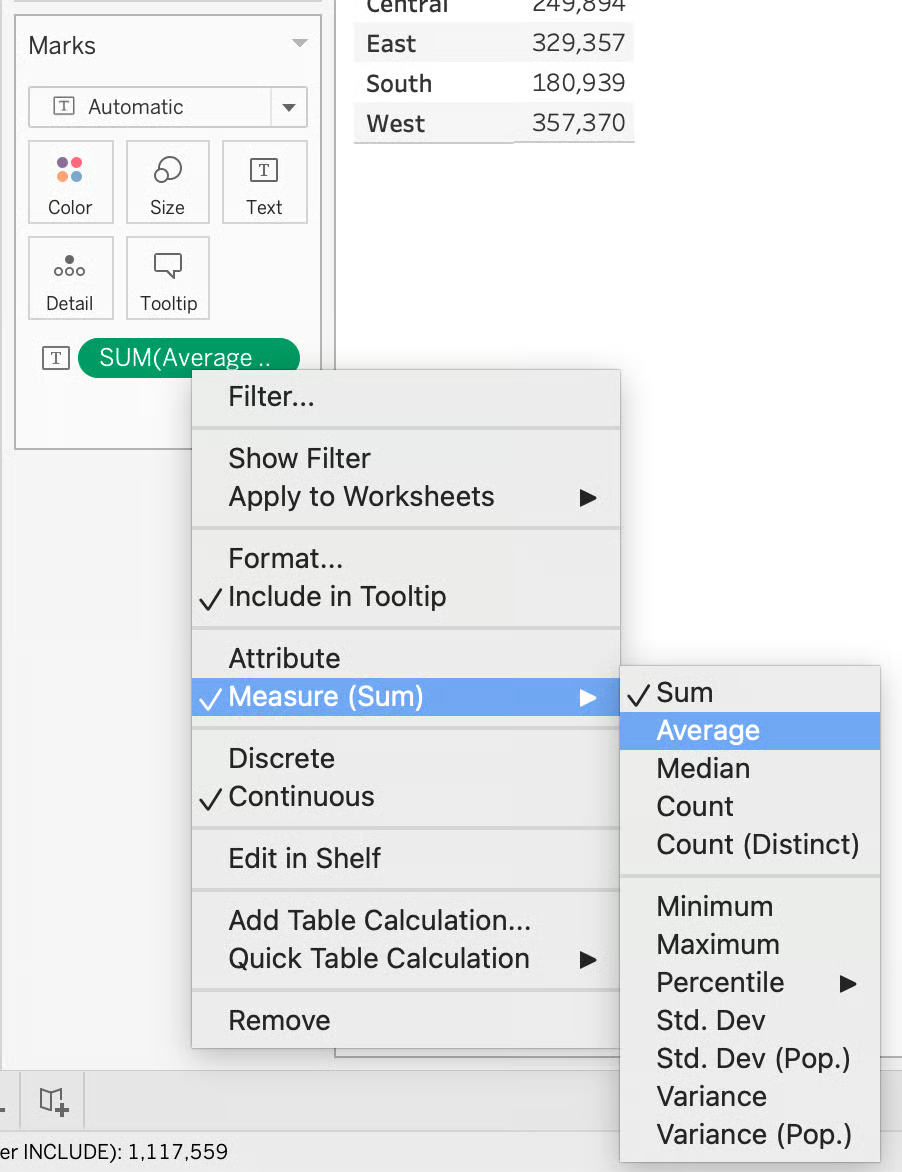
Right-click on the Average Sales per Order pill and change the measure to Average.
Next, we want to compare this to just the regular sales. So let’s also drag the normal Sales field to the Text marks card and change the measure to average.
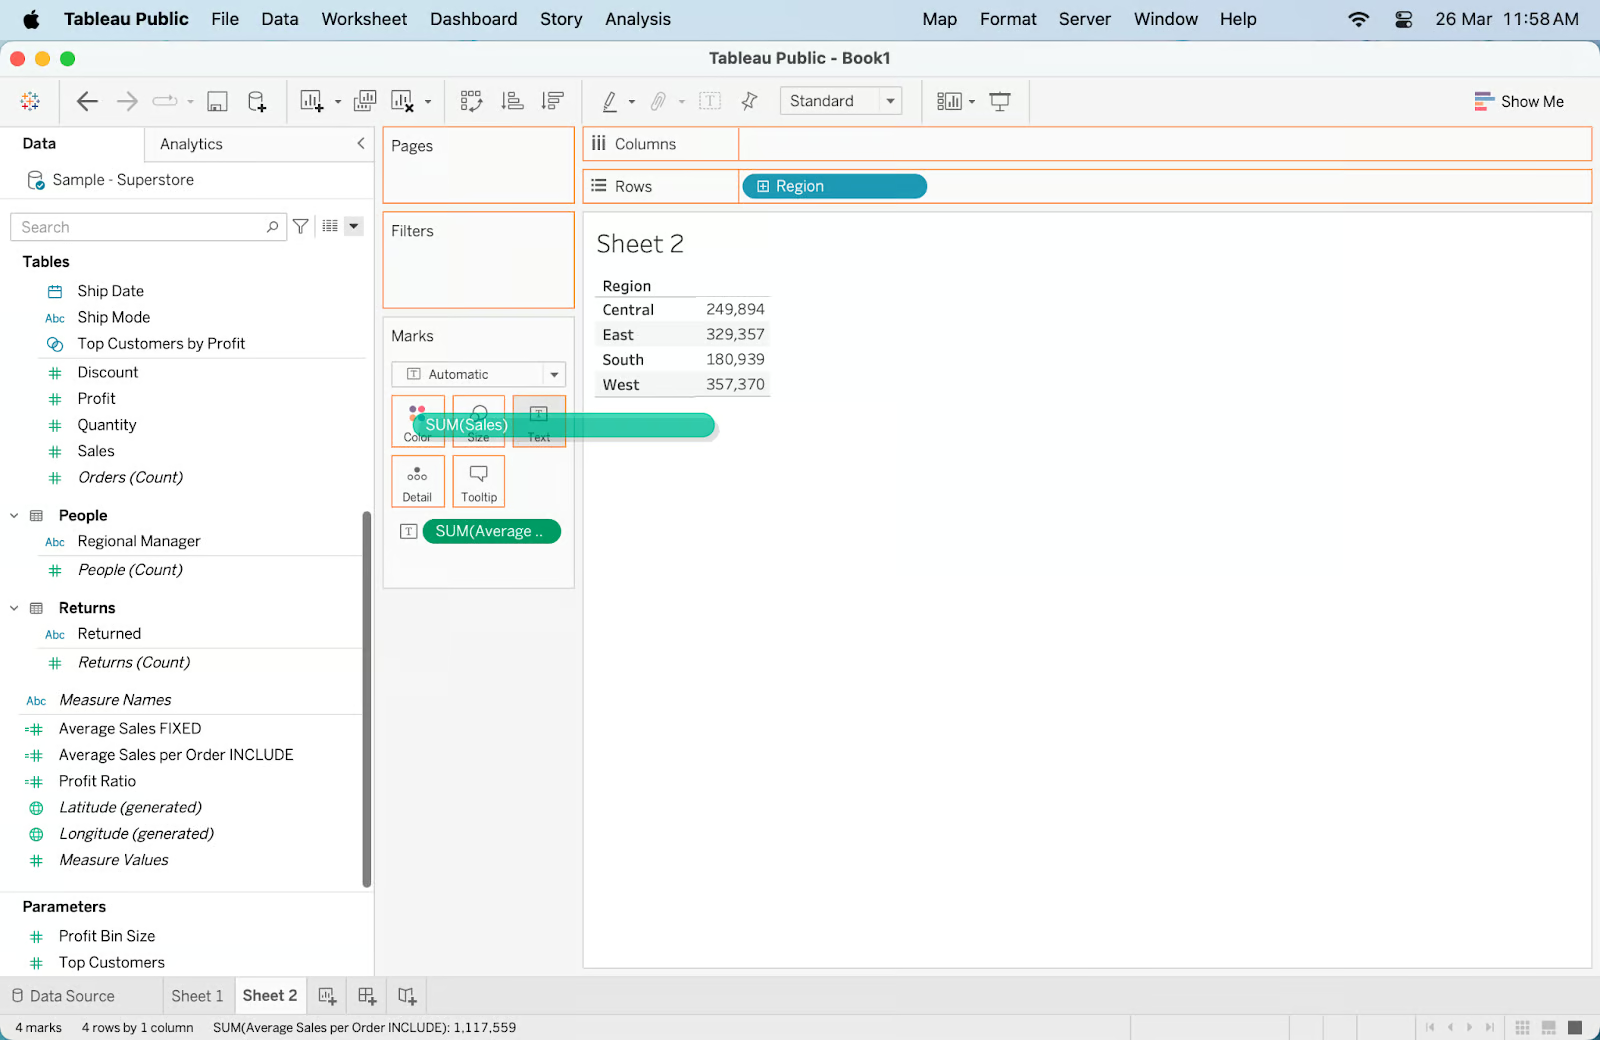
Let’s compare the two fields in the table below.
As you can see, the numbers are slightly different, and this is dependent on the LOD of detail specified in our INCLUDE expression, which is the Order ID.
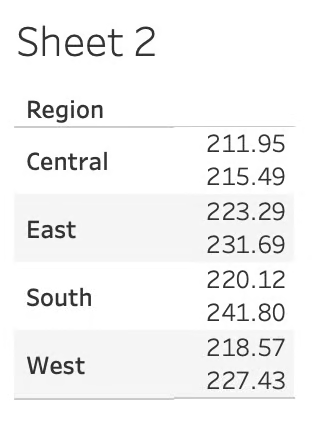
Lastly, let's see how we can use an EXCLUDE LOD expression to focus on a specific level of detail. Suppose we want to see the total sales for each region but exclude the sub-category dimension.
We can create a calculated field with the following formula:
{EXCLUDE [Sub-Category] : SUM([Sales])}This will calculate the total sales for each region, but without taking into account the sub-category dimension.
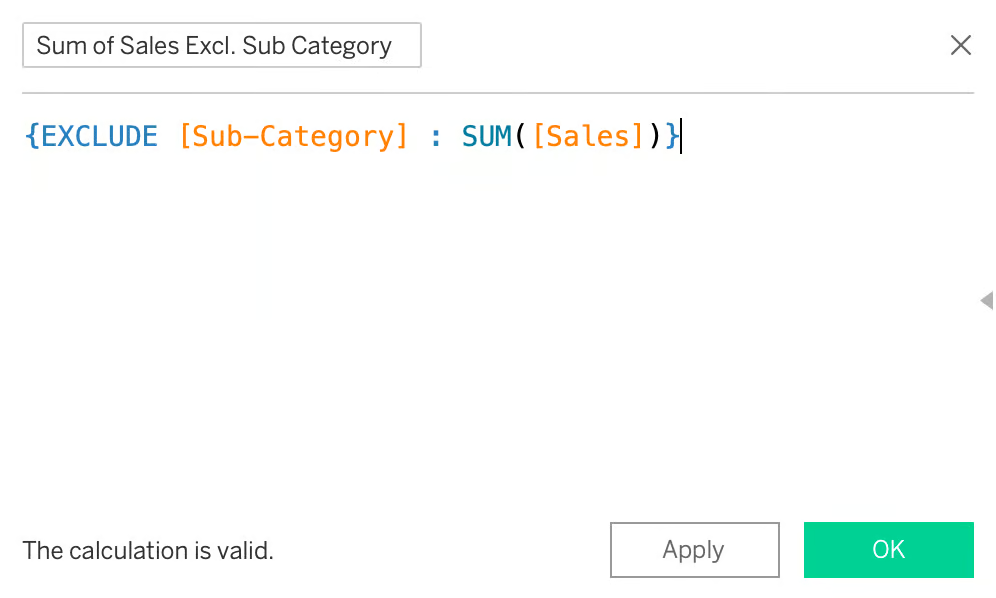
This allows us to focus solely on regional sales without being influenced by the different sub-categories.
We can also use LOD expressions to calculate the growth of sales over a specific period.
For example, suppose we want to see the percentage change in sales from the previous year for each region.
To do this, we can create two calculated fields — one for the total sales in the current year and one for the total sales in the previous year. Then, we can use an INCLUDE LOD expression to calculate the growth percentage.
Here’s the formula:
Total Sales (Current Year):
{INCLUDE [Region] : SUM(IF YEAR([Order Date]) = YEAR(TODAY()) THEN [Sales] END)}Total Sales (Previous Year):
{INCLUDE [Region] : SUM(IF YEAR([Order Date]) = YEAR(TODAY())-1 THEN [Sales] END)}Growth Percentage:
[Total Sales (Current Year)]/[Total Sales (Previous Year)]-1We can then add the growth percentage to our visualization to see how each region's sales have grown compared to the previous year.
This can be in the form of a bar chart like below.
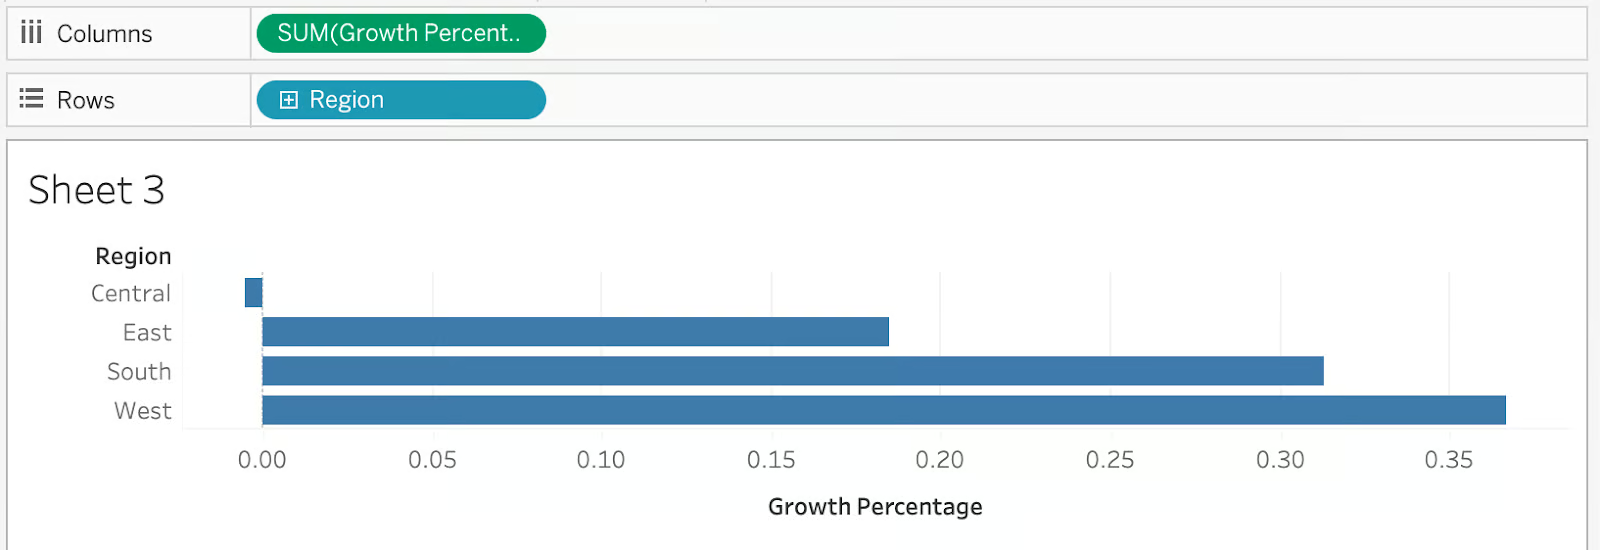
This can help us identify regions that are performing well and those that may need improvement.
Using LOD within Tableau is usually an intermediate to advanced technique, so it's important to have a good understanding of the data and how each type of expression works.
Here are some best practices and tips for using LOD expressions effectively:
When working with LOD expressions, try to understand the purpose of each type and how they can be used to gain insights from your data. Experiment with different scenarios and get creative with your visualizations. With practice, you'll be able to identify quickly which type of LOD is suitable for your use case.
Want to explore more of Tableau’s functions used by data analysts? Our Data Analyst in Tableau track might help you!
If you're looking for more guided content, specifically on LOD expressions, our Calculations in Tableau course might be for you. Or, if you're a beginner who wants to start learning Tableau, try out our Introduction to Tableau course.
Continue Your Tableau Journey Today!
Course
Course
Course
Tutorial
Islam Salahuddin
Tutorial
Parul Pandey
Tutorial
Eugenia Anello
Tutorial
Eugenia Anello
Tutorial
Parul Pandey
Tutorial
Zoumana Keita