Course
Introduction to Python
4 hr
6.9M
Exploratory data analysis is the backbone of any data science project. Before proceeding with the model creation and training the dataset on any machine learning algorithm, it is essential that the dataset is explored to get an overview of what’s in it.
Consider the famous Superstore dataset. The data is that of a United States Superstore and contains information about products, sales, profits, and so on that you can use to identify key areas for improvement within this fictitious company. The first step would be to import the dataset and explore it. You can download the data from here.
Let’s use Python to import the dataset and explore it. If you want to learn more on how to view and clean data in Python, take DataCamp's Cleaning Data in Python course.
import pandas as pd
import numpy as np
superstore_data = pd.read_excel('Sample-Superstore .xls',header = 3)
superstore_data.head()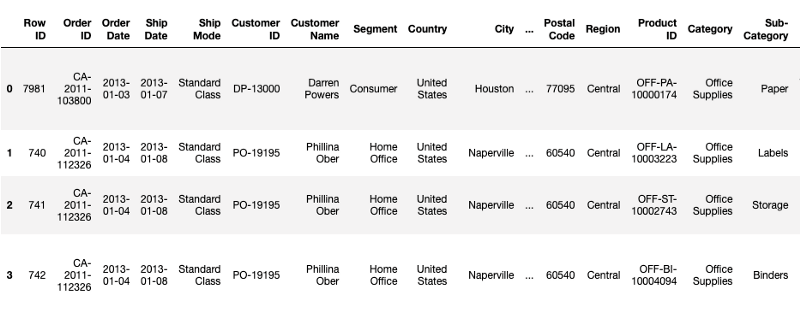
The dataframe shows the first five rows of the dataset containing different attributes. We can also see if there are any missing values and the different columns:
superstore_data.info()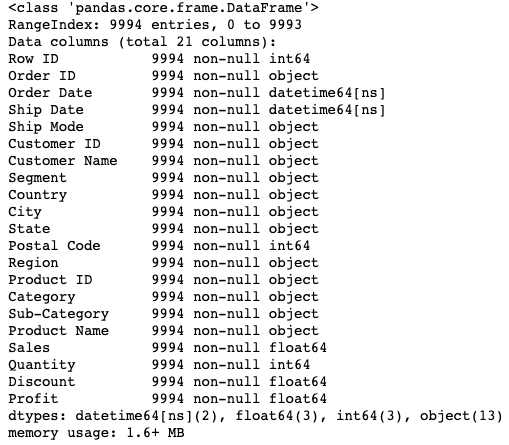
The information above shows that there are no null values and a total of 9994 records. Visualization is also an important part of EDA since it gives a better perspective. We could create a scatter plot between Sales and Profit, but what if there was a way to further modify the existing scatter plot to give us more information? One such way of visualizing information is through a Quadrant Chart. Let’s understand more about it in the next few sections and create one of our own.
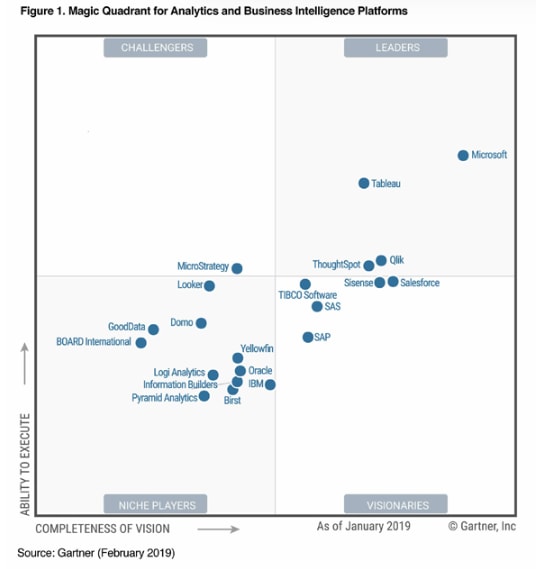
If you are a part of the Data Science ecosystem, you must have heard about Gartner’s Magic Quadrant(MQ). These MQs are a series of reports containing the market research and analysis of several technology companies. As a matter of fact, they are one of the most anticipated and awaited reports in this space. Here is the 2019 Magic Quadrant for Analytics and Business Intelligence Platforms which shows that Tableau and PowerBI are leading the way.
A Quadrant chart is technically a scatter plot that is divided into four equal sections or quadrants, hence the name. A Quadrant Analysis chart helps to represent the data in separate quadrants so that it becomes easy to locate which data points are similar and which are not, based on certain characteristics.
Tableau is a great data analytics and visualization tool used widely in the industry today. Tableau’s ease of use comes from the fact that it has a drag and drop interface. As a result, it makes it very easy and intuitive to create a plethora of plots and quadrant charts is one of them.
This tutorial assumes some familiarity with Tableau, its properties, and how it is used to do the analysis. In case you are a complete beginner, it is suggested that you go through the following article, which serves as an excellent introduction to Tableau:
Data Visualization with Tableau
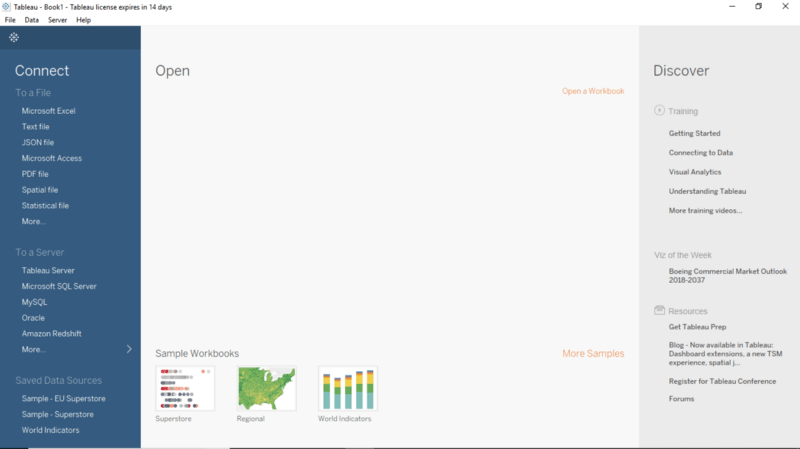
In this tutorial, we will be working with Tableau Public, which is an absolutely free offering from Tableau. Download the Tableau Public edition from the official website. Follow the installation instructions, and if the following screen appears on clicking the Tableau Icon, you are good to go.
We’ll use the same Superstore dataset that had been described earlier. In case you haven’t download the dataset, you can find it here.
Orders Sheet, and it opens up just like a spreadsheet.
Let’s say we want to see how Discount is related to Profits of the Superstore, and which products are more profitable than the other. The first step is to create a simple scatterplot between Discount and Profit Ratio. Profit Ratio gives a better sense than the field Profit alone, and since it doesn’t exist in the original database, we shall create one.
Open up a new worksheet and create a new calculated field called Profit Ratio by using the formula mentioned below.
sum([Profit])/sum([Sales])
Discount to Columns and Profit Ratio to Rows. Finally, drag the Sub Category on to the Colors Shelf. Convert the Measure of Discount to Average from Sum. You get a scatter plot which is colored by the different products.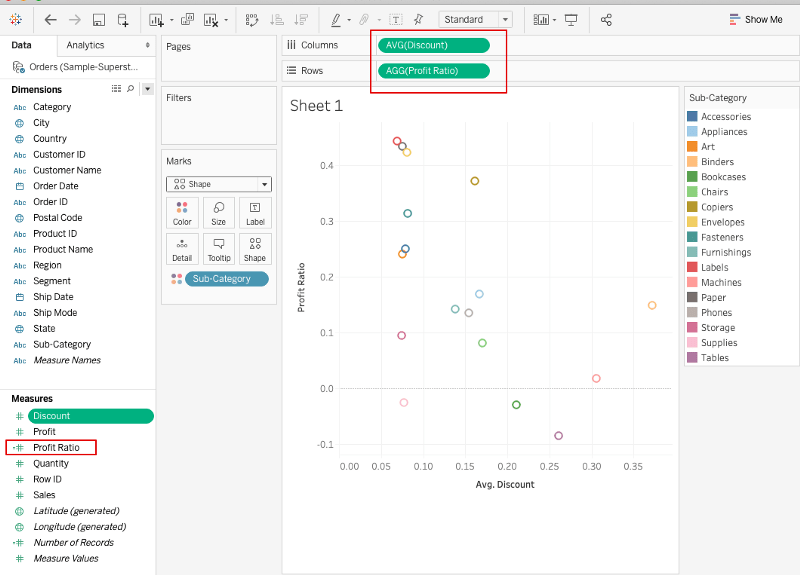
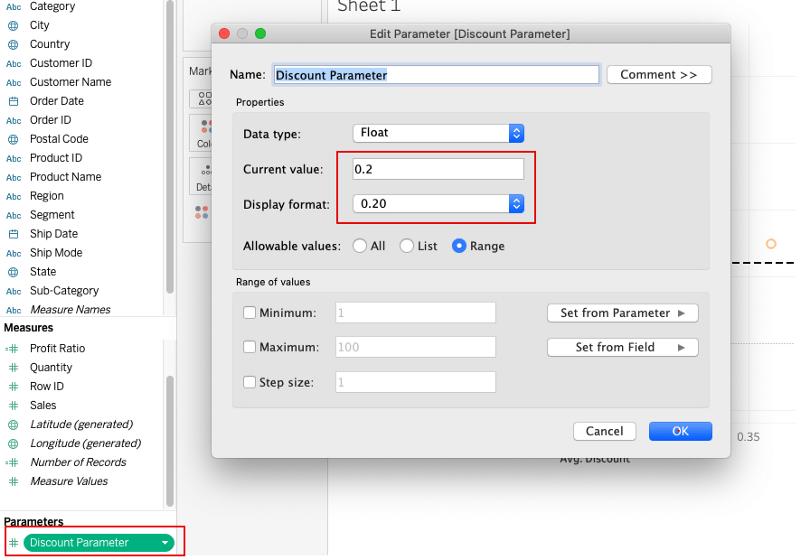
Now that we have a basic scatter plot, it’s time to create the two parameters which will act as the basis on which the Quadrants will be calculated. In our case, we shall create a Discount Parameter and a Profit Ratio Parameter, which will be derived from the Discount and Profit Ratio Fields, respectively.
Click on the Discount field > Create > Parameter and fill in the values as shown in the figure below. Set the Current Value to the point of the data of your choice (in this example, 0.2).
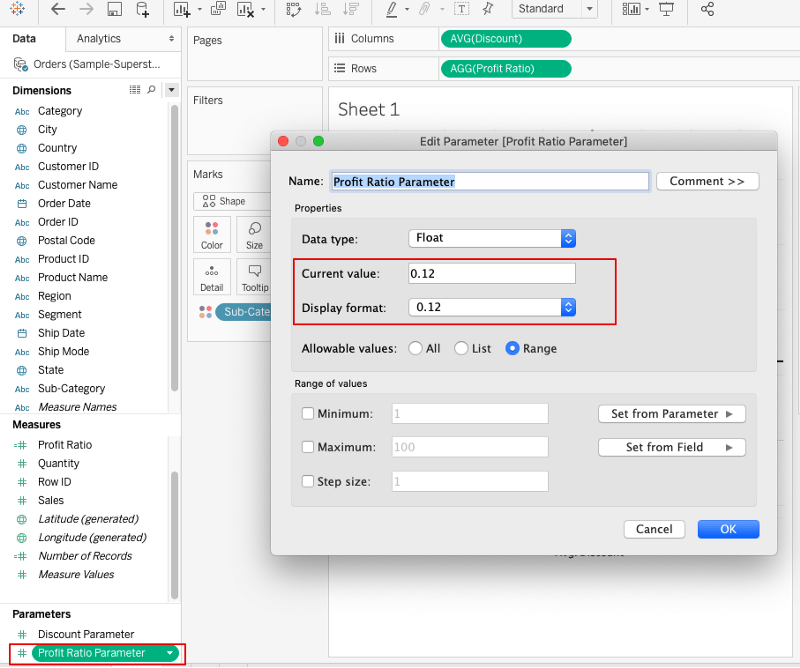
Perform the same steps as above using the Profit Ratio field.
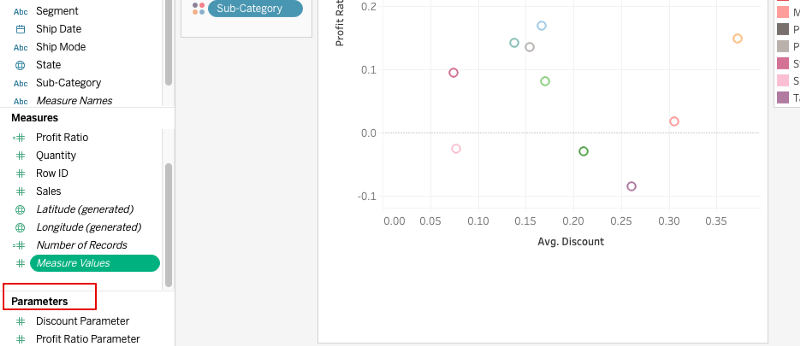
A new heading called Parameters is now visible in the worksheet where both of our calculated parameters appear.
A Reference line in Tableau is simply a vertical or horizontal line in a graph that represents a point of reference. For instance, a reference line drawn on a Sales chart can easily differentiate between high and low sales points. We shall be creating two reference lines, one for each axis.
Profit Ratio axis (y) and select Add Reference Line.Profit Ratio Parameter.Avg Discount axis (x) and select Add Reference Line.Avg Discount Parameter.
We now have our four quadrants, but the data points in every quadrant are randomly colored, which doesn’t help us in visualizing which data point falls in which quadrant. We can write a simple calculation that assigns a color to a data point based on their quadrant i.e., UPPER RIGHT, UPPER LEFT, BOTTOM RIGHT, or BOTTOM LEFT.
Enter the formula as mentioned below:
IF AVG([Discount]) >= [Discount Parameter]
AND [Profit Ratio] > [Profit Ratio Parameter] THEN 'UPPER RIGHT'
ELSEIF AVG([Discount]) < [Discount Parameter]
AND [Profit Ratio] > [Profit Ratio Parameter] THEN 'UPPER LEFT'
ELSEIF AVG([Discount]) >[Discount Parameter]
AND [Profit Ratio] < [Profit Ratio Parameter] THEN 'BOTTOM RIGHT'
ELSE 'BOTTOM LEFT'
END
The data points currently have been colored by the Sub-category. However, we want to color them with their respective quadrants. Simply drag the Sub-Category field on to the Detail card and Quadrant Color field on to the color. Instantly all data points are now colored with respect to the quadrant in which they fall. Change the Shape to circle to get filled circles and adjust the size and tooltip preferences accordingly.
So here we have a Quadrant Analysis of the Discount and Profit Ratio of an American Superstore. It is pretty evident from the graph that products which lie in the Bottom Right are the least profit-making products while the ones lying in the Upper Left are the most profitable ones.
The quadrants in the above chart are fixed and can only be changed once we change the values of the linked Reference lines. What if we want to experiment with different thresholds to see how the products change their quadrants in real time? This is actually possible and is referred to as a dynamic quadrant chart and is achieved through the Actions.
Actions is a feature in Tableau that lets us add interactivity to the data. With the help of this feature, we can interact with our visualization by either selecting, clicking or hovering on them. Actions can perform the following tasks in a visualization:
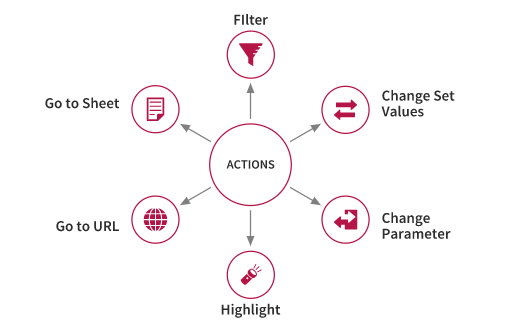
Let’s now set up a worksheet action with the following steps:
Change Parameter action. This is because we want to create an action that changes the parameters accordingly.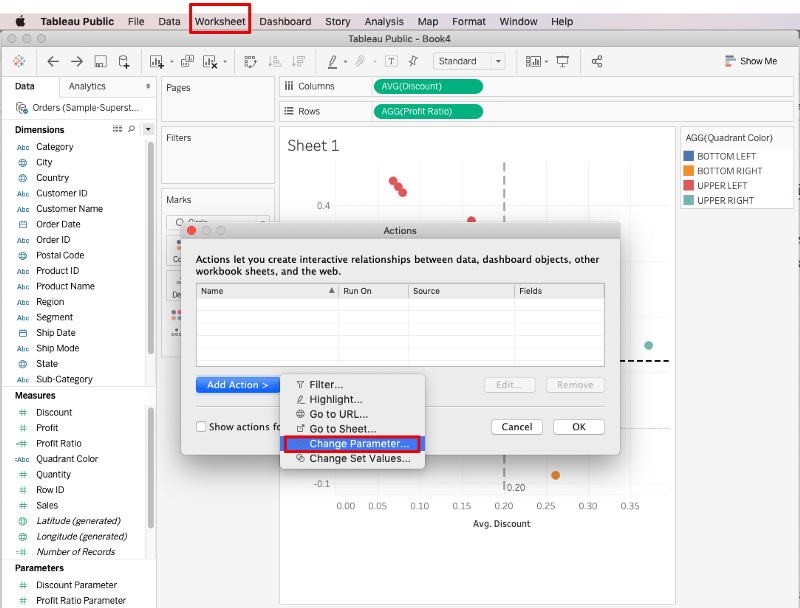
Update Discount Parameter and select the corresponding Target Parameter and Value, which in this case would be Discount Parameter and AVG(Discount) respectively.
Update Profit Ratio Parameter.
Now, as you click on a data point, it becomes the center of the Quadrant. Thus what you now get is a dynamic Quadrant chart, and you can easily see how changing the values of Profit Ratio, and Discount changes the position of products in the quadrant.
In this article, we learned how to convert a scatter plot to an interactive Quadrant Chart. It typically helps to have a general overview of data and understand how similar and dissimilar the objects are when working with a Quadrant chart. From here, you can proceed with the normal data analysis either in R or Python to further do some sales forecasting for coming months and analyze the data to identify important features in the dataset that actually drive sales.
Tableau and related courses
Course
Course
Course
Tutorial
Parul Pandey
Tutorial
Abid Ali Awan
Tutorial
Parul Pandey
Tutorial
Parul Pandey
Tutorial
Parul Pandey
Tutorial
Eugenia Anello