Kurs
Einführung in R
4 Std.
3M
With its specialization in all things data science, including machine learning, data analysis, and visualization, R has revolutionized the way we understand data. Used by many people from different professional backgrounds, including data scientists, academic researchers, and even financial analysts, R has long appeared in the TIOBE index.
R programming has many different uses, and in this article, we look into some of the different things you can do with R programming once you’ve mastered it.
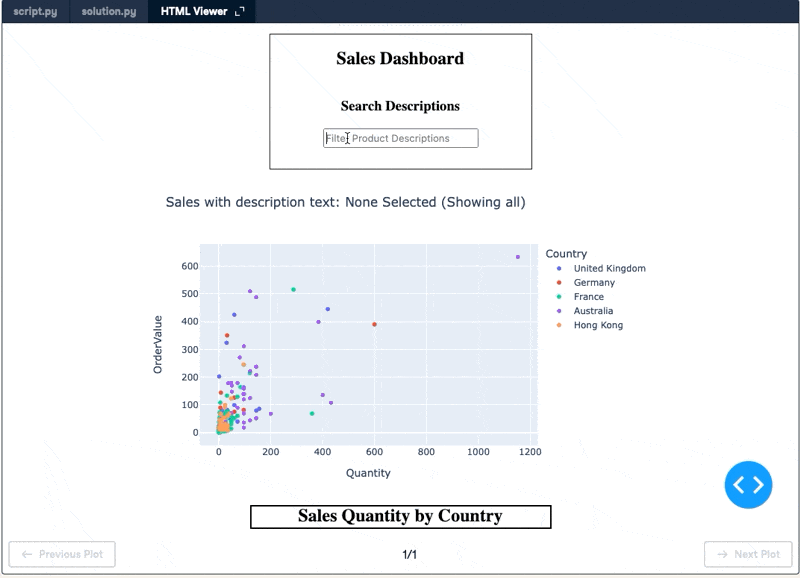
Data visualization is essential to understanding data, and R's ggplot2 package—oft described as the greatest data visualization tool ever created—makes it easy to draw almost any plot you can imagine. Mastering ggplot2 will set you on your way to harnessing the power of R.
For even more impressive visualizations, you can combine ggplot2's elegant syntax with plotly's interactivity, or use shiny to create interactive dashboards.
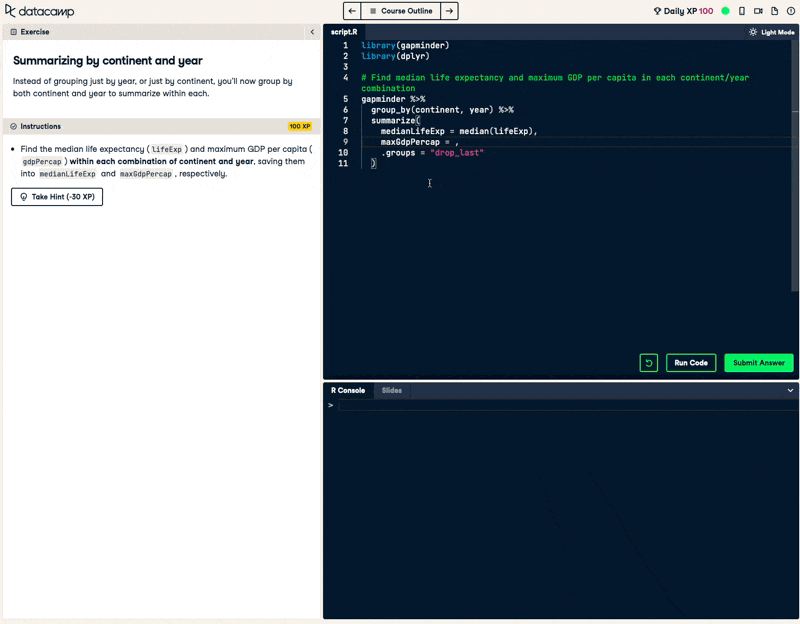
Exploratory data analysis—getting to know what is in your dataset—is the first step whenever you receive new data. R's "tidyverse" suite of packages, including dplyr and tidyr, lets you manipulate and calculate on data with an easy to use syntax that makes it simple to rapidly get to the answer you need.
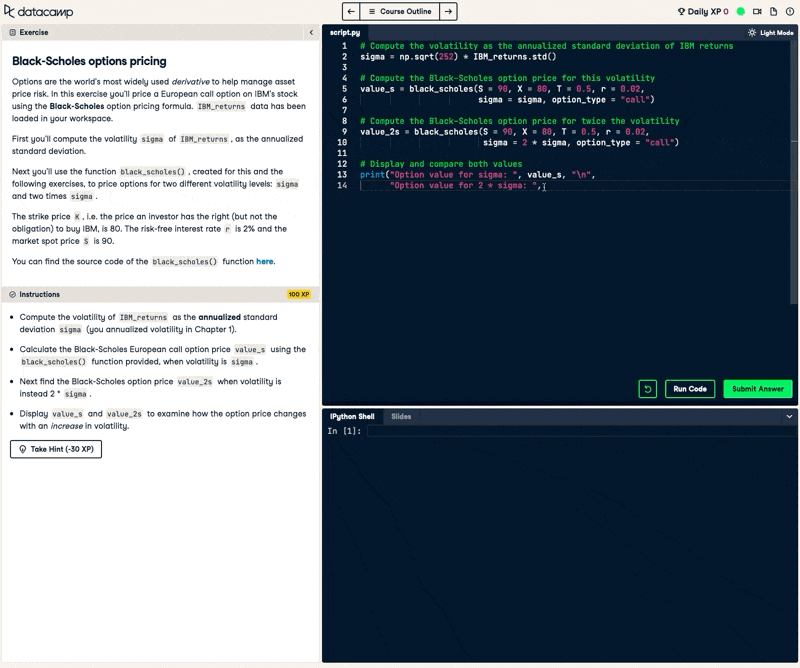
Statistics ensures that your data analyses are scientifically rigorous. R has perhaps the most extensive suite of statistical tools available for any programming language. From simple descriptive statistics like calculating means and standard deviations, through statistical models like linear regression and logistic regression, to experimentation techniques like A/B testing, R puts the power of statistics in your hands.
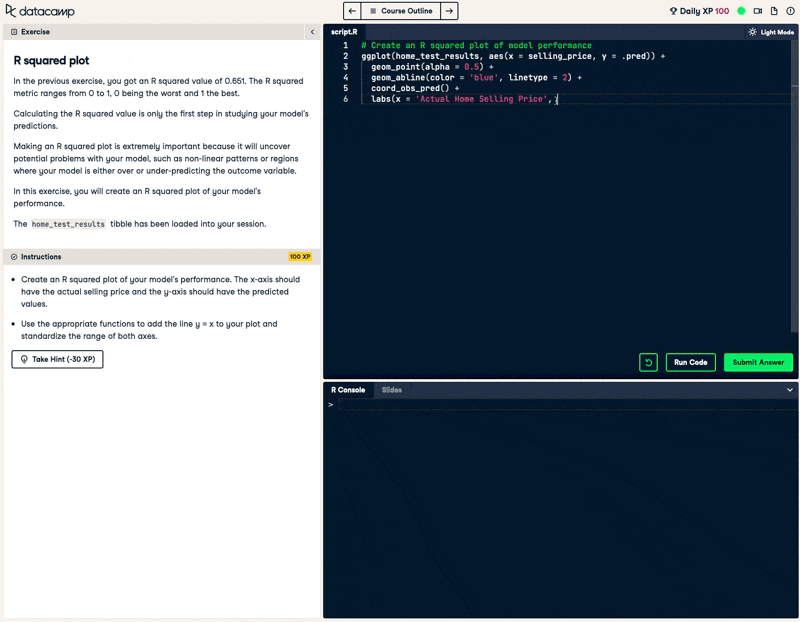
Machine learning is the art of making predictions using data. As with statistics, R has a vast range of tools for letting you run any machine learning model that you desire. Mastering machine learning will allow you to build predictive models such as customer churn models, movie recommendation systems, and more.
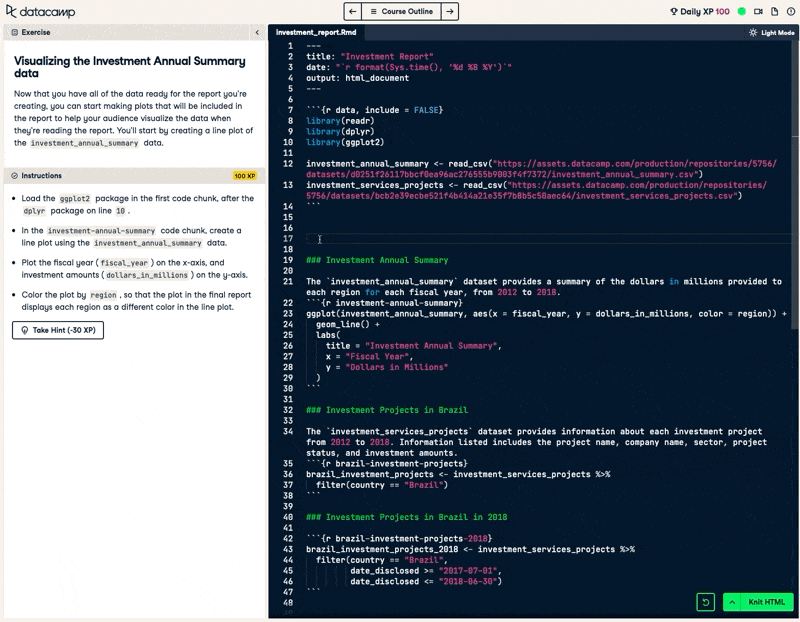
In order to best communicate the results of your analysis, you can structure your outputs in a report for others to read. R Markdown provides a comprehensive, simple to use syntax that can generate reports in a variety of formats, whether you are creating written documents, presentations, or even writing a book.
Courses for R
Kurs
Kurs
Kurs
Blog
DataCamp Team
8 Min.
Blog
DataCamp Team
3 Min.
Blog
Elena Kosourova
14 Min.
Blog
Summer Worsley
15 Min.
Blog
DataCamp Team
3 Min.
Tutorial
Karlijn Willems