
Unser bisher größter Sale. 60 % Rabatt auf Daten- und KI-Skills.
Jetzt kaufen


Üben und Lernpfad deinen Fortschritt.
Weiter mit GoogleWenn du fortfährst, akzeptierst du unsere Nutzungsbedingungen, unsere Datenschutzrichtlinie und dass deine Daten in den USA gespeichert werden.
Blog
 Flavio Matos• 14 Min.

Tutorial
 Eugenia Anello• 13 Min.

Tutorial
 Abid Ali Awan• 10 Min.




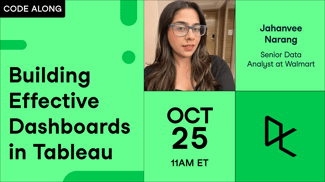

Dashboards are a cornerstone of business intelligence—but their impact depends on how effectively data is transformed into insights that stakeholders can act on. From structuring metrics to designing clear visual narratives, building strong dashboards requires both technical execution and strategic thinking.
In this interactive code-along session, we walk through the process of developing a business intelligence dashboard using mock data and modern analytics tools. You'll see how raw data can be shaped, analyzed, and visualized to support decision-making, while exploring practical considerations around metrics, layout, and storytelling. The session blends live explanation with hands-on demonstration, giving you a flexible framework you can adapt to your own BI use cases.
Key Takeaways:
Session Resources + Files