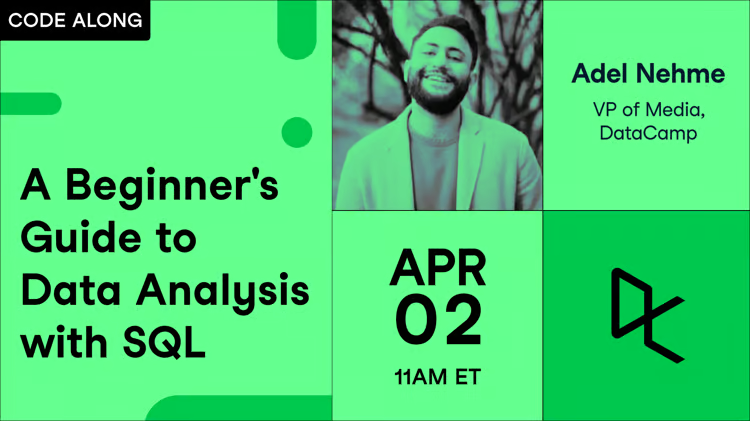
In this live codealong, you will be introduced to the basics of exploring new datasets using SQL. This session explores data on climate change adaptations in the water industry in Africa. You will calculate summary statistics and draw visualizations to generate insights. After the codealong, you will get access to a solution notebook to use as a future reference!
Learning by doing is encouraged, and you can follow along using DataLab. All you need is a DataCamp account. Note that members of some enterprise groups do not yet have access to use DataLab. Create a free DataCamp account with your personal email address to follow along.
Additional resources
-
Related track: Data Analyst in SQL
-
Related cheat sheet: SQL Basics cheat sheet
Key takeaways
-
How to use SQL to manipulate data and calculate summary statistics.
-
How to use Workspace no-code visualizations to draw plots.
-
How exploratory data analysis is used to get insights about your data.
