This tutorial is a write-up of a Facebook Live event we did a week ago. The topic was "Introduction to the Tidyverse" and this tutorial will take you through all of the content we covered during the code-along session!
You can watch the first part of the session here:
And the second part here:
Note that you can find all the code for the session in this repository.
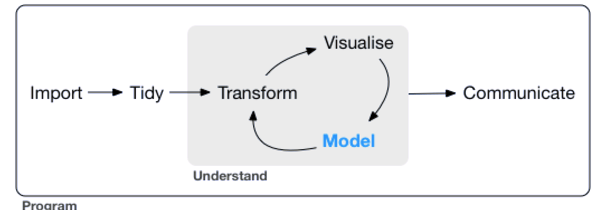
The core tidyverse includes the packages that you're likely to use in everyday data analyses, such as ggplot2 for data visualization and dplyr for data wrangling. You'll focus on these two in this tutorial.
Remember that a package is essentially a set of tools for doing stuff with data. If you'd like to know more about packages in R, check out this tutorial.
For more on the Tidyverse, check out David Robinson's Introduction to Tidyverse course on DataCamp and the Learn the Tidyverse resources.
Getting Started
To start off, you should install the tidyverse, if you haven't already:
Now that you've installed the tidyverse, it's time to load your data and check out some of the observations.
In this tutorial, you'll be exploring the Titanic dataset, where each observation is a person and each variable is a feature such as Name, Age and Survived (or not).
Load your data like this:
library(tidyverse)
passengers <- read.csv("data/train.csv")
passengers
Note that the path that you will give to read.csv() can change depending on your setup. If you'd like to just keep the same file path, you can always check out the folder structure of this project in our GitHub repository, which you can find here.
Note also that if you want to know more about all the variables that you see as a result of executing passengers, you can take a look at the dataset description.
To get an overview of your data, you can use the summary() function:
Now do the same using a pipe %>%, one of the handiest tools in the tidyverse:
Tip: if you'd like to know more about the use of the pipe operator in R, you can check out this tutorial.
Do the same after dropping observations that have missing values. Here's a hint: you can concatenate pipes!
passengers %>%
drop_na() %>%
summary()
You may have noticed stylistic consistency in the code that you've written above. That's because you're adhering to a style guide. In data science and programming/coding in general, it's important to get accustomed to using a style guide asap. As Hadley Wickham puts it in the tidyverse style guide,
Good coding style is like correct punctuation: you can manage without it, butitsuremakesthingseasiertoread.
In the next section, you'll tackle data wrangling with dplyr to filter your data, arrange it and create new features by mutating old ones.
Wrangle your Data
Now it's time to explore your data and get some initial insight into the dataset. You'll be using dplyr verbs such as filter(), arrange() and mutate(), which do exactly what they say.
Let's sat that you wanted to choose a particular set of observations, say, those for which the "Sex" was 'female'. dplyr allows us to do intuitively and in a language that mirrors how you think and talk about data.
The filter verb chooses only the observations that match the condition. See it in action:
passengers %>%
filter(Sex == "male")
When looking at the results of the code chunk above, you'll see that it looks like many men didn't survive the sinking of the RMS Titanic. This is interesting, and you'll explore this more rigorously later on in this tutorial!
Note that you can read dplyr code like a sentence: take your data and then (%>%) filter it according the condition that the sex is male. The code that you see in the above code chunk does not alter the original data frame. filter(Sex = "male") is a common error (Hugo made this same mistake!); there's a cool tidyverse error guide.
passengers %>%
filter(Sex == "female")
Women seem to be more likely to have survived the Titanic disaster, at least, anecdotally speaking.
When you explore data, you should be asking and answering questions that you might be interested in to the best of your abilities! Right now, You might want to arrange() your observations by increasing Fare to see if you can notice any trends. You can use the verb arrange() to achieve this:
passengers %>%
arrange(Fare)
A lot of the people who paid less, did not survive the disaster. That's something interesting that you've just discovered just by re-arranging your data!
You can also arrange by decreasing Fare:
passengers %>%
arrange(desc(Fare))
There are indeed more survivors at the top end!
Sometimes you may wish to create new variables. You know that the variable Parch is the number of parents and children while SibSp is the number of siblings and spouses. You can add these together to get a new variable FamSize. This is feature engineering and it's a big part of machine learning a lot of the time!
Now, to make your new variable, you mutate() the original variables into the new one.
passengers %>%
mutate(FamSize = Parch + SibSp)
Note that mutate() can be used to create new columns but also modify existing columns in much the same way that a mutation may from a biological perspective. It's not exactly right but a nice way to provide context for verb choice.
Now that you have your extra variable, you can ask other questions, such as "Is it possible that larger family have a lower rate of survival?".
To test this hypothesis, create a new variable FamSize as the sum of Parch and SibSp as above, then arrange by decreasing FamSize:
passengers %>%
mutate(FamSize = Parch + SibSp) %>%
arrange(desc(FamSize))
Everyone in the top family did not survive! This might be telling: maybe if you're part of a large family, you weren't able to get off of the Titanic in time.
However, as zeroes and ones don't often say a great deal, mutate the values of the Survived variable to strings No and Yes (and create new data frame!):
passengers1 <- passengers %>%
mutate(Survived = ifelse(Survived == 0, "No", "Yes"))
passengers1
Plotting your Data
To plot your data using ggplot2, you specify three things:
- Your data
- Your aesthetics (for example, what's on the x-axis)
- Your layers (for example, barplot, scatterplot)
First you'll plot a barplot of Sex to see how many males and females were recorded aboard the Titanic:
ggplot(passengers, aes(x = Sex)) +
geom_bar()
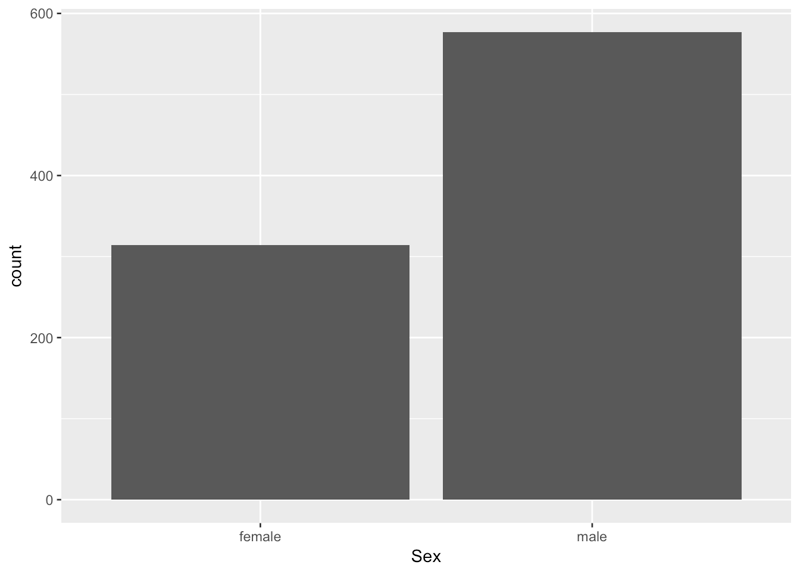
From the above plot, you can tell that there were about 600 men and 300 women aboard of the RMS Titanic.
Note that the aes() function is really a way to map the aesthetics of the plot to the variables in the data. See Modern Dive by Chester Ismay & Albert Y. Kim for more.
Now it's time for some scatter plots. Is the Age of any given passenger correlated with the Fare that they paid?
ggplot(passengers, aes(x = Age, y = Fare)) +
geom_point()
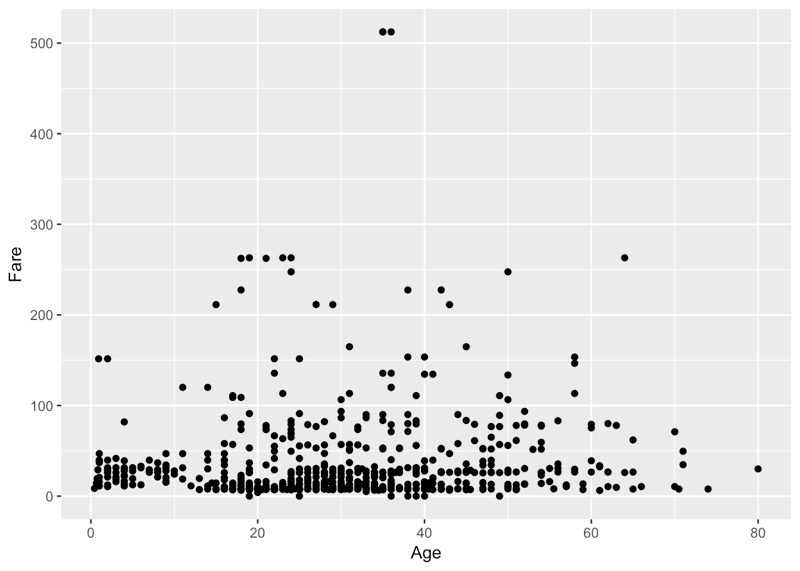
You gathered a lot of insights just from this one plot! You see that a lot of the people who paid more, were also substantially older. There might have been an increase in fare according to age... Additionally, you immediately see the two outliers on top of the plot, which you might want to investigate further!
You can read your ggplot2 code like a sentence, just like your dplyr code above: "You take the data as titanic and you map Age to the x axis and Fare to the y axis, adding points on as the layer of the plot."
Let's take the previous plot and color each point by Sex, to see any correlations between Sex, Age and Fare:
ggplot(passengers %>% drop_na(), aes(x = Age, y = Fare, color = Sex)) +
geom_point()
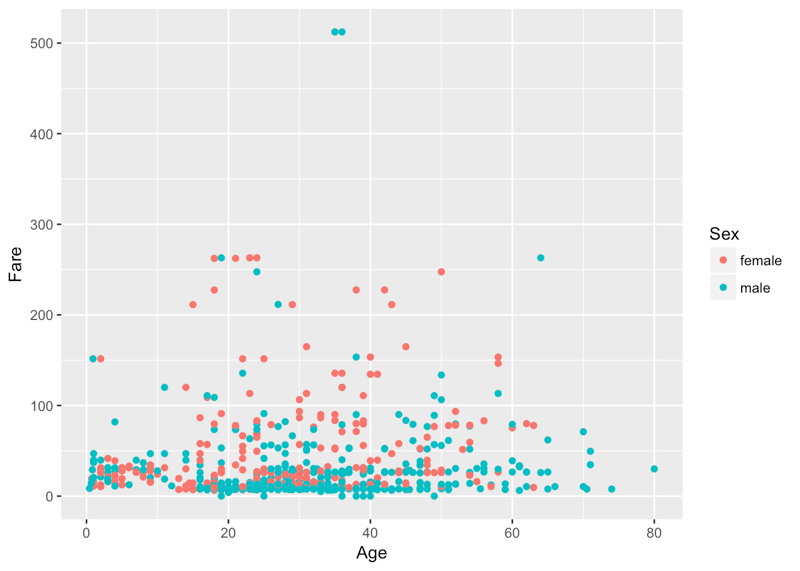
You see that a lot of the people down the bottom, who paid less, were men. You also have a cluster of women towards the top of the plot that were slightly older and also paid more to get on board of the Titanic.
Visualizing three variables (two numeric ones, Age and Fare, and one categorical one, Sex) on one plot is pretty cool, but what if you wanted to throw the Survived variable into the mix to see if there are any apparent trends? You can do this with faceting, which is a way to produce multiple plots simultaneously:
ggplot(passengers1, aes(x = Age, y = Fare, color = Sex)) +
geom_point() +
facet_grid(~Survived)
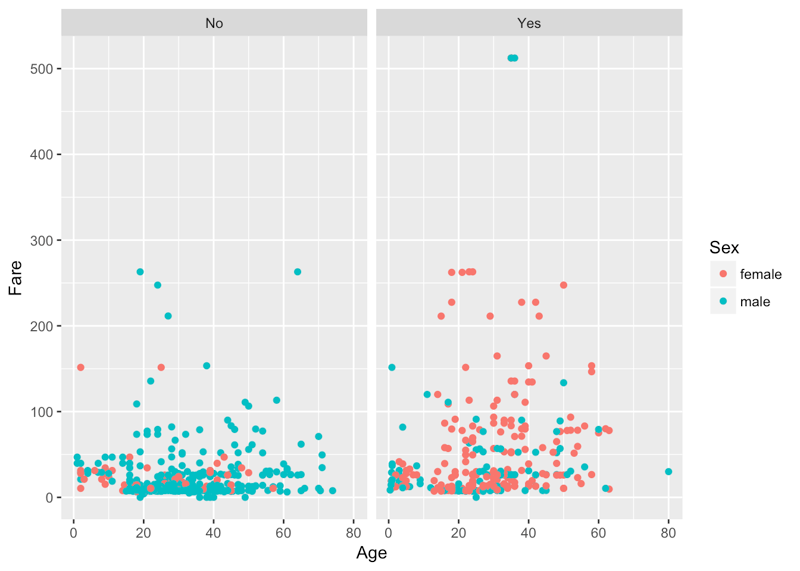
Suddenly, you see that a lot of the women who you noted up there in the previous plot have survived, and that most of them who didn't survive, paid under 50 units. Tip: try to figure out the units of the currency yourself!
Now let's redo your bar plot of passenger Sex and this time fill your bars according to Survived:
ggplot(passengers1, aes(x = Sex, fill = Survived)) +
geom_bar()
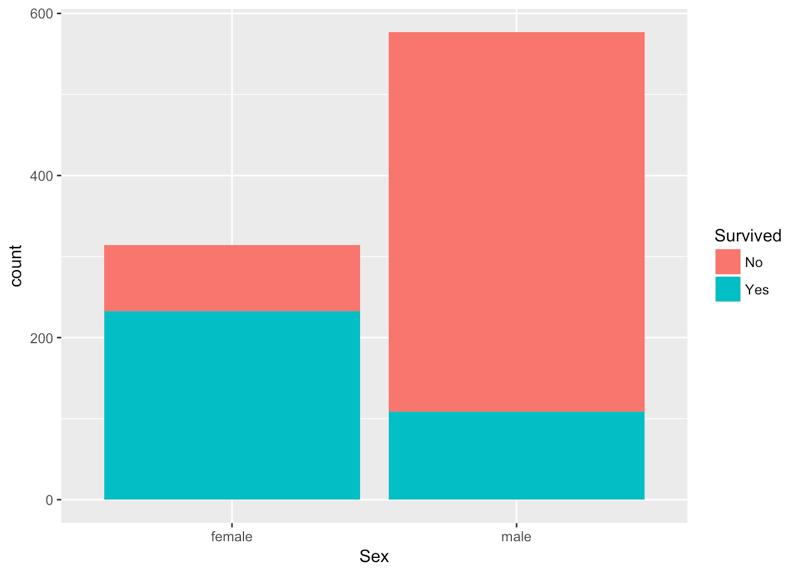
You see that the vast proportion of men did not survive, whereas over two-thirds of the women did survive!
Summarizing and Grouping your Data
Use the summarise() verb to find out the mean fare paid:
passengers %>%
summarise(meanFare = mean(Fare))
Use the summarise() verb to find out the median fare paid:
passengers %>%
summarise(medianFare = median(Fare))
You can also use the filter() and summarise() verbs to find out the mean fare paid among men:
passengers %>%
filter(Sex == "male") %>%
summarise(meanFare = mean(Fare))
Use the filter() and summarise() verbs to find out the mean fare paid among women:
passengers %>%
filter(Sex == "female") %>%
summarise(meanFare = mean(Fare))
Use the filter() and summarise() verbs to find out the mean fare paid among women and how many women survived:
passengers %>%
filter(Sex == "female") %>%
summarise(meanFare = mean(Fare), numSurv = sum(Survived))
Use the group_by() and summarise() verbs to find the mean fare and number of survivors as a function of sex:
passengers %>%
group_by(Sex) %>%
summarise(meanFare = mean(Fare), numSurv = sum(Survived))
Use the group_by() and summarise() verbs to find the mean fare and proportion of survivors as a function of sex:
passengers %>%
group_by(Sex) %>%
summarise(meanFare = mean(Fare), numSurv = sum(Survived)/n())
Conclusion
In this tutorial, you have gone from zero to one with the basics of data analysis using the tidyverse and tidy tools. You've learnt how to filter() your data, arrange() and mutate() it, plot and summarise() it using dplyr and ggplot2, all by writing code that mirrors the way you think and talk about data. Congratulations. I'd encourage you to learn more by taking David Robinson's Introduction to Tidyverse course and by using these tools on other datasets that interest you. Share these analyses with us on twitter @DataCamp and @hugobowne. Thanks for reading.


 Karlijn Willems · 7 min
 Richie Cotton · 6 min

 DataCamp Team · 6 min


This tutorial is a write-up of a Facebook Live event we did a week ago. The topic was "Introduction to the Tidyverse" and this tutorial will take you through all of the content we covered during the code-along session!
You can watch the first part of the session here:
And the second part here:
Note that you can find all the code for the session in this repository.
The core tidyverse includes the packages that you're likely to use in everyday data analyses, such as
ggplot2for data visualization anddplyrfor data wrangling. You'll focus on these two in this tutorial.Remember that a package is essentially a set of tools for doing stuff with data. If you'd like to know more about packages in R, check out this tutorial.
For more on the Tidyverse, check out David Robinson's Introduction to Tidyverse course on DataCamp and the Learn the Tidyverse resources.
Getting Started
To start off, you should install the tidyverse, if you haven't already:
Now that you've installed the tidyverse, it's time to load your data and check out some of the observations.
In this tutorial, you'll be exploring the Titanic dataset, where each observation is a person and each variable is a feature such as
Name,AgeandSurvived(or not).Load your data like this:
Note that the path that you will give to
read.csv()can change depending on your setup. If you'd like to just keep the same file path, you can always check out the folder structure of this project in our GitHub repository, which you can find here.Note also that if you want to know more about all the variables that you see as a result of executing
passengers, you can take a look at the dataset description.To get an overview of your data, you can use the
summary()function:Now do the same using a pipe
%>%, one of the handiest tools in the tidyverse:Tip: if you'd like to know more about the use of the pipe operator in R, you can check out this tutorial.
Do the same after dropping observations that have missing values. Here's a hint: you can concatenate pipes!
You may have noticed stylistic consistency in the code that you've written above. That's because you're adhering to a style guide. In data science and programming/coding in general, it's important to get accustomed to using a style guide asap. As Hadley Wickham puts it in the tidyverse style guide,
In the next section, you'll tackle data wrangling with
dplyrto filter your data, arrange it and create new features by mutating old ones.Wrangle your Data
Now it's time to explore your data and get some initial insight into the dataset. You'll be using
dplyrverbs such asfilter(),arrange()andmutate(), which do exactly what they say.Let's sat that you wanted to choose a particular set of observations, say, those for which the "Sex" was 'female'.
dplyrallows us to do intuitively and in a language that mirrors how you think and talk about data.The
filterverb chooses only the observations that match the condition. See it in action:When looking at the results of the code chunk above, you'll see that it looks like many men didn't survive the sinking of the RMS Titanic. This is interesting, and you'll explore this more rigorously later on in this tutorial!
Note that you can read
dplyrcode like a sentence: take your data and then (%>%) filter it according the condition that the sex is male. The code that you see in the above code chunk does not alter the original data frame.filter(Sex = "male")is a common error (Hugo made this same mistake!); there's a cool tidyverse error guide.Women seem to be more likely to have survived the Titanic disaster, at least, anecdotally speaking.
When you explore data, you should be asking and answering questions that you might be interested in to the best of your abilities! Right now, You might want to
arrange()your observations by increasingFareto see if you can notice any trends. You can use the verbarrange()to achieve this:A lot of the people who paid less, did not survive the disaster. That's something interesting that you've just discovered just by re-arranging your data!
You can also
arrangeby decreasingFare:There are indeed more survivors at the top end!
Sometimes you may wish to create new variables. You know that the variable
Parchis the number of parents and children whileSibSpis the number of siblings and spouses. You can add these together to get a new variableFamSize. This is feature engineering and it's a big part of machine learning a lot of the time!Now, to make your new variable, you
mutate()the original variables into the new one.Note that
mutate()can be used to create new columns but also modify existing columns in much the same way that a mutation may from a biological perspective. It's not exactly right but a nice way to provide context for verb choice.Now that you have your extra variable, you can ask other questions, such as "Is it possible that larger family have a lower rate of survival?".
To test this hypothesis, create a new variable
FamSizeas the sum ofParchandSibSpas above, then arrange by decreasingFamSize:Everyone in the top family did not survive! This might be telling: maybe if you're part of a large family, you weren't able to get off of the Titanic in time.
However, as zeroes and ones don't often say a great deal, mutate the values of the
Survivedvariable to stringsNoandYes(and create new data frame!):Plotting your Data
To plot your data using
ggplot2, you specify three things:First you'll plot a barplot of
Sexto see how many males and females were recorded aboard the Titanic:From the above plot, you can tell that there were about 600 men and 300 women aboard of the RMS Titanic.
Note that the
aes()function is really a way to map theaesthetics of the plot to the variables in the data. See Modern Dive by Chester Ismay & Albert Y. Kim for more.Now it's time for some scatter plots. Is the
Ageof any given passenger correlated with theFarethat they paid?You gathered a lot of insights just from this one plot! You see that a lot of the people who paid more, were also substantially older. There might have been an increase in fare according to age... Additionally, you immediately see the two outliers on top of the plot, which you might want to investigate further!
You can read your
ggplot2code like a sentence, just like yourdplyrcode above: "You take the data as titanic and you mapAgeto the x axis andFareto the y axis, adding points on as the layer of the plot."Let's take the previous plot and color each point by
Sex, to see any correlations betweenSex,AgeandFare:You see that a lot of the people down the bottom, who paid less, were men. You also have a cluster of women towards the top of the plot that were slightly older and also paid more to get on board of the Titanic.
Visualizing three variables (two numeric ones,
AgeandFare, and one categorical one,Sex) on one plot is pretty cool, but what if you wanted to throw theSurvivedvariable into the mix to see if there are any apparent trends? You can do this with faceting, which is a way to produce multiple plots simultaneously:Suddenly, you see that a lot of the women who you noted up there in the previous plot have survived, and that most of them who didn't survive, paid under 50 units. Tip: try to figure out the units of the currency yourself!
Now let's redo your bar plot of passenger
Sexand this time fill your bars according toSurvived:You see that the vast proportion of men did not survive, whereas over two-thirds of the women did survive!
Summarizing and Grouping your Data
Use the
summarise()verb to find out the mean fare paid:Use the
summarise()verb to find out the median fare paid:You can also use the
filter()andsummarise()verbs to find out the mean fare paid among men:Use the
filter()andsummarise()verbs to find out the mean fare paid among women:Use the
filter()andsummarise()verbs to find out the mean fare paid among women and how many women survived:Use the
group_by()andsummarise()verbs to find the mean fare and number of survivors as a function of sex:Use the
group_by()andsummarise()verbs to find the mean fare and proportion of survivors as a function of sex:Conclusion
In this tutorial, you have gone from zero to one with the basics of data analysis using the tidyverse and tidy tools. You've learnt how to
filter()your data,arrange()andmutate()it, plot andsummarise()it usingdplyrandggplot2, all by writing code that mirrors the way you think and talk about data. Congratulations. I'd encourage you to learn more by taking David Robinson's Introduction to Tidyverse course and by using these tools on other datasets that interest you. Share these analyses with us on twitter @DataCamp and @hugobowne. Thanks for reading.