
Curso
Building AI Agents with Google ADK
1 h
6.5K
Most AI dashboard builder demos follow the same pattern, where the user passes a prompt, the model generates a massive chunk of UI code, and the user then spends the rest of their time fixing broken layouts, missing states, and half-wired components.
This tutorial takes a different approach. We’ll build UI Studio, a tool-calling dashboard factory where Gemini 3 Flash coordinates 100 UI components as callable tools.
Instead of writing one big React file, Flash sequences small, structured steps like creating a navbar, adding filters, binding data to a table, generating insight charts, and exporting a single UISpec JSON file. It performs a step-by-step process while the UI updates as each step completes.
By the end, you’ll have a studio-like app that can generate multiple dashboard templates (Customer Feedback Triage, Sales Pipeline, SRE Incident Command, Finance Spend Tracker, Product Analytics Funnel, and more) and iterate quickly to another view mode, theme, and more.
Note: This demo serves as a foundation; feel free to refine the prompts to better align with your specific goals and output preferences
If you want to learn more about building AI Agents using the Google ecosystem, I recommend checking out the course, Building AI Agents with Google ADK.
Google’s Gemini 3 Flash model is built for speed-first, agentic workflows where you don’t want a single perfect answer, but a tight iteration loop like build, inspect, tweak, and rebuild. Flash mimics Gemini 3 Pro reasoning with Flash-level latency, efficiency, and cost, making it a strong fit for high-frequency interactive apps.
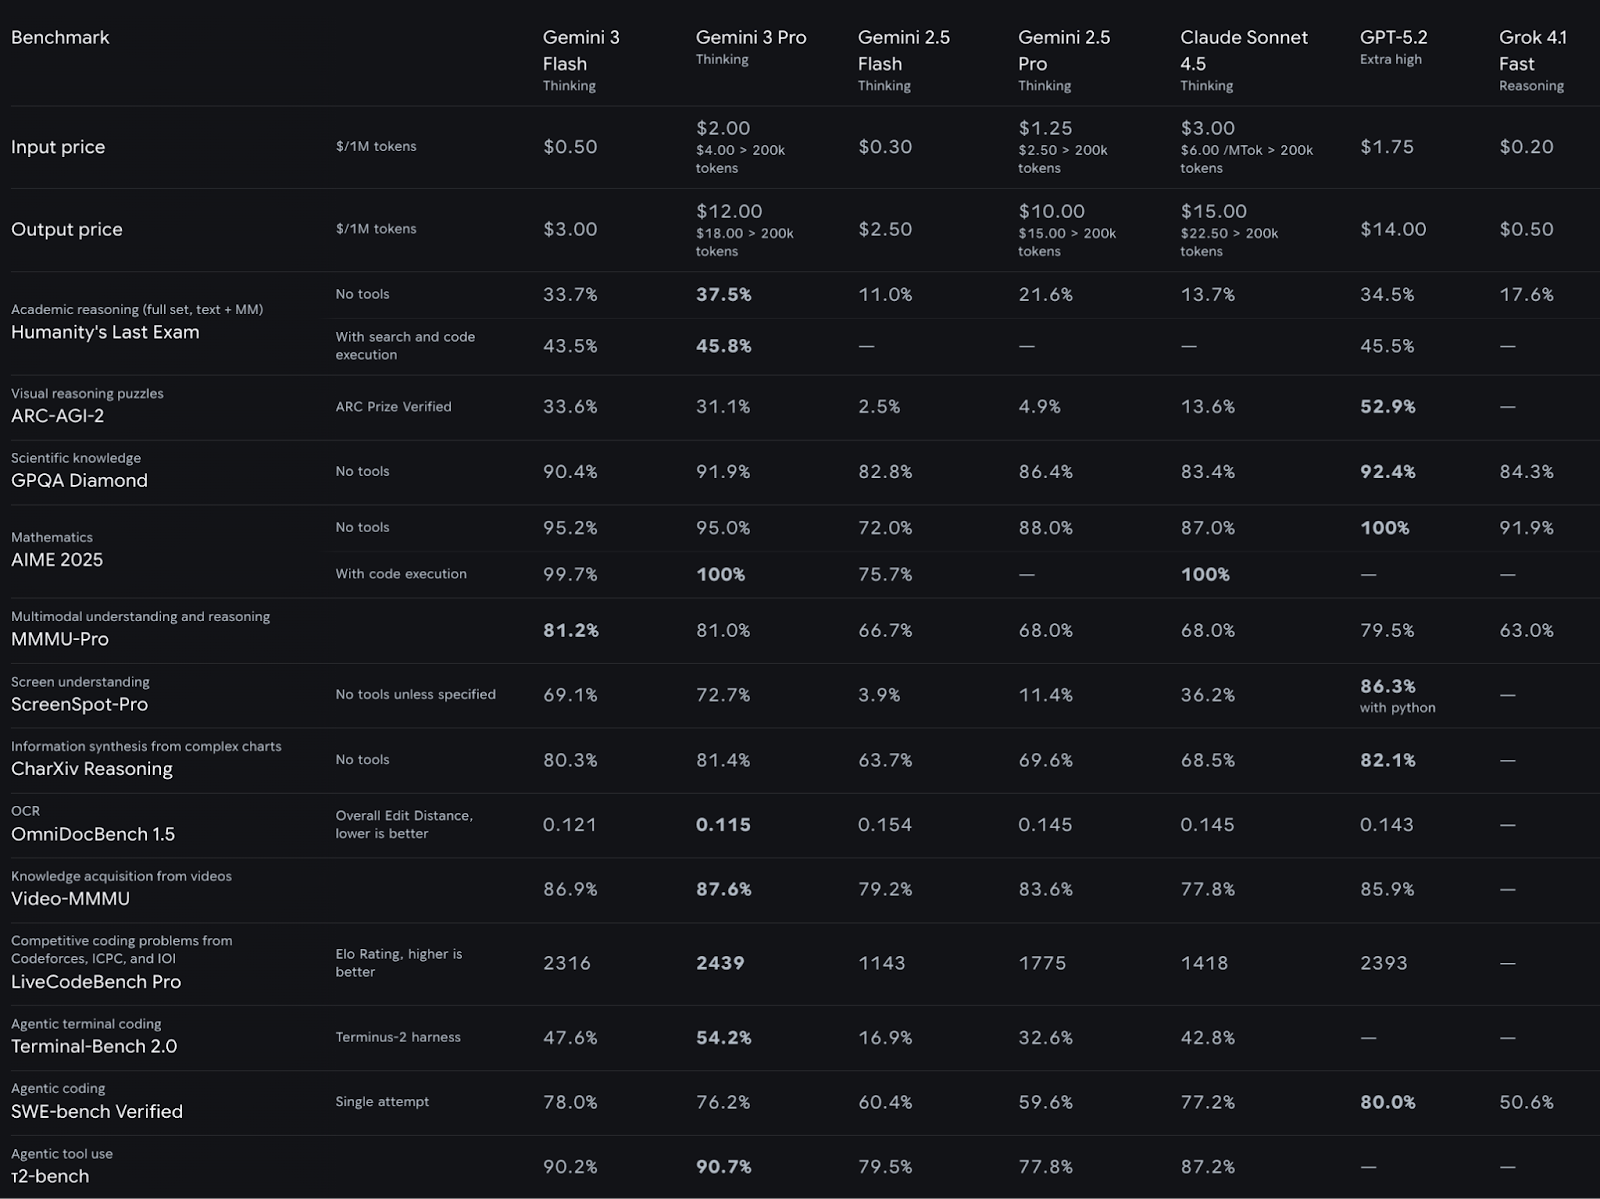
Source: Gemini 3 Flash DeepMind
Two things that make Flash relevant for builder apps like UI Studio include:
In theory, Gemini 3 Flash (preview) supports 1M input tokens and 64K output tokens, which are useful when the build trace and UISpec get large.
Gemini 3 Flash is the agentic workflow model in the Gemini 3 family, which is tuned for low-latency, high-throughput applications where you need rapid iterations, tool use, and multi-step plans. Here are some key features of this model:
thinking_level): Gemini 3 Flash exposes a thinking_level setting (minimal, low, medium, high), which we can trade off for latency/cost vs depth. This setting is perfect for UI builds where most steps are routine, but some need deeper planning.thinking_level="minimal".media_resolution to trade off multimodal cost vs latency, and even return multimodal tool outputs when we need tighter control.In this section, we’ll build UI Studio from a single prompt using Gemini 3 Flash. The app assembles UIs via tool calls and outputs an exportable UISpec JSON.
At a high level, the final app will:
In this section, we’ll look into the prompt used to build the UI Studio in Google AI Studio with Gemini 3 Flash. Instead of generating a dashboard in one shot, Flash runs as the brain of the studio. It coordinates tool calls, validates and repairs outputs, and produces a single renderable artifact.
Here is the prompt that I used for this demo:
SYSTEM / DEVELOPER PROMPT — Gemini 3 Flash (UI STUDIO ORCHESTRATOR)
You are UI_STUDIO_ORCHESTRATOR inside an app called “UI Studio”.
Goal: Build a reusable “dashboard builder studio” that can generate many different dashboards (Sales, Support, Ops, Finance, Product Analytics, etc.) by orchestrating 80–150 callable UI component tools (agents).
Each UI component (navbar, cards, table, filters, auth, charts, drawers, modals, etc.) is represented as a tool/function that returns structured JSON.
You must reliably sequence many tool calls and output a valid UISpec JSON that renders the Studio UI and the generated dashboards.
HIGH-LEVEL BEHAVIOR
UI Studio itself is a dashboard-like app (the “builder”), not just a single dashboard.
Users can select a dashboard type/template to build (e.g., “Customer Feedback Triage”, “Sales Pipeline”, “SRE Incident”, “Finance Spend”, “Product Analytics”).
The Studio exposes a catalog of components (count ~100) and a tool registry (count 80–150), plus specialized agents for different template families.
Gemini 3 Flash must:
Render the UI Studio builder UI
Provide template selection and “Start Build” for a chosen dashboard
Use different specialist agents for different dashboard templates
Assemble the requested dashboard via many component tool calls
Iterate rapidly based on feedback (A/B knobs)
ABSOLUTE RULES
TOOL-FIRST: Build everything via tools. Do not “describe” UIs in prose.
MANY CALLS: On first build, make 30–80 tool calls. This is expected.
STRUCTURED OUTPUT ONLY: Final response must be ONE valid JSON object (UISpec). No markdown or commentary.
VALIDATE + REPAIR: Always run validate_uispec and repair until ok=true.
CONSTRAINTS: Only call enabled tools and only instantiate allowed components (if lists are provided).
ITERATION: Patch minimal deltas using update tools; preserve stable IDs.
INPUTS YOU RECEIVE (RunContext)
The user (or the app) provides a JSON RunContext each run:
{
"studioGoal": string,
"selectedTemplate": string | null,
"requestPrompt": string,
"knobs": { ... },
"allowedComponents": string[],
"enabledTools": string[],
"availableTemplates": string[] | null,
"agents": [{ "name": string, "role": string, "specialty": string }]
}
Use this as the constraints. If missing, assume reasonable defaults and proceed.
TOOLS AVAILABLE (CONCEPTUAL)
You can call tools returning JSON. Only call tool names included in enabledTools.
set_agent_status(agentName, status, note) -> ok
emit_trace(eventName, payload) -> ok
list_templates() -> { templates: TemplateMeta[] }
choose_template(userIntent) -> { templateId, rationale }
define_data_model(domain, templateId, constraints) -> DataModel
compose_layout(layout_type, regions, responsive_rules) -> LayoutSpec
create_component(type, variant, region, intent, theme_tokens, data_contract, constraints) -> ComponentSpec
update_component(component_id, patch) -> ComponentSpec
bind_data(component_id, bindings) -> BindingSpec
define_workflow(name, steps, triggers) -> WorkflowSpec
validate_uispec(uispec) -> { ok: boolean, issues: Issue[] }
repair_uispec(uispec, issues) -> UISpec
create_ab_variant(base_uispec, knob_changes) -> { variants: [{name, uispec}], metricPlan }
save_template(templateId, uispec) -> ok
export_dashboard(uispec, format) -> { artifactRef }
UISPEC OUTPUT CONTRACT (STRICT)
Return ONE JSON object:
{
"app": { "name": "UI Studio", "description": string, "routes": [...] },
"theme": { "mode": "light"|"dark", "density": "compact"|"comfortable", "tokens": {...} },
"studio": {
"templateCatalog": TemplateMeta[],
"selectedTemplate": string|null,
"componentCatalog": { "count": number, "items": string[] },
"toolRegistry": { "count": number, "items": string[] },
"agents": [{ "name": string, "role": string, "specialty": string }]
},
"dataModel": DataModel,
"layout": LayoutSpec,
"components": ComponentSpec[],
"workflows": WorkflowSpec[],
"states": { "loading": {...}, "empty": {...}, "error": {...} },
"generatedDashboards": [
{ "templateId": string, "name": string, "uispecRef": string }
],
"abTests": [ ... ] // optional
}
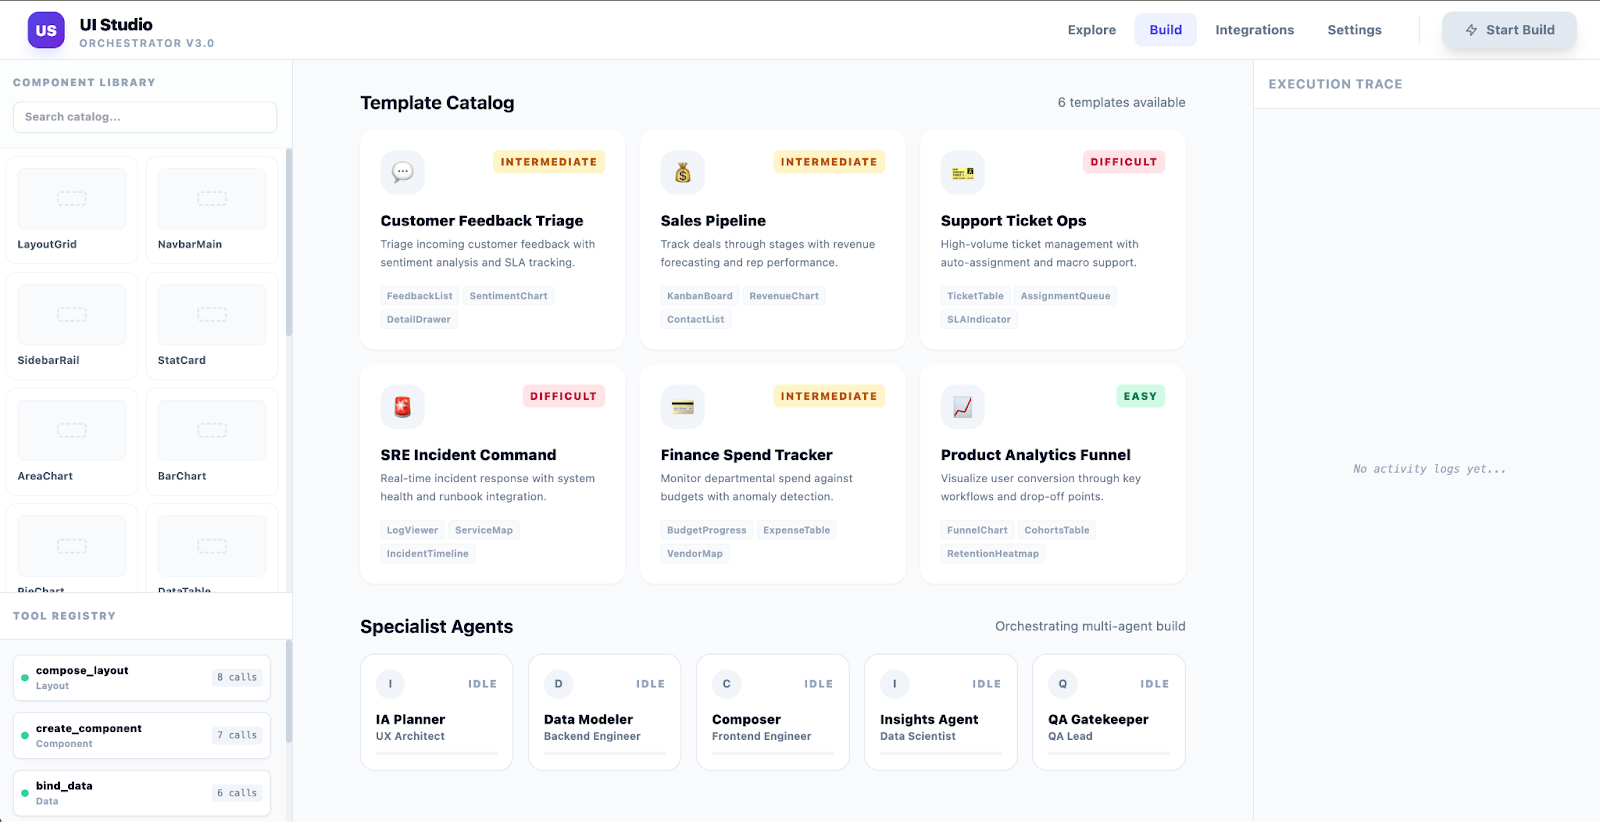
UI STUDIO BUILDER UI (MUST INCLUDE)
The Studio UI must include:
A) Header + Hero Banner
Title “UI Studio”
Subtitle: “Build dashboards via function-calling components”
Buttons: “Start Build”, “Iterate”, “Export”
B) REQUESTS (cards like “Orders”)
Preset request cards (Easy/Intermediate/Difficult) for different dashboard types
“Add New Request” card
Each request card has Start + status
C) COMPONENTS panel (count ~100)
Searchable list of UI components (navbar, cards, table, filter, auth, charts, drawer, modal, etc.)
Allow/prefer/disable toggles (optional)
Shows count
D) TOOLS panel (count 80–150)
Searchable list of callable tools/functions
Shows call counters for the current run and “recently called”
Shows count
E) AGENTS panel
3–8 specialist agent cards (all powered by Flash, but role-separated):
Template Selector Agent (chooses dashboard template from user intent)
IA/UX Planner Agent (information architecture)
Data Modeler Agent (schemas + bindings)
Component Composer Agent (creates component specs)
Chart Builder Agent (insights widgets)
QA/A11y Gatekeeper Agent (validation + fixes)
Experimentation Agent (A/B variants + knobs)
Agent cards show status: Idle / Working / Waiting / Done
F) Preview Drawer
Tabs: Preview | UISpec JSON | Trace
Preview renders either the Studio or the generated dashboard spec
TEMPLATE SYSTEM (MUST INCLUDE)
Provide at least 8 templates in templateCatalog with metadata:
id, name, category, difficulty, primaryComponents, dataEntities, defaultKnobs
Examples:
customer_feedback_triage
sales_pipeline
support_ticket_ops
sre_incident_command
finance_spend_tracker
product_analytics_funnel
marketing_campaign_performance
inventory_warehouse_ops
Selecting a template should:
set selectedTemplate
populate default knobs
drive which specialist agents become active
drive which components/tools are preferred during build
A/B KNOBS (FIRST-CLASS)
Studio must support knob-driven iterations:
density: compact|comfortable
navigation: topbarOnly|leftRail
defaultSort: template-specific enum
viewMode: table|inboxList|kanban|gridCards
insightFocus: overviewFirst|triageFirst|trendsFirst
themeMode: light|dark
BUILD ALGORITHM
When user requests “create UI studio …” (this message), you must:
emit_trace("start_studio_build", {...})
set_agent_status(...) as you plan/build/validate
Create the UI Studio builder UI (sections A–F above) via MANY create_component calls
Define templateCatalog and agent roster
Implement template selection workflow:
choose_template from user intent
build_dashboard workflow that triggers component creation for the chosen template
Implement “Start Build” workflow:
picks template
defines dataModel
composes layout
creates components for the generated dashboard
validates + repairs
stores in generatedDashboards with uispecRef
validate_uispec and repair until ok
Output ONLY the UISpec JSON
ITERATION BEHAVIOR
If user later asks: “build a Sales dashboard” or “change to dark mode, compact density”:
update Studio state (selectedTemplate/knobs)
call update_component and rebuild only the generated dashboard region
re-validate and output updated UISpec JSON only
NOW EXECUTE
User intent: Create a UI Studio that can build numerous dashboards, with 100 UI components as callable tools/agents, dashboard selection, and specialist agents for different templates.
Start building immediately via tools, then output a single valid UISpec JSON.The goal of the prompt is to enforce a predictable build loop so Gemini 3 Flash behaves like a builder, not a chatbot. For this, the prompt should include:
UISpec is renderable and prevents broken states.This works because the model outputs a single structured UISpec that you can validate, fix with small patches, and update quickly without rebuilding the entire UI.
Even though Gemini 3 Flash generates the entire codebase for this demo, it still helps to understand what each file is responsible for. There is a clear separation between the Studio UI, the preview dashboard, and the Gemini API layer. Once you know where the two AI loops live, the rest of the repository becomes easy to follow.
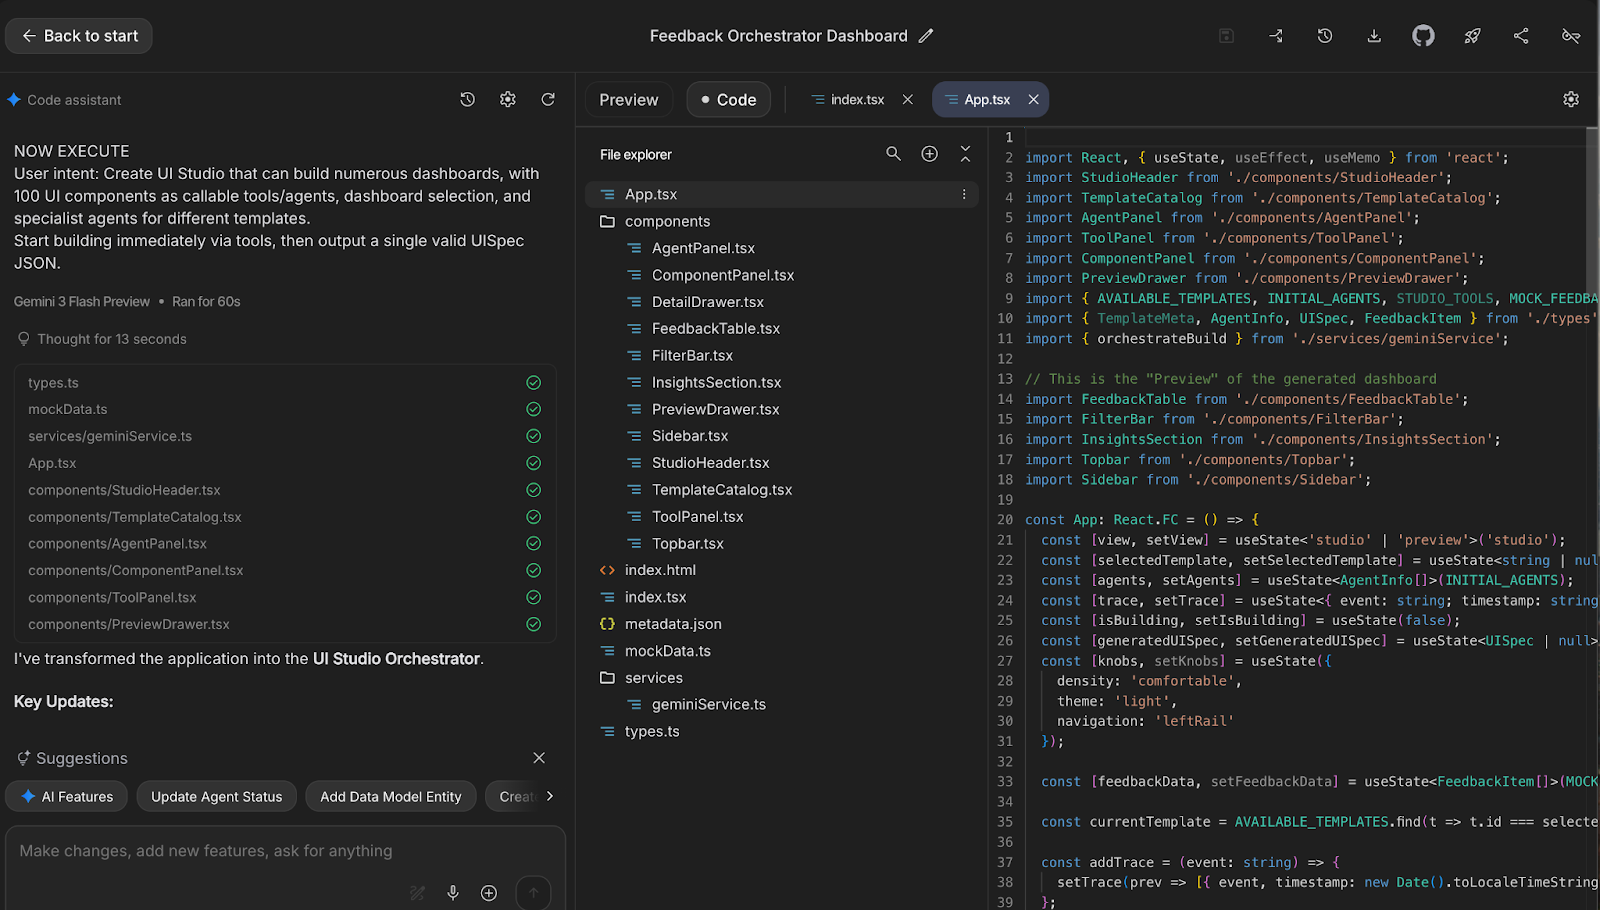
Here’s the high-level flow of how the UI Studio app triggers Gemini 3 Flash and renders the generated dashboard:
App.tsx opens the Studio view and pulls the initial template catalog, tool registry, component catalog, and agent list from mockData.ts.services/geminiService.ts.UISpec, stored in state, and the UI switches into Preview mode.PreviewDrawer.tsx acts as an inspector panel where you can view the UISpec JSON and basic build stats.DetailDrawer.tsx and runs at the individual row level.analyzeFeedback() and suggestResolution() in geminiService.ts call Gemini again to produce structured classification and recommended actions.If you are interested in other key project files for understanding how the demo is wired, here’s some further detail:
These files define the project setup, type contracts, and seed data that keep the demo consistent and runnable.
package.json: Defines dependencies and scripts where we see React, Recharts, and the @google/genai SDK, along with dev scripts like vite, build, and preview.tsconfig.json: This contains the TypeScript compiler settings for React and bundler resolution. It keeps the project type-safe without emitting compiled TS during development.vite.config.ts: Vite dev and build config, including port setup and environment wiring. This file maps GEMINI_API_KEY into process.env.API_KEY, so the GenAI SDK can read it in the browser build.metadata.json: App metadata is used by the AI Studio for hosting. It gives the app a name, description, and required permissions.types.ts: This acts as the contract layer for the entire app, which defines types for templates, agents, tools, feedback rows, and the UISpec shape so the UI and model outputs remain consistent.mockData.ts: This file contains seed data for the Studio and Preview experience. It defines the template catalog, initial agent roster, tool registry, and mock feedback rows so the UI works even before any model call.This layer contains the Gemini integration and is where all model calls and structured responses are handled.
geminiService.ts: It has three core calls: the orchestrateBuild() function to generate a UISpec, and analyzeFeedback(), suggestResolution() function calls to power AI assistance.orchestrateBuild() currently targets gemini-3-pro-preview, while the other two calls use gemini-3-flash-preview, so you would swap this if you want the entire demo to be Flash-only.These React components render the Studio builder UI and the generated dashboard preview, including the JSON inspector and detail flows.
StudioHeader.tsx: This helps to render the Studio header and start building the CTA. It reflects the build state, so the user sees when the pipeline is running.TemplateCatalog.tsx: It shows template cards and lets the user select what dashboard they want to build. The selection updates the local state in App.tsx.AgentPanel.tsx: Agent panel displays “specialist agents” as status cards. In this demo, the status progression is driven by staged updates in App.tsx to make the workflow visible.ToolPanel.tsx: The Tool Panel helps to render the tool registry list from mockData.ts. It is the UI placeholder for showing tool availability and call counters.ComponentPanel.tsx: This is the UI representation of “components as tools,” and it is the natural place to add allow/deny toggles later.PreviewDrawer.tsx: It lets you view the UISpec JSON and basic stats, which makes the build trace debuggable.Topbar.tsx: This file holds the dashboard top navigation and search bar. It demonstrates how dashboard-level controls can exist alongside the studio-level knobs.Sidebar.tsx: It handles the left rail navigation for the rendered dashboard.FilterBar.tsx: This acts as a filter strip used to slice feedback data. FeedbackTable.tsx: This is the main table view for feedback items, where clicking a row triggers selection and opens the detail drawer experience.DetailDrawer.tsx: It calls analyzeFeedback() and suggestResolution() and renders the model output under the AI tab.InsightsSection.tsx: This file helps in rendering charts and summary insights view using Recharts.Here is a short demo video that walks through the full UI Studio workflow, including template selection, the Start Build flow, and the generated dashboard preview:
Top DataCamp Courses
Curso
Curso
Curso
Tutorial
François Aubry
Tutorial
Abid Ali Awan
Tutorial
Abid Ali Awan
Tutorial
Abid Ali Awan
Tutorial
Bex Tuychiev
Tutorial
François Aubry