Code along with us onCode Along
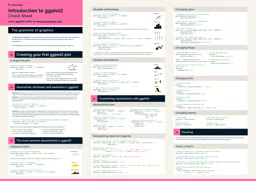
In this live code-along, you'll perform an exploratory data analysis on video game sales data. The focus is on creating visualizations with ggplot2 in order to answer business questions. You'll also get an overview of the core philosophy behind ggplot2, which will allow you to extend your skill to visualize almost anything.
Key takeaways
-
Learn to perform simple exploratory data analysis using tidyverse packages, including dplyr and ggplot2
-
Learn the core philosophy behind the ggplot2 data visualization package
-
Learn how to answer business questions using bar plots and line plots