Course
Introduction to R
4 hr
3M
If you want to take our Introduction to R course, here is the link.
You may remember from the chapter about matrices that all the elements that you put in a matrix should be of the same type. Back then, your data set on Star Wars only contained numeric elements.
When doing a market research survey, however, you often have questions such as:
logical)numeric)character)The output, namely the respondents' answers to the questions formulated above, is a data set of different data types. You will often find yourself working with data sets that contain different data types instead of only one.
A data frame has the variables of a data set as columns and the observations as rows. This will be a familiar concept for those coming from different statistical software packages such as SAS or SPSS.
Click 'Submit Answer'. The data from the built-in example data frame mtcars will be printed to the console.
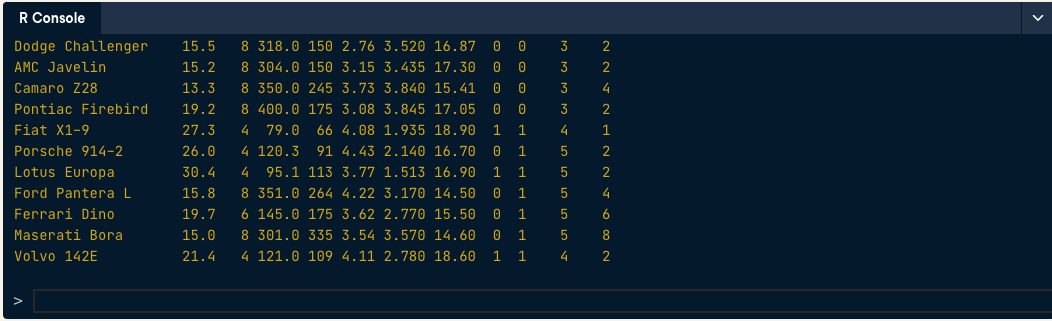
Wow, that is a lot of cars!
Working with large data sets is not uncommon in data analysis. When you work with (extremely) large data sets and data frames, your first task as a data analyst is to develop a clear understanding of its structure and main elements. Therefore, it is often useful to show only a small part of the entire data set.
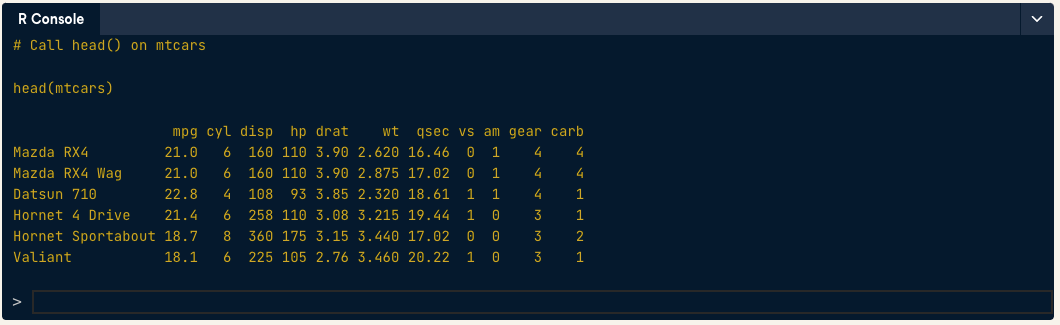
So how to do this in R? Well, the function head() enables you to show the first observations of a data frame. Similarly, the function tail() prints out the last observations in your data set.
Both head() and tail() print a top line called the 'header', which contains the names of the different variables in your data set.
Call head() on the mtcars data set to have a look at the header and the first observations.
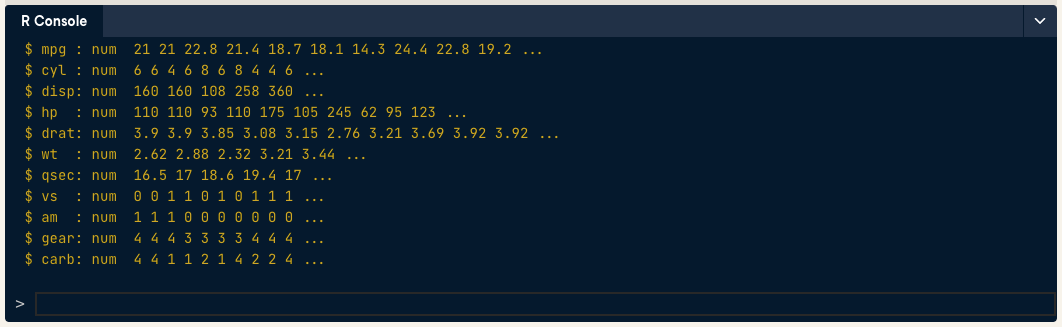
Another method that is often used to get a rapid overview of your data is the function str(). The function str() shows you the structure of your data set. For a data frame it tells you:
The total number of observations (e.g. 32 car types) The total number of variables (e.g. 11 car features) A full list of the variables names (e.g. mpg, cyl ... ) The data type of each variable (e.g. num) The first observations Applying the str() function will often be the first thing that you do when receiving a new data set or data frame. It is a great way to get more insight in your data set before diving into the real analysis.
Investigate the structure of mtcars. Make sure that you see the same numbers, variables, and data types as mentioned above.
Since using built-in data sets is not even half the fun of creating your own data sets, the rest of this chapter is based on your personally developed data set. Put your jet pack on because it is time for some space exploration!
As a first goal, you want to construct a data frame that describes the main characteristics of eight planets in our solar system. According to your good friend Buzz, the main features of a planet are:
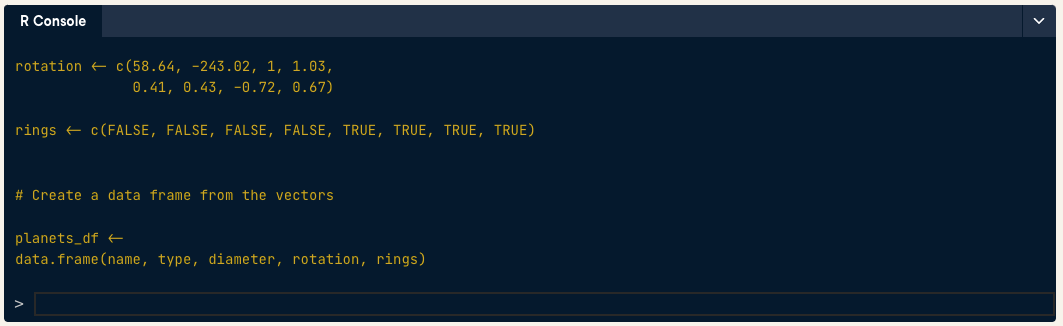
After doing some high-quality research on Wikipedia, you feel confident enough to create the necessary vectors: name, type, diameter, rotation and rings; these vectors have already been coded up on the right. The first element in each of these vectors correspond to the first observation.
You construct a data frame with the data.frame() function. As arguments, you pass the vectors from before: they will become the different columns of your data frame. Because every column has the same length, the vectors you pass should also have the same length. But don't forget that it is possible (and likely) that they contain different types of data.
Use the function data.frame() to construct a data frame. Pass the vectors name, type, diameter, rotation and rings as arguments to data.frame(), in this order. Call the resulting data frame planets_df.
If you want to learn more from this course, here is the link
Related Courses in R
Course
Course
Course
Tutorial
Ryan Sheehy
Tutorial
Karlijn Willems
Tutorial
Ryan Sheehy
Tutorial
Ryan Sheehy
Tutorial
Olivia Smith