
Tracks
Cơ bản về Học máy trong R
24 giờ
Bản thân phân cụm không phải là một thuật toán cụ thể mà là nhiệm vụ tổng quát cần giải quyết. Bạn có thể đạt mục tiêu này bằng nhiều thuật toán khác nhau, vốn khác biệt đáng kể trong cách hiểu thế nào là một cụm và cách tìm chúng hiệu quả.
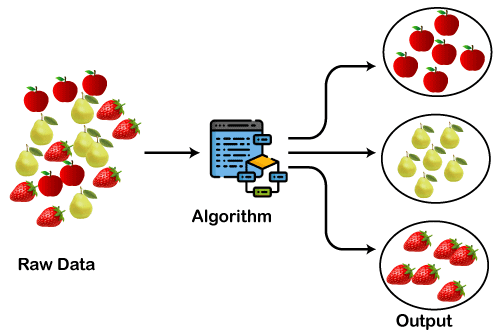
Trước khi đi sâu vào chi tiết thuật toán, hãy xây dựng trực giác về phân cụm bằng ví dụ đồ chơi với các bộ dữ liệu trái cây. Giả sử chúng ta có một bộ sưu tập lớn các bộ dữ liệu hình ảnh chứa ba loại trái cây: (i) dâu tây, (ii) lê và (iii) táo.
Trong bộ dữ liệu, tất cả hình ảnh bị trộn lẫn, và trường hợp sử dụng của bạn là nhóm các trái cây giống nhau lại với nhau, tức là tạo ba nhóm, mỗi nhóm chứa một loại trái cây. Đây chính xác là những gì một thuật toán phân cụm sẽ làm.
Không giống như các bài toán học có giám sát như phân loại hoặc hồi quy, phân cụm không thể tự động hóa hoàn toàn từ đầu đến cuối. Thay vào đó, đây là một quá trình lặp lại để khám phá thông tin, đòi hỏi chuyên môn miền và phán đoán của con người, thường xuyên được dùng để điều chỉnh dữ liệu và tham số mô hình nhằm đạt kết quả mong muốn.
Quan trọng nhất, vì phân cụm là học không giám sát và không sử dụng dữ liệu gán nhãn, chúng ta không thể tính các chỉ số hiệu năng như accuracy, AUC, RMSE, v.v. để so sánh giữa các thuật toán hoặc kỹ thuật tiền xử lý dữ liệu. Do đó, việc đánh giá hiệu năng của các mô hình phân cụm trở nên rất thách thức và mang tính chủ quan.
Các tiêu chí thành công chủ chốt của mô hình phân cụm xoay quanh:
Không có dữ liệu gán nhãn, bạn không thể tính accuracy hoặc AUC. Hai chỉ số giúp định lượng mức độ tách biệt của các cụm. Hai thước đo phổ biến:
Cả hai đều có trong scikit-learn: sklearn.metrics.silhouette_score(X, labels) và sklearn.metrics.davies_bouldin_score(X, labels).
K-Means là thuật toán được dùng rộng rãi nhất cho các tác vụ phân cụm, phần lớn vì các bước dễ theo dõi và triển khai trong scikit-learn rất trực quan. Đây là thuật toán dựa trên tâm cụm, nơi người dùng phải xác định số lượng cụm cần tạo.
Thường con số này đến từ bài toán kinh doanh hoặc bằng cách thử các giá trị khác nhau cho số cụm rồi đánh giá đầu ra.
Phân cụm K-Means là thuật toán lặp tạo ra các cụm không chồng lắp, nghĩa là mỗi quan sát trong bộ dữ liệu chỉ thuộc về một cụm duy nhất. Cách dễ nhất để nắm trực giác của K-Means là hiểu các bước kèm theo sơ đồ ví dụ bên dưới. Bạn cũng có thể xem mô tả chi tiết trong các hướng dẫn K-Means Clustering bằng Python và K-Means Clustering bằng R.
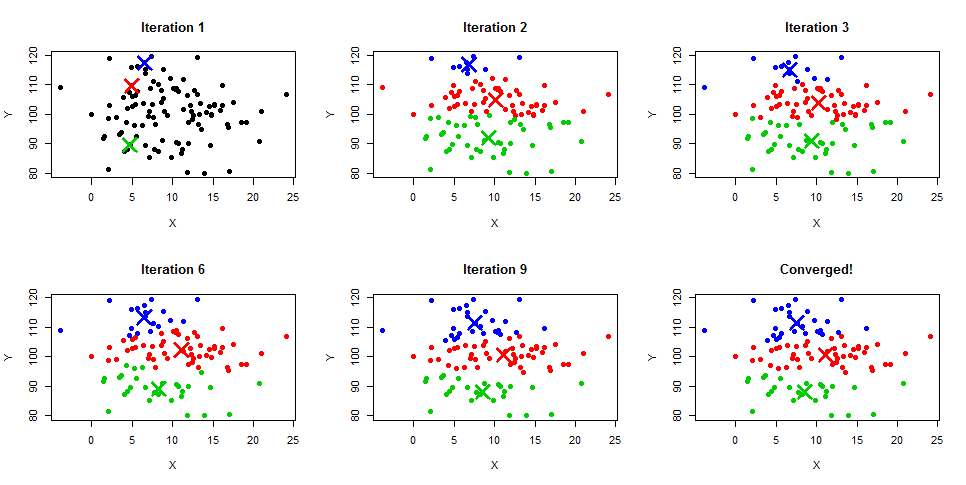
Nguồn ảnh: Learnbymarketing.com
Không giống K-Means, thuật toán MeanShift không cần chỉ định số lượng cụm. Bản thân thuật toán tự động xác định số cụm, đây là một lợi thế rõ ràng so với K-Means khi bạn không biết dữ liệu có bao nhiêu cụm.
MeanShift cũng dựa trên tâm cụm và gán các điểm dữ liệu vào cụm theo cách lặp. Trường hợp sử dụng phổ biến nhất của MeanShift là các tác vụ phân đoạn ảnh.
Thuật toán MeanShift dựa trên ước lượng mật độ hạt nhân. Tương tự K-Means, MeanShift lặp gán từng điểm dữ liệu về phía tâm cụm gần nhất, các tâm được khởi tạo ngẫu nhiên, và mỗi điểm được di chuyển dần trong không gian đến nơi có mật độ điểm cao nhất, tức Mode (mode là vùng có mật độ điểm dữ liệu cao nhất, trong ngữ cảnh MeanShift).
Vì vậy, MeanShift còn được gọi là thuật toán tìm mode (Mode-seeking). Các bước của MeanShift như sau:
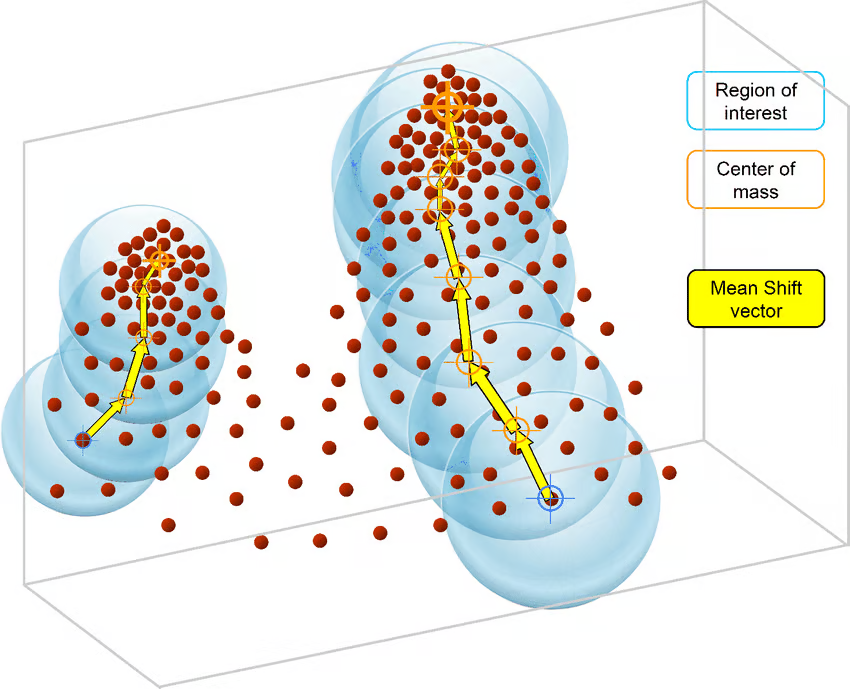
Nguồn ảnh: ResearchGate
Để xem hướng dẫn từng bước về MeanShift trong thực tế, hãy xem hướng dẫn Mean Shift Clustering của chúng tôi.
DBSCAN, viết tắt của Density-Based Spatial Clustering of Applications with Noise, là một thuật toán phân cụm không giám sát hoạt động dựa trên tiền đề rằng các cụm là những vùng có mật độ dày, được ngăn cách bởi các vùng có mật độ thấp hơn.
Ưu điểm lớn nhất của thuật toán này so với K-Means và MeanShift là khả năng chống chịu ngoại lệ (outlier), nghĩa là nó sẽ không đưa các điểm ngoại lệ vào bất kỳ cụm nào.
Các thuật toán DBSCAN chỉ cần hai tham số từ người dùng:
Bán kính hình tròn được tạo xung quanh mỗi điểm dữ liệu, còn gọi là epsilon
minPoints, xác định số điểm dữ liệu tối thiểu cần có trong hình tròn đó để điểm dữ liệu được phân loại là điểm Lõi (Core).
Mỗi điểm dữ liệu được bao quanh bởi một hình tròn bán kính epsilon, và DBSCAN xác định chúng là điểm Lõi (Core), điểm Biên (Border) hoặc điểm Nhiễu (Noise). Một điểm dữ liệu được coi là điểm Lõi nếu hình tròn bao quanh nó có số điểm tối thiểu theo tham số minPoints.
Nếu số điểm thấp hơn mức tối thiểu, nó được coi là điểm Biên; và được coi là Nhiễu nếu không có điểm dữ liệu nào khác nằm trong bán kính epsilon của bất kỳ điểm nào. Các điểm nhiễu không được xếp vào cụm nào (thực chất là outlier).
Một số trường hợp sử dụng phổ biến của DBSCAN:
So sánh DBSCAN với K-Means, những khác biệt thường gặp là:
Bạn có thể tìm hiểu thêm trong hướng dẫn thuật toán phân cụm DBSCAN của chúng tôi, bao gồm tinh chỉnh tham số và ví dụ thực hành.
Nguồn ảnh: Medium
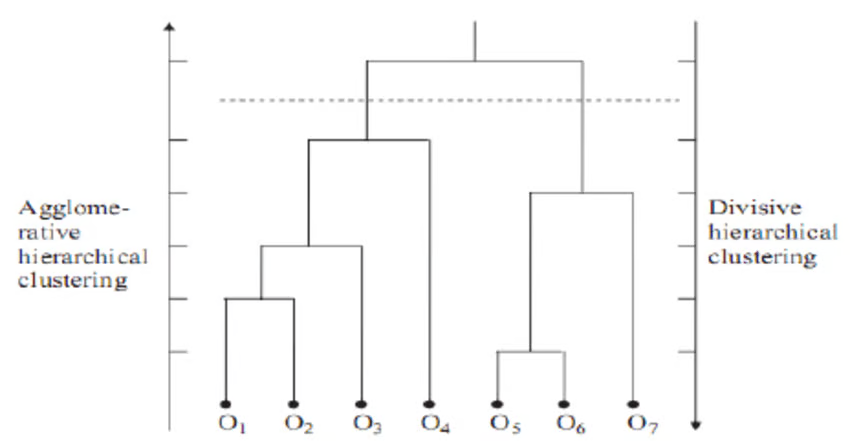
Phân cụm phân cấp là phương pháp phân cụm xây dựng hệ thống phân cấp các cụm. Có hai kiểu của phương pháp này.
Khi phân tích dữ liệu từ mạng xã hội, phân cụm phân cấp là phương pháp phổ biến nhất. Các nút (nhánh) trong đồ thị được so sánh với nhau tùy theo mức độ tương đồng giữa chúng. Bằng cách liên kết các nhóm nút nhỏ có liên quan, có thể tạo ra các nhóm lớn hơn.
Ưu điểm lớn nhất của phân cụm phân cấp là dễ hiểu và triển khai. Thông thường, đầu ra của phương pháp này được phân tích dưới dạng hình ảnh như bên dưới. Nó được gọi là Dendrogram.
Bạn có thể tìm hiểu thêm trong hướng dẫn phân cụm phân cấp của chúng tôi, hướng dẫn cách xây dựng và đọc dendrogram trong Python.
Nguồn ảnh: ResearchGate
BIRCH là viết tắt của Balanced Iterative Hierarchical Based Clustering. Nó được dùng cho các bộ dữ liệu rất lớn nơi K-Means khó có thể mở rộng. Thuật toán BIRCH chia dữ liệu lớn thành các cụm nhỏ và cố gắng giữ lại tối đa thông tin có thể. Các nhóm nhỏ sau đó được phân cụm để tạo đầu ra cuối cùng thay vì phân cụm trực tiếp bộ dữ liệu lớn.
BIRCH thường được dùng để bổ trợ các thuật toán phân cụm khác bằng cách tạo bản tóm tắt thông tin mà các thuật toán khác có thể sử dụng. Người dùng phải xác định số lượng cụm để huấn luyện BIRCH, tương tự như trong K-Means.
Một lợi ích khi dùng BIRCH là nó có thể phân cụm dần dần và động các điểm dữ liệu đa chiều. Điều này nhằm tạo ra các cụm chất lượng cao nhất trong giới hạn bộ nhớ và thời gian cho phép. Trong hầu hết trường hợp, BIRCH chỉ cần duyệt cơ sở dữ liệu một lần, giúp BIRCH có khả năng mở rộng.
Trường hợp sử dụng phổ biến nhất của BIRCH là một lựa chọn tiết kiệm bộ nhớ thay thế cho K-Means, có thể dùng để phân cụm các bộ dữ liệu lớn mà K-Means không xử lý được do hạn chế bộ nhớ hoặc tính toán.
Phân cụm có ứng dụng rộng rãi trong nhiều ngành: truyền thông, chăm sóc sức khỏe, sản xuất, bán lẻ và bất cứ nơi nào có lượng lớn dữ liệu chưa gán nhãn. Dưới đây là một số ví dụ thực tiễn.
Khách hàng được phân loại bằng thuật toán phân cụm theo hành vi mua sắm hoặc sở thích để xây dựng các chiến dịch tiếp thị tập trung.
Hãy tưởng tượng bạn có 10 triệu khách hàng và muốn xây dựng các chiến dịch tiếp thị tùy biến hoặc tập trung. Khó có khả năng bạn sẽ tạo 10 triệu chiến dịch, vậy ta làm gì? Ta có thể dùng phân cụm để nhóm 10 triệu khách hàng thành 25 cụm rồi thiết kế 25 chiến dịch thay vì 10 triệu.
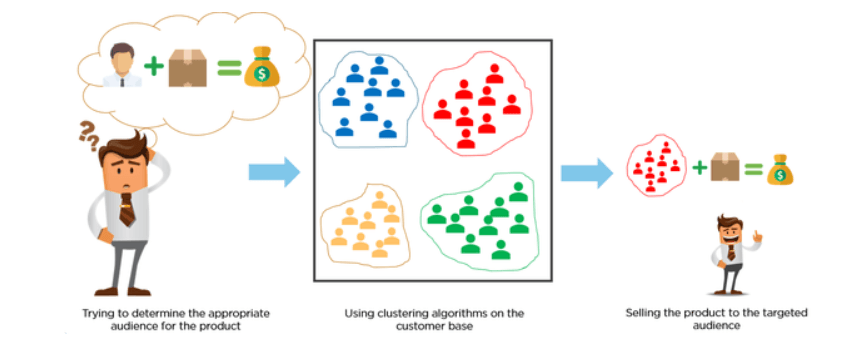
Nguồn ảnh: Medium
Có nhiều cơ hội áp dụng phân cụm trong bán lẻ. Ví dụ, bạn có thể thu thập dữ liệu cho từng cửa hàng và phân cụm ở cấp cửa hàng để tạo insight cho biết những địa điểm nào tương tự nhau dựa trên các thuộc tính như lưu lượng khách, doanh số trung bình, số lượng SKU, v.v.
Một ví dụ khác là phân cụm ở cấp danh mục. Trong sơ đồ dưới đây, chúng ta có tám cửa hàng. Các màu khác nhau đại diện cho các cụm khác nhau. Có bốn cụm trong ví dụ này.
Lưu ý danh mục lăn khử mùi ở Cửa hàng 1 thuộc cụm màu đỏ, trong khi ở Cửa hàng 2 thuộc cụm màu xanh dương. Điều này cho thấy Cửa hàng 1 và Cửa hàng 2 có thị trường mục tiêu hoàn toàn khác nhau đối với danh mục lăn khử mùi.
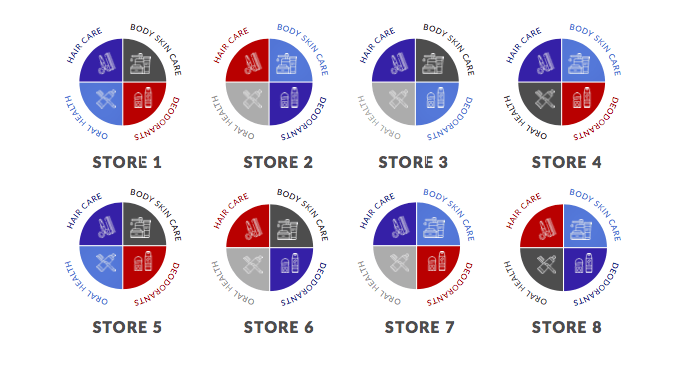
Nguồn ảnh: dotactiv.com
Y tế và khoa học lâm sàng có các ứng dụng phân cụm đặc biệt mạnh. Một ví dụ là nghiên cứu của Komaru & Yoshida et al. 2020, nơi họ thu thập dữ liệu nhân khẩu học và xét nghiệm cho 101 bệnh nhân và sau đó phân khúc thành 3 cụm.
Mỗi cụm đại diện cho các tình trạng khác nhau. Ví dụ, cụm 1 có bệnh nhân với WBC & CRP thấp. Cụm 2 có bệnh nhân với BMP & Serum cao, và Cụm 3 có bệnh nhân với Serum thấp. Mỗi cụm thể hiện quỹ đạo sống sót khác nhau xét theo tỷ lệ tử vong trong 1 năm sau lọc máu.
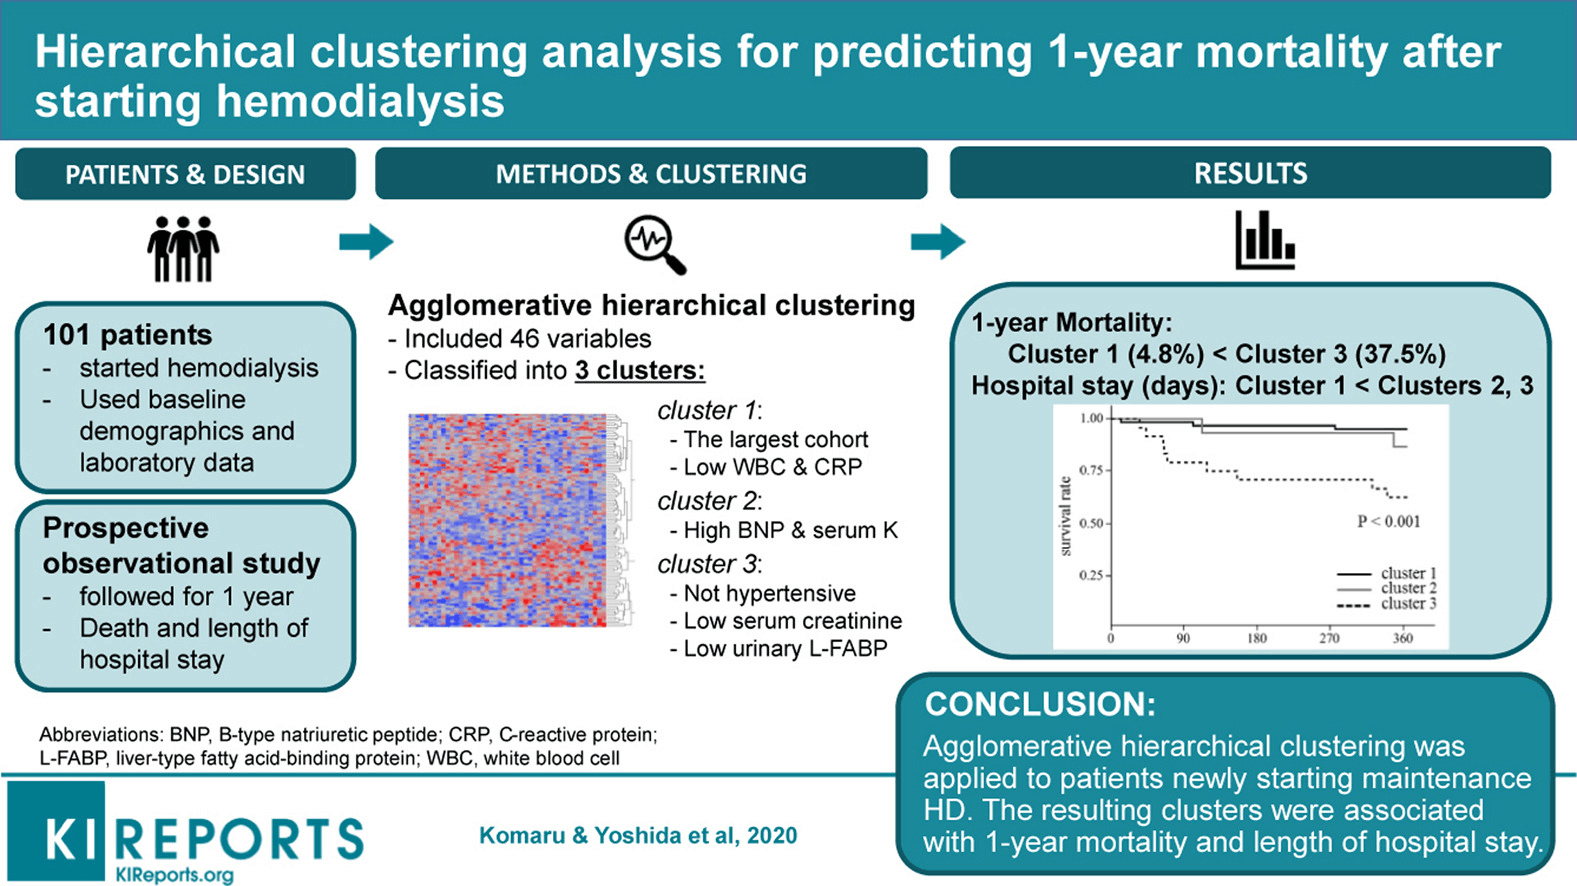
Nguồn ảnh: elsevierhealth.com
Phân đoạn ảnh là việc phân loại một hình ảnh thành các nhóm khác nhau. Nhiều nghiên cứu đã được thực hiện trong lĩnh vực phân đoạn ảnh bằng phân cụm. Kiểu phân cụm này hữu ích nếu bạn muốn tách các đối tượng trong ảnh để phân tích từng đối tượng riêng lẻ xem đó là gì.
Trong ví dụ dưới đây, bên trái là ảnh gốc và bên phải là kết quả của thuật toán phân cụm. Bạn có thể thấy rõ có 4 cụm, tương ứng 4 đối tượng khác nhau trong ảnh được xác định dựa trên pixel (hổ, cỏ, nước và cát).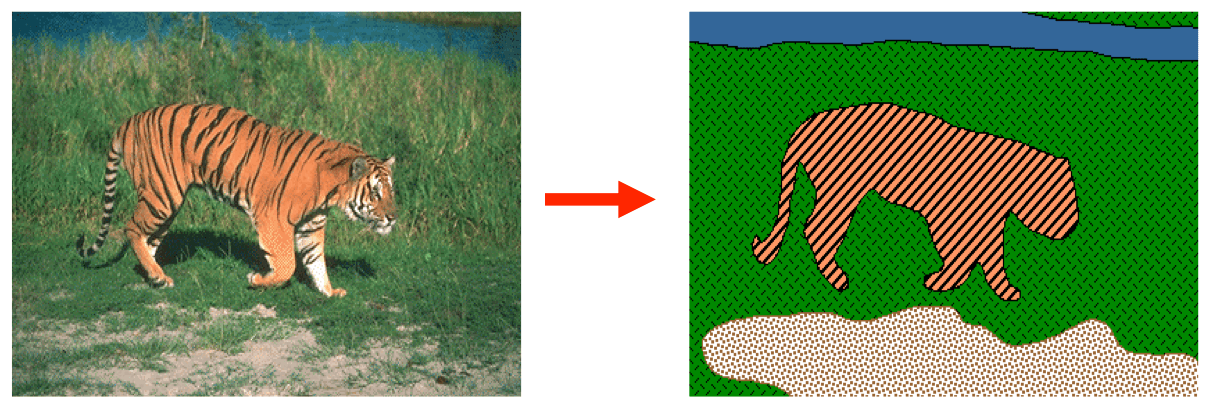
Có 10 thuật toán phân cụm không giám sát được triển khai trong scikit-learn, một thư viện machine learning phổ biến trong Python. Có những khác biệt cơ bản trong cách mỗi thuật toán xác định và gán cụm trong bộ dữ liệu.
Khác biệt nền tảng trong phương thức toán học của các thuật toán này quy về bốn khía cạnh có thể dùng để so sánh:
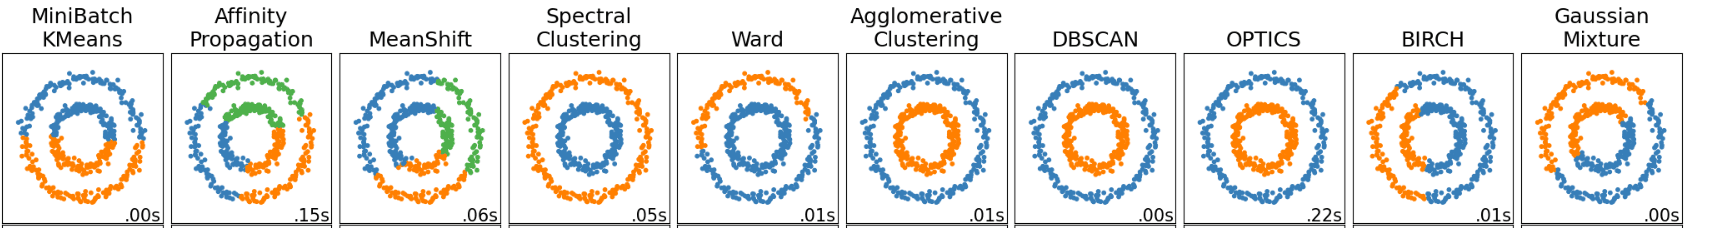
Trong sơ đồ dưới đây, mỗi cột đại diện đầu ra từ một thuật toán phân cụm khác nhau như K-Means, Affinity Propagation, MeanShift, v.v. Tổng cộng có 10 thuật toán được huấn luyện trên cùng một bộ dữ liệu.
Một số thuật toán cho ra đầu ra giống nhau. Lưu ý Agglomerative Clustering, DBSCAN, OPTICS và Spectral Clustering tạo ra cùng một cụm.
Tuy nhiên, nếu bạn so sánh đầu ra của K-Means với MeanShift, bạn sẽ thấy hai thuật toán cho kết quả khác nhau. Với K-Means, chỉ có hai nhóm (cụm: xanh dương và cam), trong khi với MeanShift có ba, tức xanh dương, xanh lá và cam.
Nguồn ảnh: scikit-learn
Đáng tiếc (hoặc may mắn), không có đáp án đúng hay sai trong phân cụm. Sẽ thật đơn giản nếu có thể khẳng định “Thuật toán X hoạt động tốt nhất ở đây.”
Điều này là không thể, và chính vì thế phân cụm là một nhiệm vụ rất thách thức.
Cuối cùng, thuật toán nào tốt hơn không phụ thuộc vào một thước đo dễ đo lường nào, mà phụ thuộc vào cách diễn giải và mức độ hữu ích của đầu ra cho bài toán cụ thể.
Mỗi thuật toán phù hợp với những điều kiện dữ liệu khác nhau. Hãy dùng bảng này làm điểm khởi đầu, sau đó thử ít nhất hai thuật toán trên dữ liệu thực của bạn trước khi quyết định.
| Algorithm | When to use it | Key limitation | Parameters required |
|---|---|---|---|
| K-Means | Bộ dữ liệu lớn với các cụm gần dạng cầu | Nhạy với ngoại lệ; cần k từ đầu |
Số lượng cụm (k) |
| MeanShift | Không biết số cụm; phân đoạn ảnh | Chậm trên bộ dữ liệu lớn; băng thông khó thiết lập | Băng thông (có thể ước lượng tự động) |
| DBSCAN | Dữ liệu nhiễu; hình dạng cụm bất quy tắc; phát hiện bất thường | Gặp khó khi các cụm có mật độ rất khác nhau | epsilon, minPoints |
| Hierarchical | Phân tích thăm dò; dữ liệu mạng xã hội; bộ dữ liệu nhỏ | Tốn bộ nhớ; không mở rộng tới hàng triệu dòng | Phương pháp liên kết (ward, complete, average) |
| BIRCH | Bộ dữ liệu rất lớn nơi K-Means thiếu bộ nhớ | Kém chính xác hơn K-Means trên bộ dữ liệu nhỏ | Hệ số phân nhánh, ngưỡng, số lượng cụm |
Một điểm bắt đầu thực tiễn: thử K-Means trước vì tốc độ, chuyển sang DBSCAN nếu dữ liệu có hình dạng bất quy tắc hoặc nhiều ngoại lệ, và dùng phân cụm Phân cấp khi bạn muốn khám phá cấu trúc cụm trực quan qua dendrogram trước khi chọn k.
Phân cụm khó áp dụng hơn các kỹ thuật có giám sát như phân loại và hồi quy vì hai lý do: bạn không thể đo hiệu năng so với mục tiêu gán nhãn, và các tham số như số lượng cụm đòi hỏi phán đoán chuyên môn thay vì lựa chọn tự động từ thuật toán.
Phân cụm là một kỹ năng giá trị cho nhiều vai trò: nhà khoa học dữ liệu, kỹ sư ML và nhà phân tích đều gặp các bài toán mà phân cụm có thể giải quyết.
Nếu bạn muốn tìm hiểu thêm về Phân cụm và học không giám sát, cũng như cách triển khai bằng Python và R, các khóa học dưới đây có thể giúp bạn tiến bộ:
Khóa học về Machine Learning
Tracks
Tracks
Courses
blogs
Matt Crabtree
10 phút