Track
Machine Learning Fundamentals in R
24 hr
Clustering itself is not one specific algorithm but the general task to be solved. You can achieve this goal using various algorithms that differ significantly in their understanding of what constitutes a cluster and how to find them efficiently.
Before diving into algorithmic details, let’s just build an intuition behind clustering using a toy example of fruit datasets. Let’s say we have a huge collection of image datasets containing three fruits: (i) strawberries, (ii) pears, and (iii) apples.
In the dataset, all the images are mixed up, and your use case is to group similar fruits together, i.e., create three groups with each one of them containing one type of fruit. This is exactly what a clustering algorithm will do.
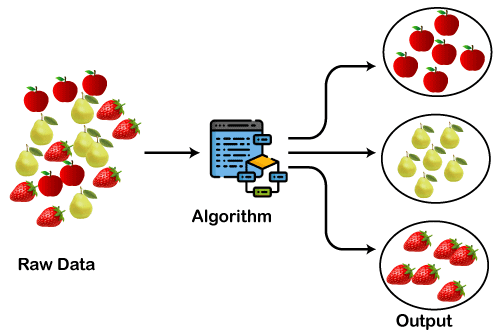
Image Source: javatpoint.com
Clustering, unlike supervised learning use-cases such as classification or regression, cannot be completely automated end-to-end. Instead, it is an iterative process of information discovery that requires domain expertise and human judgment, used frequently to make adjustments to the data and the model parameters to achieve the desired result.
Most importantly, because clustering is unsupervised learning and doesn’t use labeled data, we cannot calculate performance metrics like accuracy, AUC, RMSE, etc., to compare different algorithms or data preprocessing techniques. As a result, this makes it really challenging and subjective to assess the performance of clustering models.
The key success criteria in clustering models revolve around:
Without labeled data, you can't calculate accuracy or AUC. Two metrics help quantify how well your clusters are separated. Two common measures:
Both are available in scikit-learn: sklearn.metrics.silhouette_score(X, labels) and sklearn.metrics.davies_bouldin_score(X, labels).
K-Means is the most widely used algorithm for clustering tasks, largely because the steps are easy to follow and the scikit-learn implementation is straightforward. It is a centroid-based algorithm where the user must define the required number of clusters it wants to create.
This normally comes from a business use case or by trying different values for the number of clusters and then evaluating the output.
K-Means clustering is an iterative algorithm that creates non-overlapping clusters, meaning each instance in your dataset can only belong to one cluster exclusively. The easiest way to get the intuition of the K-Means algorithm is to understand the steps along with the example diagram below. You can also get a detailed description of the process in our K-Means Clustering in Python and K-Means Clustering in R tutorials.
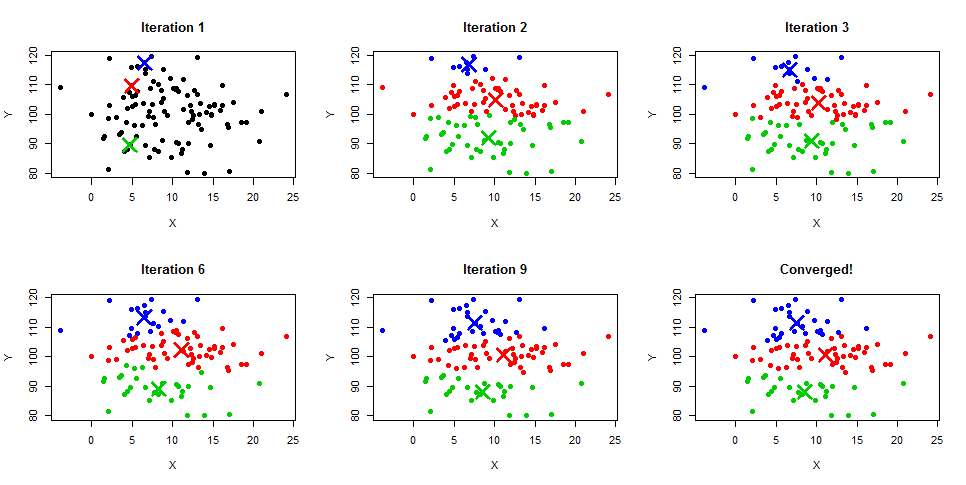
Image Source: Learnbymarketing.com
Unlike the K-Means algorithm, MeanShift algorithm does not require specifying the number of clusters. The algorithm itself automatically determines the number of clusters, which is a clear advantage over K-Means when you don't know how many clusters your data contains.
MeanShift is also based on centroids and iteratively assigns each data point to clusters. The most common use case for MeanShift clustering is image segmentation tasks.
The MeanShift algorithm is based on kernel density estimation. Similar to the K-Means algorithm, MeanShift algorithms iteratively assign each data point towards the closest cluster centroid, which are initialized randomly, and each point is iteratively moved in the space based on where the most points are, i.e., the Mode (mode is the highest density of data points in the region, in the context of the MeanShift).
This is why the MeanShift algorithm is also known as the Mode-seeking algorithm. The steps of the MeanShift algorithm are as follows:
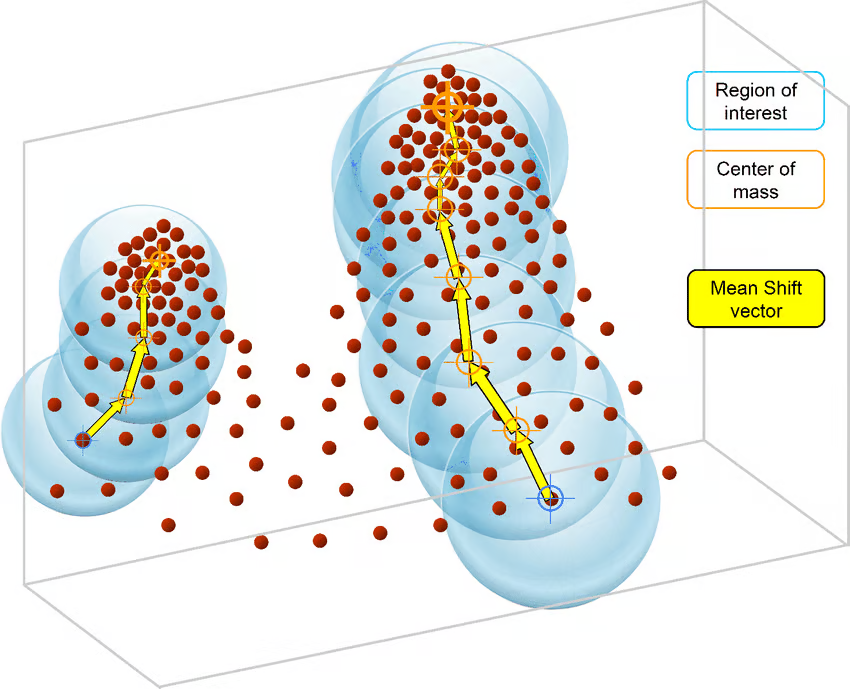
Image Source: ResearchGate
For a step-by-step walkthrough of MeanShift in practice, see our Mean Shift Clustering tutorial.
DBSCAN, or Density-Based Spatial Clustering of Applications with Noise, is an unsupervised clustering algorithm that works on the premise that clusters are dense spaces in the region separated by lower-density regions.
The biggest advantage of this algorithm over K-Means and MeanShift is that it is robust to outliers, meaning it will not include outlier data points in any cluster.
DBSCAN algorithms require only two parameters from the user:
The radius of the circle to be created around each data point, also known as epsilon
minPoints, which defines the minimum number of data points required inside that circle for that data point to be classified as a Core point.
Every data point is surrounded by a circle with a radius of epsilon, and DBSCAN identifies them as being either a Core point, Border point, or Noise point. A data point is considered to be a Core point if the circle that surrounds it has a minimum number of points specified by the minPoints parameter.
It is considered a Border Point if the number of points is lower than the minimum required, and it is considered Noise if there are no additional data points located within an epsilon radius of any data point. Noise data points are not categorized in any cluster (basically, they are outliers).
Some of the common use-cases for the DBSCAN clustering algorithm are:
Comparing DBSCAN with K-Means algorithms, the most common differences are:
You can learn more in our DBSCAN clustering algorithm guide, which covers parameter tuning and worked examples.
Image Source: Medium
Hierarchical clustering is a method of clustering that builds a hierarchy of clusters. There are two types of this method.
When it comes to analyzing data from social networks, hierarchical clustering is by far the most common and popular method of clustering. The nodes (branches) in the graph are compared to each other depending on the degree of similarity that exists between them. By linking together smaller groups of nodes that are related to one another, larger groupings may be created.
The biggest advantage of hierarchical clustering is that it is easy to understand and implement. Usually, the output of this clustering method is analyzed in an image, such as the one below. It is called a Dendrogram.
You can learn more in our hierarchical clustering tutorial, which walks through building and reading dendrograms in Python.
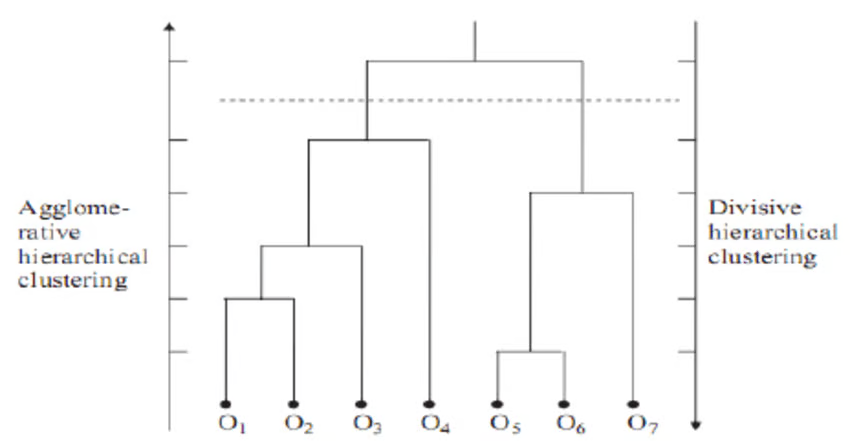
Image Source: ResearchGate
BIRCH stands for Balanced Iterative Hierarchical Based Clustering. It is used on very large datasets where K-Means cannot practically scale. The BIRCH algorithm divides large data into small clusters and tries to retain the maximum amount of information possible. Smaller groups are then clustered for a final output instead of clustering the large datasets directly.
BIRCH is often used to supplement other clustering algorithms by generating a summary of the information that the other clustering algorithms can utilize. Users have to define the number of clusters for training the BIRCH algorithm, similar to how we define it in K-Means.
One of the benefits of using BIRCH is that it can progressively and dynamically cluster multi-dimensional data points. This is done to create the highest quality clusters under a given memory and time constraints. In most cases, BIRCH just needs to do one search across the database, which makes BIRCH scalable.
The most common use case of the BIRCH clustering algorithm is that it is a memory-efficient alternative to K-Means that can be used to cluster large datasets that cannot be handled through K-Means due to memory or compute limitations.
Clustering has broad applications across industries: media, healthcare, manufacturing, retail, and anywhere you have large amounts of unlabeled data. Here are some practical examples.
Customers are categorized by using clustering algorithms according to their purchasing behavior or interests to develop focused marketing campaigns.
Imagine you have 10M customers, and you want to develop customized or focused marketing campaigns. It is unlikely that you will develop 10M marketing campaigns, so what do we do? We could use clustering to group 10M customers into 25 clusters and then design 25 marketing campaigns instead of 10M.
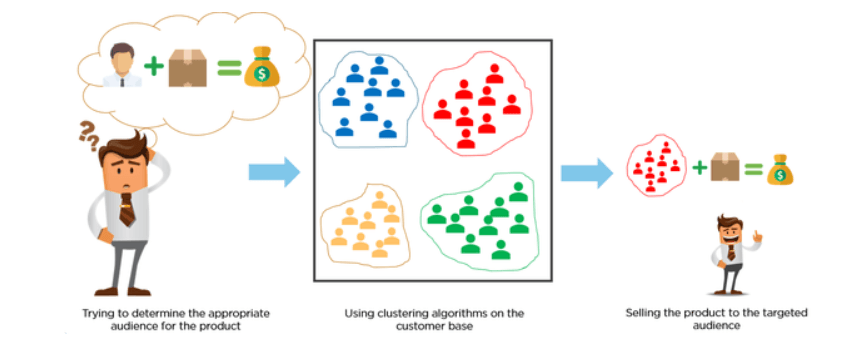
Image Source: Medium
There are many opportunities for clustering in retail businesses. For example, you can gather data on each store and cluster at store level to generate insights that may tell you which locations are similar to each other based on attributes like foot traffic, average store sales, number of SKUs, etc.
Another example could be clustering at a category level. In the diagram below, we have eight stores. Different colors represent different clusters. There are four clusters in this example.
Notice that the deodorants category in Store 1 is represented by the red cluster, whereas the deodorants category in Store 2 is represented by the blue cluster. This depicts that Store 1 and Store 2 have completely different target markets for the deodorants category.
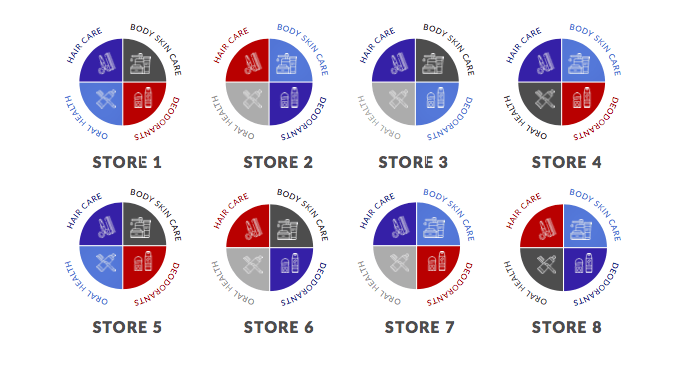
Image source: dotactiv.com
Healthcare and clinical science offer particularly strong clustering applications. One such example is research published by Komaru & Yoshida et al. 2020, where they collected demographics and laboratory data for 101 patients and then segmented them into 3 clusters.
Each cluster was represented by different conditions. For example, cluster 1 has patients with Low WBC & CRP. Cluster 2 has patients with High BMP & Serum, and Cluster 3 has patients with Low Serum. Each cluster represents a different survival trajectory given the 1-year mortality after hemodialysis.
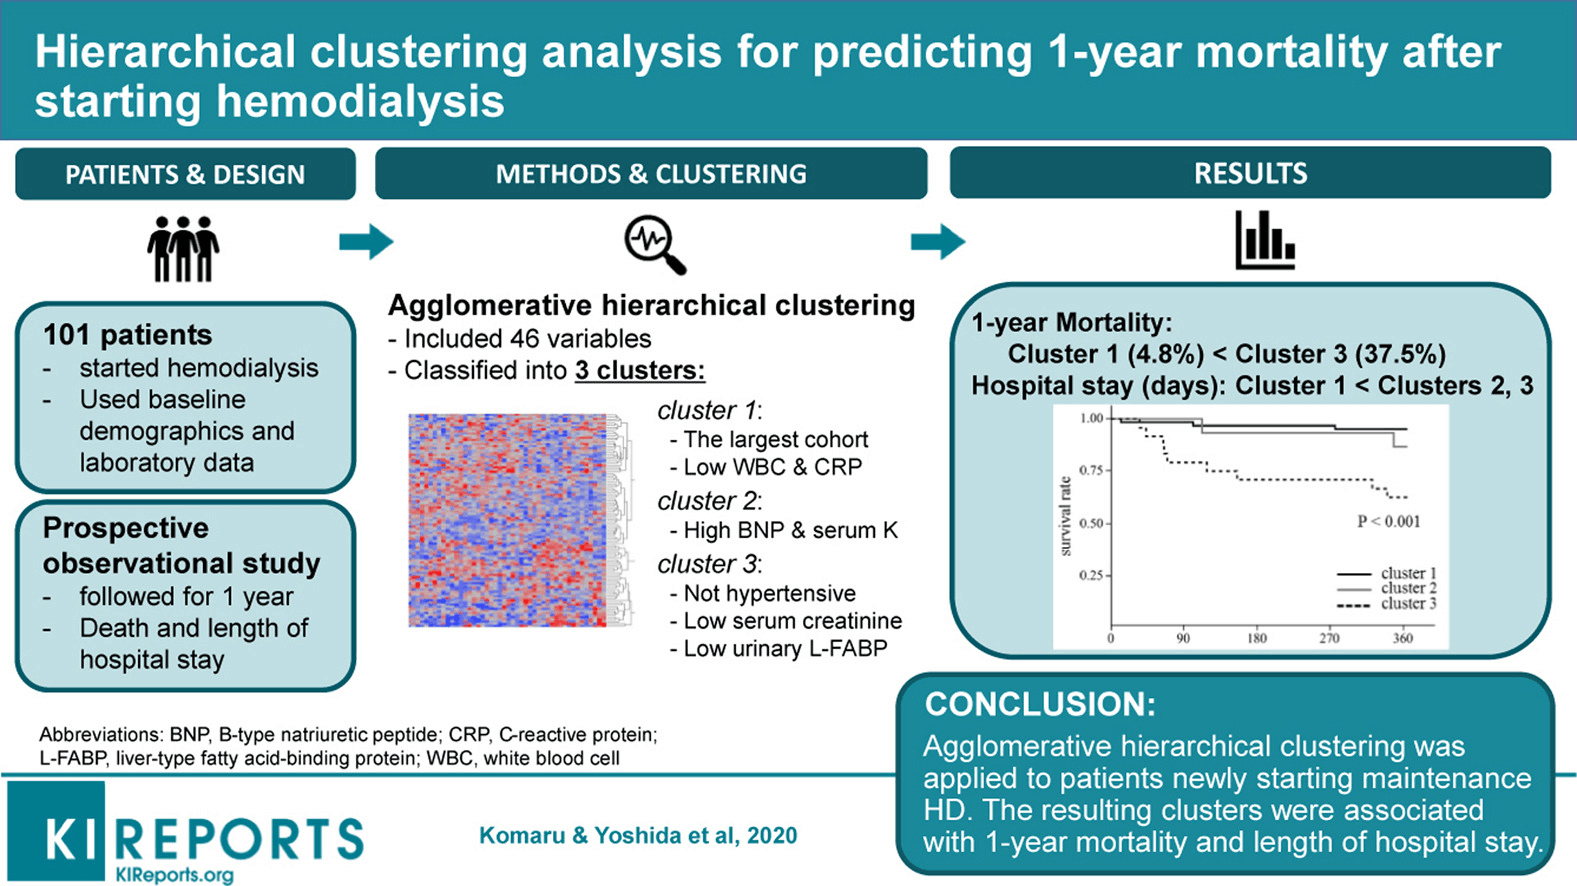
Image source: elsevierhealth.com
Image segmentation is the classification of an image into different groups. Much research has been done in the area of image segmentation using clustering. This type of clustering is useful if you want to isolate objects in an image to analyze each object individually to check what it is.
In the example below, the left-hand side represents the original image, and the right-hand side is the result of the clustering algorithm. You can clearly see there are 4 clusters which are 4 different objects in the image determined based on the pixels (tiger, grass, water, and sand).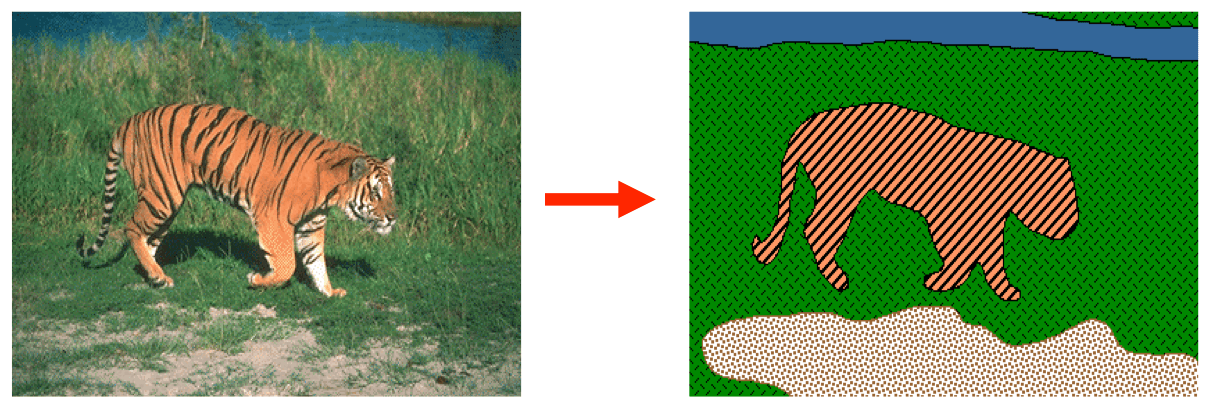
There are 10 unsupervised clustering algorithms implemented in scikit-learn, a popular machine learning library in Python. There are fundamental underlying differences in how each algorithm determines and assigns clusters in the dataset.
The underlying differences in the mathematical modality of these algorithms boil down to four aspects on which we can compare and contrast these algorithms:
In the diagram below, each column represents an output from a different clustering algorithm, such as K-Means, Affinity Propagation, MeanShift, etc. There are a total of 10 algorithms that are trained on the same dataset.
Some algorithms have yielded the same output. Notice that Agglomerative Clustering, DBSCAN, OPTICS, and Spectral Clustering have resulted in the same clusters.
However, if you notice and compare the output of K-Means with the output of the MeanShift algorithm, you will notice that both algorithms yielded different results. In the case of K-Means, there are only two groups (clusters: blue and orange), whereas in the case of MeanShift, there are three, i.e., blue, green, and orange.
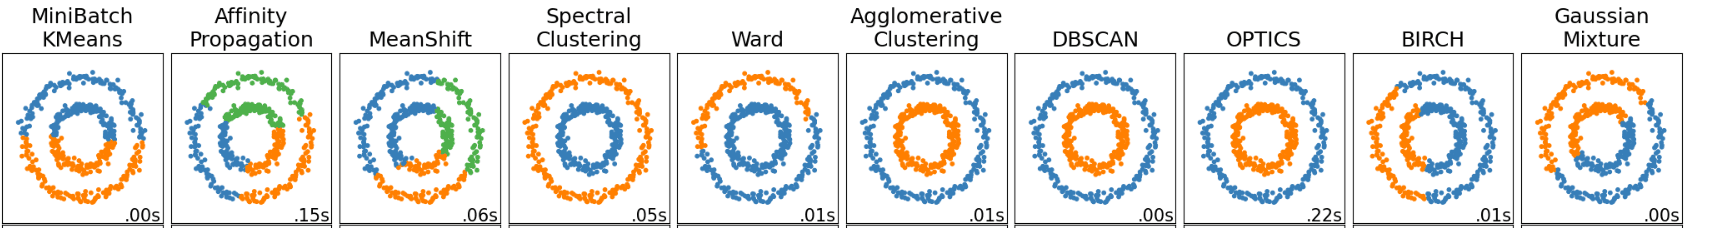
Image Source: scikit-learn
Unfortunately (or fortunately), there is no right or wrong answer in Clustering. It would have been so simple to determine and make a statement like “X Algorithm is performing best here.”
This is not possible, and it is because of this reason that clustering is a very challenging task.
Ultimately, which algorithm works better doesn’t depend on any metric that is easily measurable but rather on the interpretation and how useful the output is for the use case at hand.
Each algorithm suits different data conditions. Use this table as a starting point, then test at least two on your actual data before committing.
| Algorithm | When to use it | Key limitation | Parameters required |
|---|---|---|---|
| K-Means | Large datasets with roughly spherical clusters | Sensitive to outliers; needs k upfront |
Number of clusters (k) |
| MeanShift | Unknown cluster count; image segmentation | Slow on large datasets; bandwidth is tricky to set | Bandwidth (can be auto-estimated) |
| DBSCAN | Noisy data; irregular cluster shapes; anomaly detection | Struggles when clusters have very different densities | epsilon, minPoints |
| Hierarchical | Exploratory analysis; social network data; small datasets | Memory-intensive; does not scale to millions of rows | Linkage method (ward, complete, average) |
| BIRCH | Very large datasets where K-Means runs out of memory | Less accurate than K-Means on smaller datasets | Branching factor, threshold, number of clusters |
A practical starting point: try K-Means first for speed, switch to DBSCAN if your data has irregular shapes or outliers, and use Hierarchical clustering when you want to explore cluster structure visually through a dendrogram before choosing k.
Clustering is harder to apply than supervised techniques like classification and regression for two reasons: you can't measure performance against labeled targets, and parameters like the number of clusters require domain judgment rather than algorithmic selection.
Clustering is a valuable skill across roles: data scientists, ML engineers, and analysts all encounter problems that clustering can solve.
If you would like to learn more about Clustering and unsupervised machine learning and learn the implementation using Python and R language, the courses below can help you make progress:
Courses for Machine Learning
Track
Track
Course
blog
Kurtis Pykes
9 min
Tutorial
DataCamp Team
Tutorial
Vidhi Chugh
Tutorial
Rajesh Kumar
Tutorial
Eugenia Anello
Tutorial
Kevin Babitz