It can be challenging getting a data program off the ground, but without one, your business may not be able to synthesize important data to draw meaningful insights. Our recent DCVirtual conference dove into how to implement and measure a successful data-driven culture. DataCamp’s Curriculum Architect, Richie Cotton, spoke with AXA XL’s Head of Strategic Design, Data, Pricing and Analytics, Rachel Alt-Simmons, on this topic. Read on for some useful takeaways on why everyone needs to be data-driven, how to determine your data objectives, and how to implement a data program. You can also learn more about Strategies for Maximizing Data Upskilling Programs in our webinar.
Training 2 or more people? Check out our Business solutions
Get your team access to the full DataCamp library, with centralized reporting, assignments, projects and more

It’s everyone’s responsibility to be data-driven
In the 21st century, every organization needs to be data-driven to be competitive. Being data-driven is not about automating people out of their jobs, but providing them with the tools and information to be more effective in their roles.
We think of it as everyone's responsibility in the organization to be more data-driven. After all, every single one of us is probably touching data in some way, regardless of your role. We're continually looking at different opportunities we have to upscale resources and get them along in the journey.—Rachel Alt-Simmons, AXA XL
Data program success metrics depend on your industry and organization

There is no one-size-fits-all data program. Each data program’s objectives will vary depending on factors like industry, company size, and team structure.
Let’s use AXA XL as an example. AXA XL, acquired by AXA Group in 2018, is a large commercial and specialty insurance company that assesses complex ventures. They currently employ 13,000 people around the world working on distributed teams, which means many of their teams don’t actually work with most of their team members. Virtual collaboration is important across global locations, and as an insurance company, their data needs are highly reliant on paper and PDFs.
Our business runs on paper. We sell legal documents—that's what an insurance policy is, just a legal document. We intake paper and we generate paper. What happens is, for example, you get a submission in from a client, it contains tons and tons of files and information. You may get that information in a PDF, in Word documents, in Excel files, and probably every variation thereof. There's no standardization in how that document comes in, so there's not one standard PDF or one standard file. It's all different for every single client.
Because so much of their data is stored in PDFs and data entry is manual, not all the individual data elements are captured. A lot of information is lost or not easily retrievable. To address these issues, AXA XL leverages capabilities like natural language processing to grab documents and easily scrape information out of them.
How to implement a data program
1. Choose a top-down or bottom-up approach
The top-down approach to building a data program is related to the larger data and analytics initiatives within an organization. This requires strategically building out your program to standardize how analytic models and workflows are integrated across teams.
The bottom-up approach is about generally raising the capabilities and skill levels of all employees in a data and analytics career path. For example, AXA XL’s Analytic DNA initiative identifies experts in different technology and analytics areas, and looks to them for ideas to leverage to scale more broadly across the organization.
The great news is that people have been really willing to step up and provide their guidance and expertise, and it helps us shape our program into something that's relevant and aligns to our strategic initiatives.
2. Develop personas and identify their goals
At DataCamp, we’ve identified several data-related personas or roles that our customers typically use: Data Consumer, Leader, Data Analyst, Citizen Data Scientist, Data Scientist, Data Engineer, Database Administrator, Statistician, Machine Learning Scientist, and Programmer. We advise our instructors to consider who the relevant personas are when building their courses, and we advise our business customers to consider who the relevant personas are when building out their data programs. Each persona has a different relationship with data.
Two primary personas for AXA XL are Actuaries and Data Scientists, and they’re currently focused on converging the skills required of both roles to further the business.
There's always been an interesting divide in many [insurance] organizations around the difference between an actuarial background and what I would call more of a pure data science or analytic background. In our organization, we're bringing those two things together. We're actually teaching actuaries some of those more statistical machine-learning techniques that they can apply in their actuarial processes. It's not an “us versus them” anymore. It's “how do we bring these capabilities together,” which is pretty exciting.
3. Identify gaps for each persona
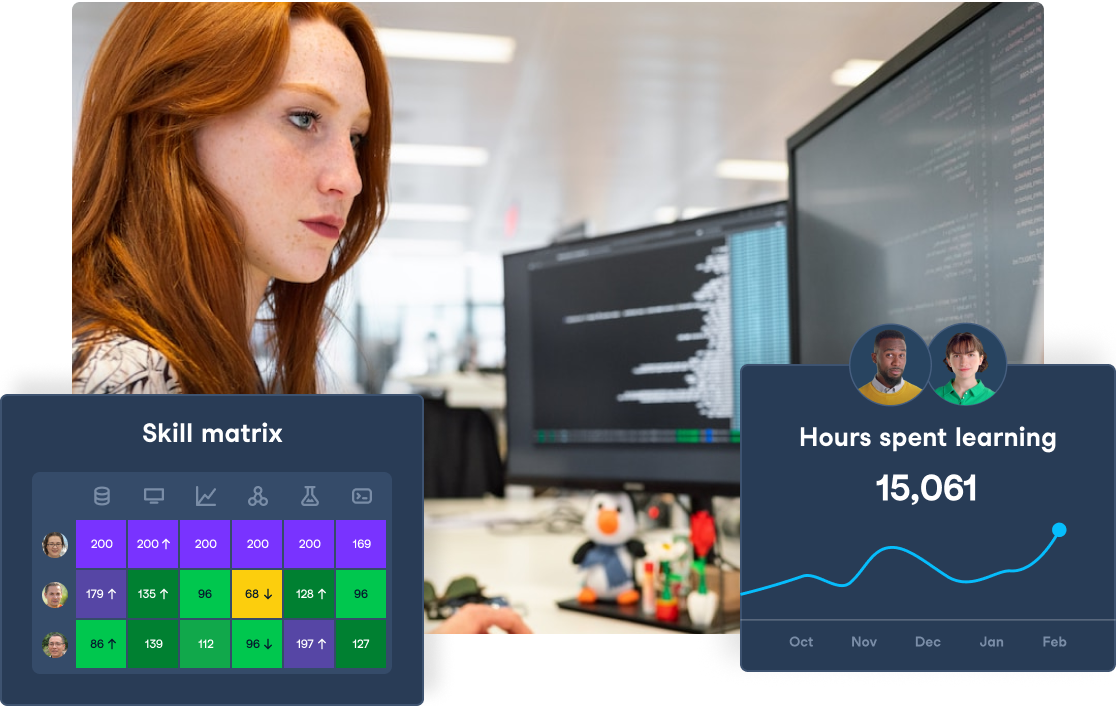
We advise all of our customers to take a broad inventory of their in-house data skills using a skills matrix. This comes in many different forms, but generally involves visualizing strengths and skill gaps at either the organization, department, team, or individual level.
Rachel at AXA XL advises that you can identify gaps for each persona by asking questions like:
- What is it that you want to know?
- What would you like more of?
- What more could we provide, e.g., training, hiring, skill development, or project-based work?
- Are we aligning these capabilities with our strategic projects correctly?
For analytics professionals like data analysts, data scientists, and data engineers, companies may wish to investigate whether there are gaps in important skills like importing data, conducting data analysis in spreadsheets, natural language processing, and building and maintaining data pipelines. Here is a sample skill matrix that we developed for data professionals.
For Data Consumers and Leaders, skills needed for success include soft skills like communication, understanding data visualization, and design thinking.
Design thinking is [about] creating a solution, whatever it is: technical, data, [or] model. How do you do that in a way that's relevant for the customer? Then, how do you communicate the results effectively?
4. Create learning journeys for each persona
A holistic learning approach requires using design thinking to create an effective learning journey. It isn’t only about building technical skills—but also about building important business skills. For instance, AXA XL requires their actuaries to be able to translate data into meaningful terms so that decision makers like underwriters, who evaluate insurance risk, can put a company’s risk assessment into context and draw useful conclusions, like how much risk to assume. The actuaries’ learning journey must include the ability to contextualize data and translate their implications to a broader audience.
To help organizations discover their team’s data skill level across personas, we offer a free skill audit via a benchmark report. Individuals may take our Signal skill assessments to track their own progress.
After assessing skills, we advise organizations to build custom tracks so that everyone can achieve the baseline skill level required for their persona or role. Learning tracks for Data Consumers and Leaders may skew toward our theory courses, while data professionals take our hands-on coding courses. For instance, since so much of AXA XL’s data is in PDFs, learning journeys for their actuaries and data scientists include several of our courses on natural language processing. For early-career actuaries, we recommend these R courses to pass the Predictive Analytics Exam.
Reap the benefits of your data program
Rachel says it’s easy to measure the success of your data program by answering the question: Has it helped you become more profitable? If data is properly feeding into decisions, then your bottom line will reflect that. So if your employees’ skills are evolving and your company is making informed decisions, then the likely answer is: yes.
For more about building a successful data program, watch the webinar on-demand.
Training 2 or more people? Check out our Business solutions
Get your team access to the full DataCamp library, with centralized reporting, assignments, projects and more


