A unique component of the DataCamp Certification process is the practical exam, an open ended project that mimics a real-world scenario. This is the part that I particularly love. It is where we are testing your ability to bring everything together and apply it to a business problem.
While our assessments are a great way for you to practice for the timed exams, we haven’t had many resources for you to prepare for the practical. That has now changed!
Earlier this summer we launched the Practical exam resources page, where you can find everything from grading rubrics to practice exams and even sample solutions written by our team. And over the last month we have been taking a deeper look into the most common challenges faced across the practical exams.
Now, I’d like to summarize this material and share my top tips for passing the practical.
- Get clear on the types of graphics we want you to demonstrate. Not showing us the right skills here is the main reason for failing. This article goes into the details. We are looking for you to show that you can create a range of types of graphics and that you know when to use them. Also remember to pick the right type of graphics for the data.
 .
. 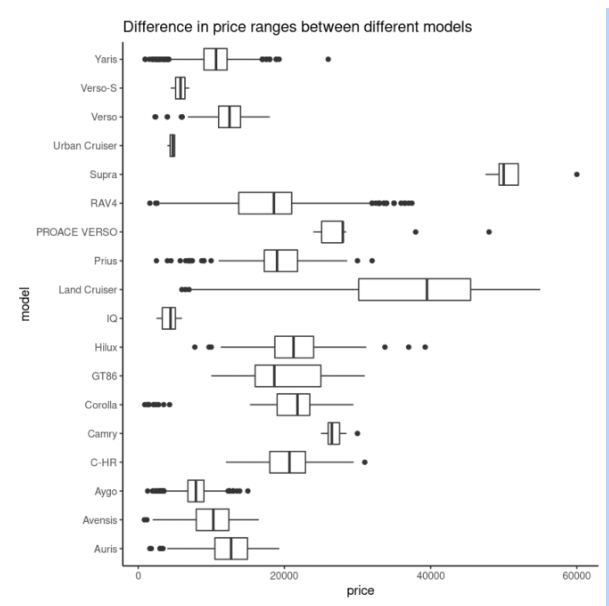
Examples of single and multiple variable plots, we want to see both in the practical
- Validate all of your data! Data validation is an overlooked aspect of working with data. You may not have done it much in your courses, but missing this step can lead you to making inaccurate conclusions or recommendations. It’s a straightforward task in the practical exam and easy to meet, but the most common reason for failing is not demonstrating that you really did validate all of the data. Take a look at this article for more details.
- Fit two models. This one only applies to data scientists but we regularly see mistakes in this category. This is not the time to fit every model you have ever been taught, but it is important to fit multiple models and remember to compare their performance just as you will in your jobs. Keep it simple, we only need to see two and there are no extra marks for extra models. Check this article for more discussion.
- Connect back to the business problem. For those of you at the professional level we want to know that you can make the connection between analysis and business application. Remember to show us that you have understood the business goals, and can connect back to the next steps the business should take. Check the rubric for the details for your role.
- Remember, it is an exam and we are looking for you to show us specific skills. Keep it simple and stick to what we want to see. I see too many people failing for trying to show off everything they know and not showing us the skills we are looking for. Review the rubric and stick to it!
If you still have questions, check out the resources page and register to join any of our upcoming workshops where you will have the opportunity to ask a member of the team.