You might have a vivid recollection of taking exams at university or college and discussing afterwards whether the questions you got were more difficult than the questions other students got. Or you might remember doing a retake and finding that exam easier than the previous one. Was your higher grade caused by an easier exam or did you simply study more?
This touches at the heart of what it means to measure a person’s knowledge, skills, and abilities about a domain. A typical approach to designing an exam is to come up with a set of questions, putting them in front of your students, scoring each question as correct/incorrect, and counting the number of correctly answered questions out of all questions. This final score is then supposed to be a quantification of the student’s knowledge which is used to decide whether you pass or fail the exam.
At DataCamp, we provide a similar experience. Users can measure how well they are doing in a particular domain (e.g., Data Management in SQL) using our assessments - sign in and try one here! Likewise, in DataCamp Certification, users first have to pass a set of exams in order to obtain a certification.
Classical Test Theory
At the heart of test development is a measurement framework called classical test theory (CTT). The classic equation underlying CTT is the following:
X = T + E
where X is the observed test score, T the true score, and E an error component. What this equation is saying is that any observed score is a mixture of a person’s true score and some non-systematic error component. This approach is well-suited for occasions where you’d want to measure a set of people (e.g., all students in your classroom) on a domain with the same, fixed set of questions on a single occasion in time. For example, say you developed a set of questions where you probe a person’s SQL skills, CTT is a good framework to analyze the quality of that test.
DataCamp however can be thought of as one giant world-wide classroom where students can assess themselves on a domain of their interest or attempt to obtain a certification 24/7.
In our environment, we quickly run into problems when trying to rely on CTT to guarantee the quality of our tests.
Given that we provide both assessments and DataCamp Certifications where we aim to quantify a user’s knowledge, skills, and abilities on a particular domain, we can not simply ask the same 15 questions over and over to everyone. That would make our tests very fragile to leaked questions as well as memorizing questions when retaking a test. Scores would become meaningless over time.
Using Item Response Theory
A simple fix for this is to increase the number of questions that can be shown to a user and/or to continuously refresh the pool of questions that can be sampled from. However, CTT only considers a person’s true score, and doesn’t say anything about questions at all! How can we obtain an estimate of a person’s score when we don’t know whether the questions were of comparable difficulty in consecutive tests?
Enter: Item response theory (IRT). IRT is a measurement framework where the observed score on a single question (e.g., correct/incorrect) is assumed to be the result of a probabilistic interplay between a person’s ability and an item’s difficulty. Formally put:
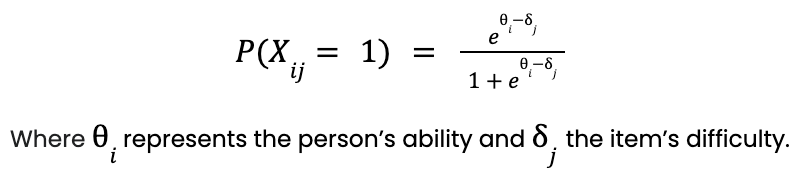
This model is also known as the one-parameter logistic model (1-PL) or Rasch model. For estimation reasons, abilities are assumed to follow a normal distribution centered at 0 with a standard deviation of 1. This results in a scale that is expressed in standard deviations and typically varies between -4 and 4 (as more than 99.99% of the normal distribution is covered within this range). Don’t worry, you can transform this range into anything you want! For example, at DataCamp -3.33 would coincide with a score of 0, 0 with a score of 100, and 3.33 with a score of 200. When fixing this equation for a specific item (in this case at 0) and varying the ability between -4 and 4, you get the following curve:
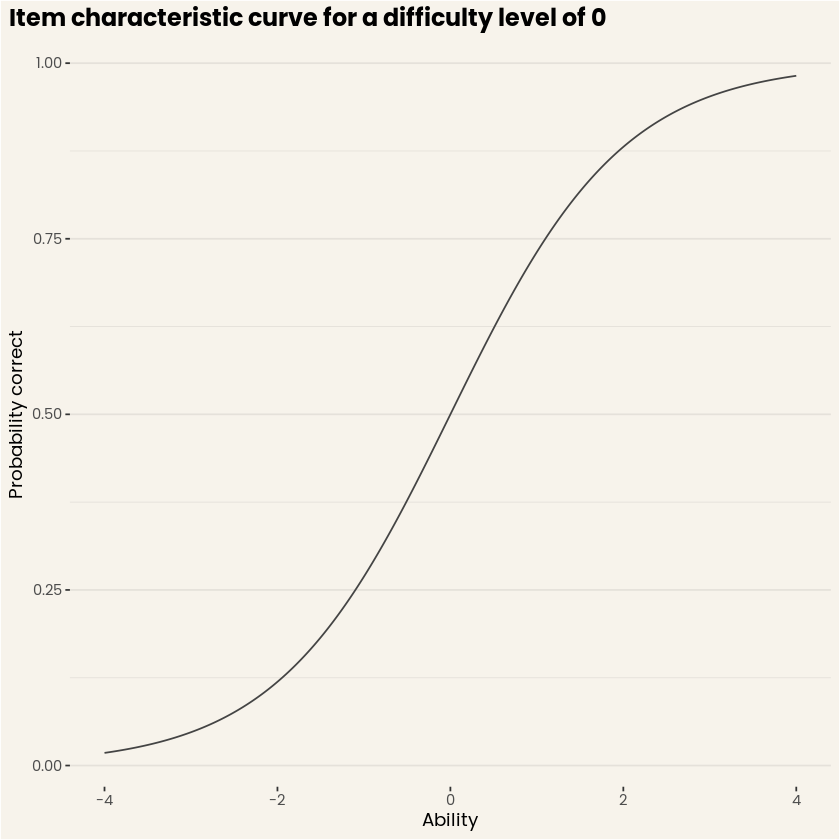
Figure 1. Item characteristic curve for an item with difficulty level 0. (Source: DataCamp Workspace)
This curve is also known as the item characteristic curve and expresses, for each ability level, what the expected probability to respond correctly to that item is. Each item in a pool is characterized by such a curve, and the set of all curves fully expresses the expected test performance for any person. The nice thing about item characteristic curves is that you get an intuition about what performance to expect on an item, given varying person abilities!
Using IRT at DataCamp
Now let’s put our initial motivation to the test! What use does IRT have for DataCamp? The figure below shows a hypothetical set of 7 questions with different difficulty levels. Now let’s say we show the three easiest, and three most difficult questions to the same person in two different testing sessions, in this case a person with an average ability level. It is clear from tracing the curves that the expected number of correct answers on the easy test would be approximately 2.5 (the individual probabilities summed together), while for the hard test this would amount to approximately .875! Put strongly, that’s almost three times better on the easy test when only looking at the correct responses. But here’s the trick, IRT allows us to estimate an ability score based on the correctness of the response and the associated difficulty level. In this way, we would be able to correctly recover an ability score of 0 in both cases (granted some measurement error depending on test length).
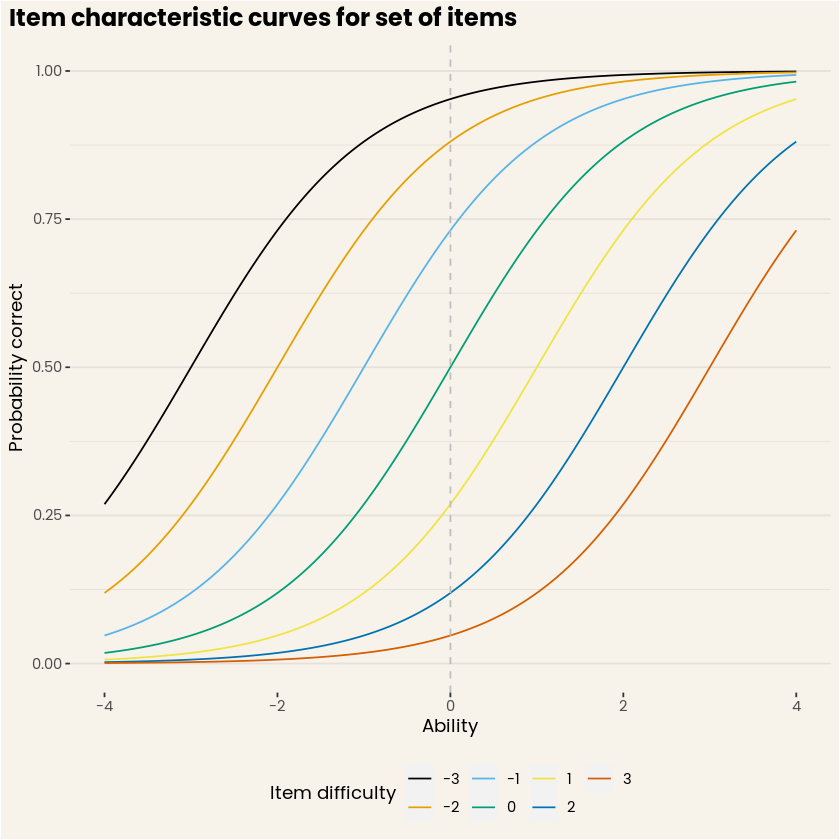
Figure 2. Item characteristic curves for a set of items. (Source: DataCamp Workspace)
Let’s run a little simulation to show that this is actually the case. To ensure a smooth distribution of test scores, we expand the set of items to 61 in total, still ranging from -3 to 3 in difficulty. We let 1000 (hypothetical) users whose true score is at 0 either respond to 30 items ranging from -3 to 0 (the “easy” test), or to 30 items ranging from 0 to 3 (the “hard” test). We can summarize the results in two ways, using the total number of correct items out of 30, or the estimated ability level based on the IRT model. Unsurprisingly, the simulation yields an average of 24 questions correct on the easy test, and only 6 correct on the hard test (see Figure 3). Although this example is a bit contrived, imagine you put these two test forms to students in your classroom and you use the number of correct responses to quantify their performance. None of your students is actually better than the other, but it is clear that the number of correct responses would yield two totally different groups of students!
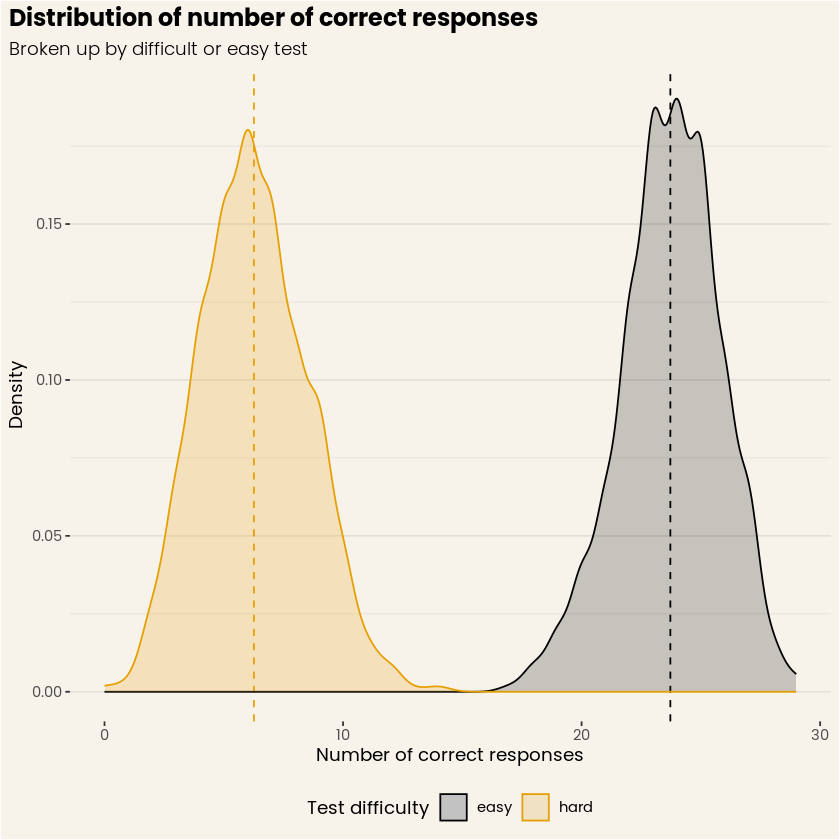
Figure 3. Distribution of number of correct responses, for simulated easy and hard tests. (Source: DataCamp Workspace)
Figure 3 stands in stark contrast with Figure 4, where the distributions of estimated abilities strongly overlap, and their respective means are both almost perfectly centered at zero! The main reason for this is we account for the difficulty of the questions when the ability is computed. Again, this is a somewhat contrived example, but it shows the power of IRT and its ability to disentangle person and item contributions to item responses. Applied to your classroom of students, this approach would of course still yield variation in performance, but at least those two groups of students are gone!
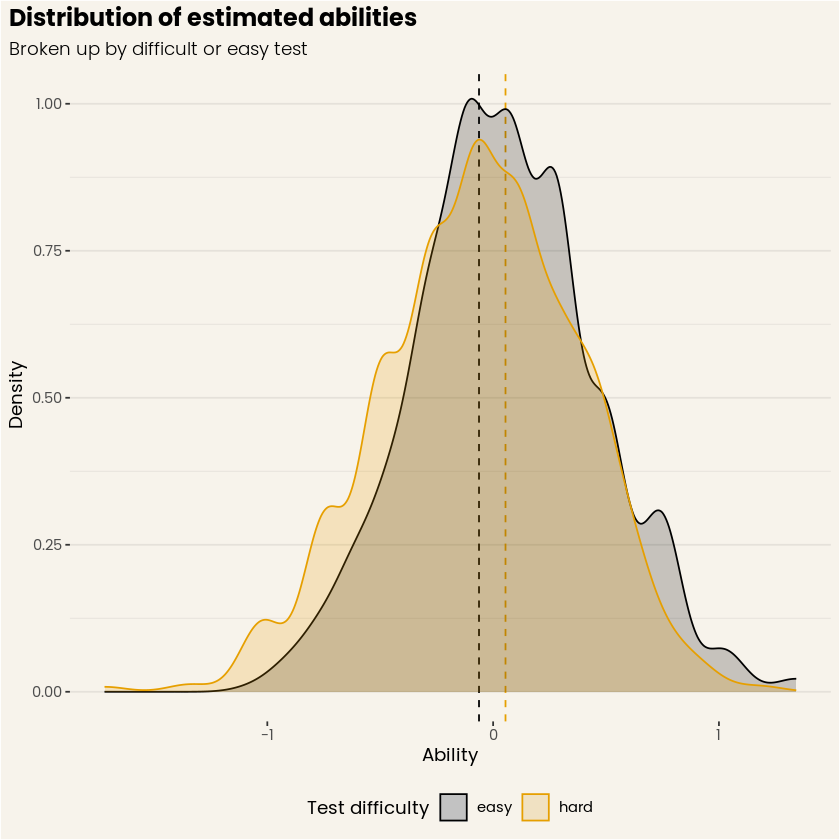
Figure 4. Distribution of estimated abilities, for both simulated easy and hard tests. (Source: DataCamp Workspace)
Final Thoughts
In sum, IRT allows us to create lots of different questions and present subsets to you while still accurately calculating your score and without compromising the security and quality of our tests! What’s even more, IRT allows you to present questions in a way that’s tailored to how well you are doing on the test. Yes, indeed, each test is different because we determine what question you should get adaptively! This allows us to make the test shorter without making it less precise. But more on that in a next blog post! Now go and take an assessment or get certified! ;)
[The figures in this blog post were generated using DataCamp Workspace, our cloud-based notebook that just works. Check the Workspace out here, feel free to comment on it, or experiment with it yourself!]