When it comes to making decisions based on data, many industry experts have a lingering doubt that the prediction algorithms commonly used are not always reliable. For instance, the amount of chocolate consumed per capita is highly predictive of the number of Nobel Prize winners in a country, and there is a correlation between ice cream sales and shark attacks. However, this doesn’t mean that it is a good idea to attract a large number of sharks to the beach to boost our ice cream business.
What’s at stake here is, of course, the familiar concept of “correlation doesn’t imply causation.” Just because two variables are correlated doesn’t mean we can use one to affect the other. Both events might be driven by a third variable, such as “sunny weather” in the example of sharks and ice cream sales, which acts as a common cause of both. At the same time, understanding the root causes of phenomena and using data analytics to foster change is a crucial task for any business. That is why many industry leaders, such as Microsoft, Amazon, Uber, Spotify, McKinsey, and many more have started to invest heavily in their causal AI capabilities.
This tutorial covers some of the fundamental concepts and ideas of causal AI using the DoWhy library in Python. Causal inference is quite different conceptually from standard machine learning, so most people will start out with limited background knowledge. However, basic knowledge of regression analysis and statistical modeling will be helpful for following along. If you're new to regression analysis or need a refresher, consider taking DataCamp's Introduction to Linear Modeling in Python course.
You can also explore the differences between predictive and causal models in the DataCamp course, Machine Learning for Business.
The Building Blocks of Causal AI
When it comes to causal inference, we need to adopt a mindset that is different from standard machine learning and predictive analytics.
The philosopher Nancy Cartwright coined the phrase: “No causes in, no causes out.” This means that we’ll need to make assumptions about the causal structure underlying the phenomenon we’re studying in order to get causal answers out. A purely data-driven approach won’t be enough.
This may sound circular at first, but it really isn’t.
If we want to know whether the correlation between chocolate consumption and Nobel laureates is causal, we need to rule out alternative explanations. Those alternative explanations constitute causal knowledge that we won’t always find in the data itself but have to bring in from outside.
Let’s say we’re considering introducing a new working-from-home (WFH) policy and want to know if it will affect employee productivity. An initial analysis has shown that team members who work from home complete more tasks on a daily basis.
However, can we be certain that this correlation will remain once the policy is implemented for everyone? In other words, can we be sure that the relationship between WFH and productivity is causal?
Note: Graph created by causalfusion.net
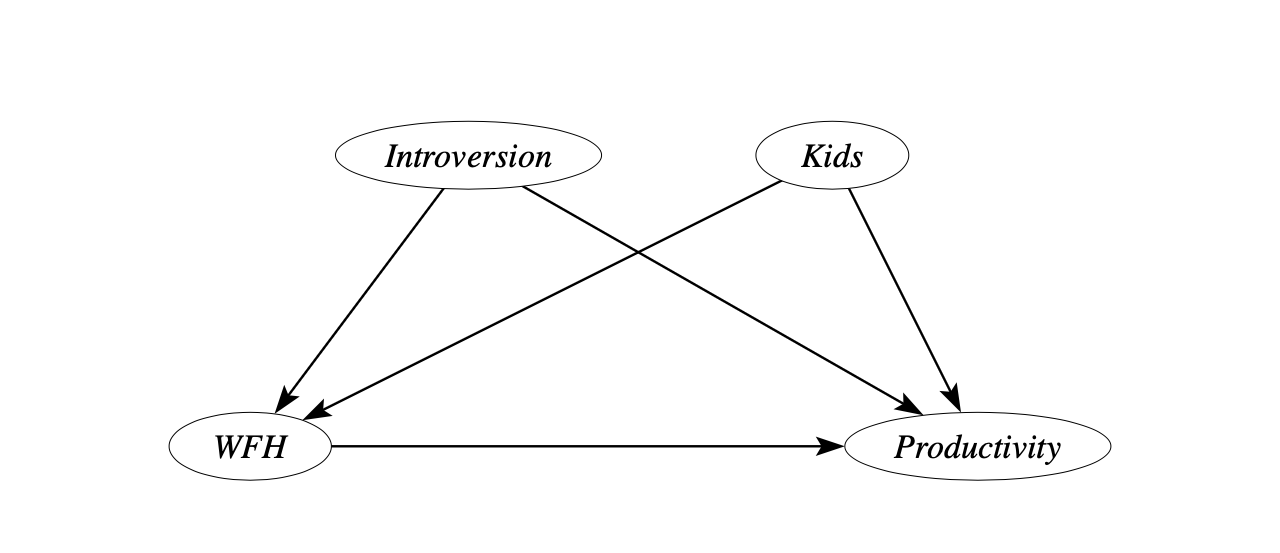
A simple causal model for this context could look like this.
We presume that working from home has an effect on productivity, but we don’t know the direction or strength of the effect. At the same time, there could be other reasons for why we see higher productivity levels for people working from home.
Employees with kids or those who are quite introverted, and don’t cope well with the noise in our large open plan offices, might decide to work more often from home because it’s more convenient for them. These variables might themselves be linked to productivity, which makes them possible common causes that could also be the source of the correlation.
To make all of these assumptions explicit, we depict them in what’s known as a causal graph, a graphical representation used to model the relationships between variables in a system, specifically focusing on causal relationships.
You will find that some of these assumptions can be quite strong in real-world scenarios. The great advantage is that causal graphs make assumptions and prior knowledge very explicit, but we must always be prepared to challenge and refine them in order to give credibility to our analyses.
Getting Started with DoWhy in Python
Microsoft’s DoWhy library, developed in collaboration with Amazon Web Services as part of the PyWhy ecosystem, is quickly becoming the industry standard for causal analysis in the Python universe. We can use DoWhy to simulate a data set according to our causal model above, illustrating some of the fundamental steps in the causal inference pipeline. First, we need to install DoWhy in our environment.
!pip install git+https://github.com/microsoft/dowhy.gitOnce that’s done, we can load the necessary libraries.
import numpy as np
import pandas as pd
import dowhy
Now, let’s create a dataset ourselves. The major benefit of working with simulated data when studying causal AI is that we have full control over the data generating process and knowledge of the “ground truth,” which wouldn’t be the case with real-world data.
We set the true causal effect equal to one (beta=1), specify two common causes, and create ten thousand samples according to simple linear relationships between the variables in the model.
The variable we are examining in our treatment is set to binary, meaning it can be either zero or one.
Before, we established a fixed point of origin for our random number generation - using np.random.seed(1) - to enable a precise reproduction of our dataset.
from dowhy import CausalModel
import dowhy.datasets

# Set seed to enable exact replication
np.random.seed(1)

# Simulate sample data
data = dowhy.datasets.linear_dataset(
    beta=1,
    num_common_causes=2,
    num_discrete_common_causes=1,
    num_instruments=1,
    num_samples=10000,
    treatment_is_binary=True)

df = data['df']
DoWhy assigns the following labels:
Table 1
|
Label |
Variable |
Type |
Mean |
|
v0 |
The treatment variable, which is the main variable of interest in our analysis (working from home) |
Binary |
0.608 |
|
y |
The outcome of interest (productivity) |
Continuous |
1.583 |
|
W0 |
Introversion |
Continuous |
-0.148 |
|
W1 |
Number of Kids |
Categorical |
1.5 |
|
Z0 |
An instrumental variable only affecting v0 but not y (subway closure) |
Binary |
0.281 |
Here, we have implicitly defined a causal graph by setting the type of treatment and the number of common causes. DoWhy stores graph objects in the DOT language, which gives us a convenient way of specifying our own directed causal graph (digraph) once we’re working with real-world data.
digraph {v0->y;W0-> v0; W1-> v0;Z0-> v0;W0-> y; W1-> y;}Finally, we combine all of this information into one single causal model.
# Create a causal model from the data and given graph.
model=CausalModel(
        data = df,
        treatment=data['treatment_name'],
        outcome=data['outcome_name'],
        graph=data['gml_graph']
        )
Unlocking the Power of Causal AI
Before we carry out our causal analysis, let’s benchmark it with what a naive approach based on a simple linear prediction algorithm would tell us.
# Run a linear regression of column y on v0 in df
import statsmodels.api as sm

X = df['v0'].astype(float)
y = df['y'].astype(float)

X = sm.add_constant(X)

ols = sm.OLS(y, X).fit()

# Display a more parsimonious results summary
print(ols.summary().tables[1])
The slope coefficient in a bivariate regression is equal to 1.298. However, we know that the true causal effect is actually equal to one, as we have generated the data in this manner.
This implies that the two common causes, introversion and having children, which both influence productivity and the likelihood of working from home, lead to an overestimation of almost 30% in this case.
Fortunately, as long as we have data on these variables, we can easily address this bias by including the common causes in a multivariate analysis.
In the causal AI literature, this is known as the backdoor criterion. We want to control for all variables in the causal graph that point into the treatment variable. They “enter through the backdoor” and thus potentially create a spurious correlation between the treatment and outcome that is not causal. In our example, this applies to introversion and the number of kids.
WFH <— Introversion —> Productivity
WFH <— Kids —> Productivity
DoWhy offers a range of algorithms that can be used to determine if a desired causal effect can be identified when given a particular causal model.
# Check whether causal effect is identified and return target estimands
identified_estimand = model.identify_effect()
Unsurprisingly, in our simple causal model for the effect of working from home, causal identification is possible.
Next, we can focus on estimation, which is the process of quantifying the target effect using the available data.
DoWhy offers a number of algorithms to choose from, including regression, matching, stratification, and weighting estimators. Since the underlying data we simulated was based on linear relationships, a simple regression would suffice. If you need a refresher, DataCamp’s Intro to Regression with statsmodels in Python course can help.
However, to make our analysis more general, we will use inverse probability weighting, which is also able to handle nonlinear data.
# Estimate the causal effect using inverse probability weighting
estimate = model.estimate_effect(identified_estimand,
                                 method_name="backdoor.propensity_score_weighting")
DoWhy returns a causal effect estimate equal to 1.001. Of course, the actual numbers are not very meaningful in this simulated context. However, what’s important is that we are very close to the ground truth of one. Compared to the regression we ran before, the bias has been reduced by a staggering 99.6%.
Stress Testing Your Results
That’s all very impressive, but we shouldn’t stop there.
The “no causes in, no causes out” principle tells us that any causal analysis can only be as good as the assumptions we bring to the table.
For example, how can we be sure that it’s only introversion and kids which affect WFH, as our simple causal model stipulates?
To gain more confidence in our assumptions, DoWhy provides us with a whole suite of refutation tests that allow us to stress test our analysis, including but not limited to testing with subsamples or placebo treatments.
# Check sensitivity of obtained estimate to unobserved confounders
refute_results = model.refute_estimate(identified_estimand, estimate,
                                       method_name="add_unobserved_common_cause")
Let’s see what happens if we add another common cause in addition to introversion and kids.
This time, we don't have data on this variable, so it will remain unobservable to us. How reliable are our estimates? Unfortunately, the answer is not very reassuring.
The graph in Figure 2 illustrates the substantial influence that unobserved common causes can have on the estimated causal effect, ranging from -0.222 to 1.003. This range is so wide that it could potentially double the estimated effect.
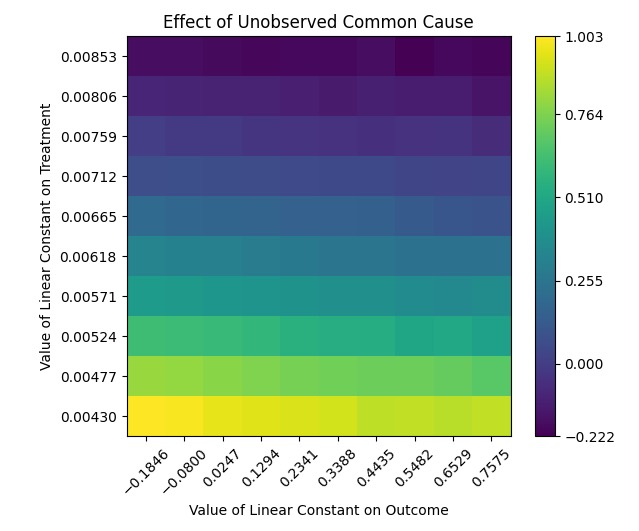
That’s not very surprising, though. Alternative causal mechanisms involving unobserved variables that we cannot account for in the analysis will always pose a problem in causal studies.
Fortunately, there is an alternative way to achieve identification in this context, and DoWhy is smart enough to figure it out for us.
Finding Alternative Causal Strategies
Even though introverted employees and those with kids might work from home more frequently, there may be other determinants of WFH that are not related to productivity.
Let’s say we had a major public transport disruption, and one of the subway lines in our city had to be closed for three months. As a result, employees who lived in districts close to the line were more likely to work from home, even if they would have otherwise preferred to come to the office.
We can illustrate this augmented causal model as follows.
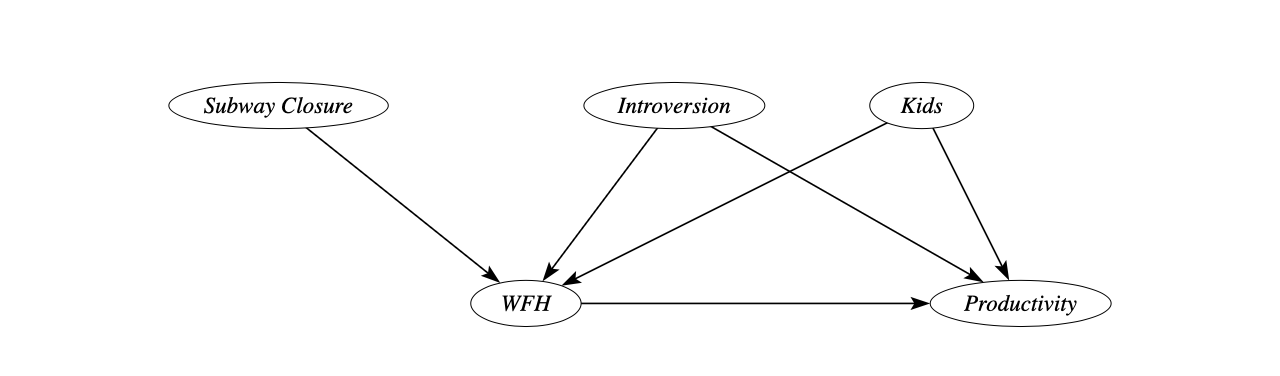
In this case, the subway closure acts as a so-called instrumental variable.
Intuitively, the closure acts as a shock to people’s commuting schedules, creating a form of natural experiment.
For three months, those living close to the disrupted line will work from home more often, but this has no other relation to their productivity. You may have noticed that we have already included such an instrumental variable, Z0, in the creation of the simulated data set above by setting the option num_instruments=1. DoWhy’s identify_effect() function is then able to automatically find suitable instrumental variables for us in the causal graph.
iv_estimate = model.estimate_effect(identified_estimand,
                                    method_name="iv.instrumental_variable")
After estimating, we find that the causal effect is 0.920. This is slightly less accurate than the backdoor strategy but still much more accurate than the naive prediction.
Instrumental variable estimation is advantageous because it does not rely on assumptions about the number of unobserved common causes of WFH and productivity.
Thus, although our estimates may be less precise, they are more robust due to the weaker assumptions. This is a common trade-off in causal analysis.
What’s Next?
DoWhy is an excellent place to get started with causal AI. It’s a powerful end-to-end library that provides a versatile causal inference pipeline, which guides users through the essential steps.
Once you have grasped the fundamental workflow, you can progress to more advanced topics such as causal discovery and boost your analysis with additional libraries such as DoubleML, or daggity, ggdag, and pcalg in R. Once you're comfortable with the basics, you might want to explore more advanced topics in causal inference. DataCamp's Advanced Causal Inference with R course is a great next step.
Causal inference offers a fresh outlook on data analysis. Most approaches depend on an understanding of the causal graph or other causal assumptions. The trick is to select the techniques and assumptions that are suitable for your particular situation. This requires external knowledge and domain expertise.
Therefore, it’s a good idea to consult with your marketing experts or HR specialists to get their opinions on a particular issue and see if they can help you come up with a suitable model.
Causal knowledge is crucial in many business contexts. We need to understand, for example, whether our new product launch is successful or how effective our advertising strategy is.
Obtaining causal answers from data might be a harder task than training a simple prediction algorithm, but it’s well worth the effort. And libraries such as DoWhy provide you with a great set of tools that will help you to find the solutions that best fit your needs.
If you've found this tutorial enlightening and are eager to apply causal AI techniques in your own projects, there's no better time to deepen your understanding. In the comprehensive course on Machine Learning for Business, you'll learn not just about predictive models but also about causal models that can help you make better business decisions.