

开始使用 TimeGPT
TimeGPT 模型不是开源的,您只能通过 Nixtla API 进行访问。本节将指导您配置 Nixtla API 来访问 TimeGPT 模型,并对亚马逊股票数据进行预测。
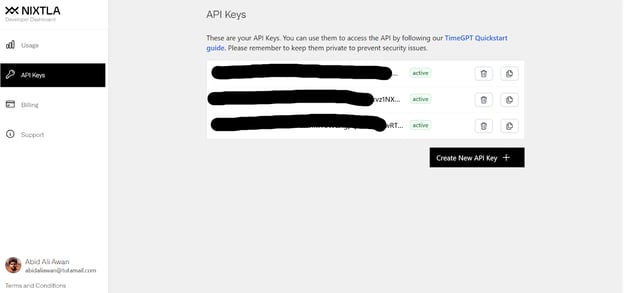
- 我们需要访问 dashboard.nixtla.io 生成一个 API 密钥。系统会提示我们创建账户以生成 API 密钥。目前可以免费访问 TimeGPT,但对 API 调用次数有一定限制。
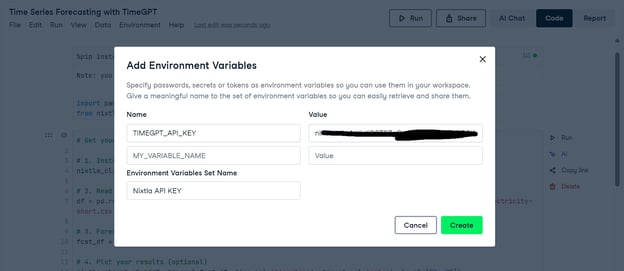
- 我们使用 DataCamp 的DataLab 作为编码环境。DataLab 是免费的云端 Jupyter Notebook,任何人都能在几秒内开始编码。要在 DataLab 中设置环境变量,点击 "Environment" 选项卡,然后点击 "Environment variables..." 按钮,接着点击 "+ Add",添加变量名和 API 密钥。
- 安装用于该模型的 Nixtla Python 客户端,以及用于股票数据集的 Yahoo Finance 库。
%%capture
%pip install nixtla>=0.5.1
%pip install yfinance- 使用 TimeGPT 的 API 密钥创建 Nixtla 客户端。
- 下载亚马逊股价数据,重置索引,并展示前五行。
import pandas as pd
import yfinance as yf
from nixtla import NixtlaClient
import os
timegpt_api_key = os.environ["TIMEGPT_API_KEY"]
# Setup NixtlaClient
nixtla_client = NixtlaClient(api_key = timegpt_api_key)
# Downloading Amazon stock price data
ticker = 'AMZN'
amazon_stock_data = yf.download(ticker)
amazon_stock_data = amazon_stock_data.reset_index()
# Displaying the dataset
amazon_stock_data.head()我们拥有自 1997 年起至今的亚马逊股价数据。

- 我们可以直接使用 Nixtla 客户端绘制股价数据。
nixtla_client.plot(amazon_stock_data, time_col='Date', target_col='Close')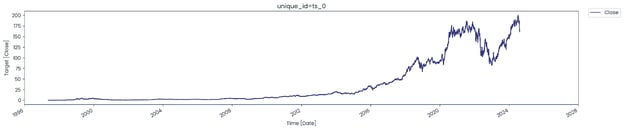
想要了解如何使用 Matplotlib 创建时间序列折线图,请参阅本Matplotlib 时间序列折线图教程。
- 要进行预测,我们需要为
.forecast函数提供股价数据、模型名称、预测视窗(相当于 24 天)、频率、时间列与目标列。由于证券交易所周末休市,我们将频率设为“工作日(B)”。
model = nixtla_client.forecast(
df=amazon_stock_data,
model="timegpt-1",
h=24,
freq="B",
time_col="Date",
target_col="Close",
)
model.tail()

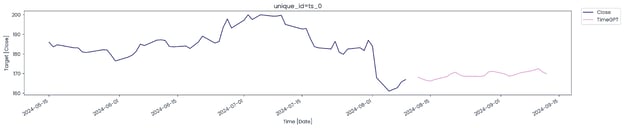
- 使用最大样本长度 60 绘制真实与预测数据集。这意味着仅绘制最近的 60 个值,以更聚焦地展示模型预测。
nixtla_client.plot(
amazon_stock_data,
model,
time_col="Date",
target_col="Close",
max_insample_length=60,
)
可以看到,短短几秒内,TimeGPT 模型就准确预测了亚马逊的未来收盘价。
以上是入门示例。接下来,我们将处理更复杂的数据集,并探索 Nixtla API 的更多功能。
使用 TimeGPT 预测澳大利亚用电需求
本节我们将使用更复杂的澳大利亚用电需求数据集,使用 TimeGPT 模型一次性预测多个值。
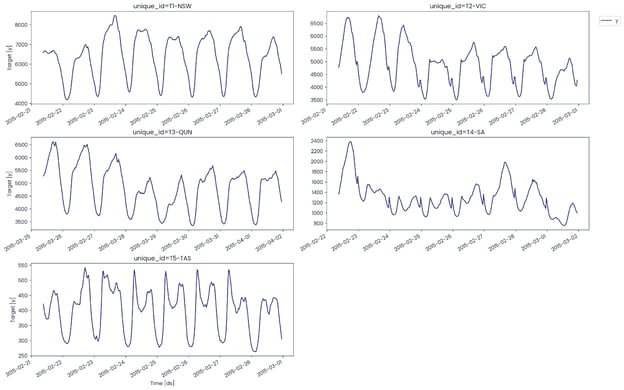
该数据集包含 5 条时间序列,表示澳大利亚 5 个州(维多利亚州、新南威尔士州、昆士兰州、塔斯马尼亚州和南澳大利亚州)的半小时用电需求。
我们还将学习如何对模型进行微调,并使用多种超参数来提升性能。最后,我们将进行交叉验证,并与传统模型对比,完成更全面的评估。
加载数据集
pandas 库并没有简单的方法来加载 .tsf 文件。我们需要自定义函数来加载和处理数据,然后将其转换为 Pandas 数据框。
import pandas as pd
def read_tsf_from_file(file_path):
data = []
start_date = pd.to_datetime("2002-01-01 00:00:00")
# Open and read the file from the directory
with open(file_path, "r") as file:
for line in file:
if line.startswith("T"):
parts = line.strip().split(":")
unique_id = parts[0] + "-" + parts[1]
values = list(map(float, parts[3].split(",")[:-1]))
# Generate datetime index at half-hour intervals
periods = len(values)
date_range = pd.date_range(
start=start_date, periods=periods, freq="30min"
)
# Append to data list
for dt, value in zip(date_range, values):
data.append([unique_id, dt, value])
# Convert the list of data into a DataFrame
return pd.DataFrame(data, columns=["unique_id", "ds", "y"])
# Example usage
file_path = "australian_electricity_demand_dataset.tsf"
demand_df = read_tsf_from_file(file_path)
# Display the dataframe
demand_df.head()
数据集包含三列:
- unique_id:代表澳大利亚的 5 个州。
- ds:日期与时间。
- y:用电需求。

plot 函数非常好用,它会自动识别 unique_id 列,并创建五个不同的时间序列可视化。
nixtla_client.plot(
demand_df,
max_insample_length=365,
)下方可视化展示了 5 个州的用电量,它们的模式并不相同。
通过参加DataCamp 的直播代码实操,学习时间序列分析,使用 Python 深入金融时间序列数据集。
在本次课程中,我们将探索多只股票、可视化其表现,并使用不同模型进行预测。
异常检测
在预测之前,我们先识别数据集中的各种异常,以便更好地理解问题。
.detect_anomalies 函数接收数据集、时间列、目标列和频率作为参数。
# Detect anomalies
anomalies_df = nixtla_client.detect_anomalies(
demand_df,
time_col='ds',
target_col='y',
freq='H',
)
anomalies_df[anomalies_df["anomaly"]==1].head()上方展示的是检测到异常的实例。

5 条时间序列中异常的总数为 17,316,数量相当多。
anomalies_df.anomaly.value_counts()
现在,我们将在真实数据上绘制异常,以查看它们出现的位置和日常频率。为简化可视化,我们仅展示新南威尔士州的 5,000 个样本。
# Plot anomalies
nixtla_client.plot(
demand_df[demand_df["unique_id"]=="T1-NSW"][0:5000],
anomalies_df[anomalies_df["unique_id"]=="T1-NSW"][0:5000],
time_col='ds',
target_col='y',
)从日度来看,异常并不常见,但确实存在某些天内多次异常的情况。

使用 TimeGPT 的单序列预测
现在我们来预测新南威尔士州的用电需求。为此,将仅筛选出 “T1-NSW” 的数值。
T1_df = demand_df[demand_df["unique_id"]=="T1-NSW"]
T1_df.head()
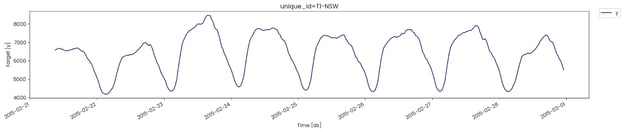
绘制最近 365 个值,以了解用电模式。
nixtla_client.plot(
T1_df,
max_insample_length=365,
)
接下来评估模型表现。为此,我们需要将数据集划分为训练集和测试集。
训练集包含 144 个值(相当于 3 天),测试集包含 1200 个值(相当于 25 天)。
test_df = T1_df.tail(144) # 3 days = (144 * 0.5h * 1 day/24h)
train_df = T1_df.iloc[-1344:-144] # 25 days = (1200 *0.5h * 1 day/24h)在预测时,我们将选择更合适的模型,并设置多个参数以提升表现,具体包括:
- 预测接下来的 144 个值(3 天)。
- 预测 90% 置信区间。
- 以 60 个步骤微调模型,虽然步数较多,但能带来更好结果。
- 将损失函数设为 MAE。
- 使用 TimeGPT-1-long-horizon 模型替代简单模型。
- 设置时间列与目标列。
predict_df = nixtla_client.forecast(
df=train_df,
h=144,
level=[90], # Generate a 90% confidence interval
finetune_steps=60, # Specify the number of steps for fine-tuning
finetune_loss="mae", # Use the MAE as the loss function for fine-tuning
model="timegpt-1-long-horizon", # Use the model for long-horizon forecasting
time_col="ds",
target_col="y",
)
绘制真实值、预测值与 90% 置信区间,以评估模型表现。
nixtla_client.plot(
test_df, predict_df, models=["TimeGPT"], level=[90], time_col="ds", target_col="y"
)
短短几秒即可得到相当准确的结果——这正是预训练模型的强大之处。

接下来,我们将使用 Nixtla 开源项目中的 UtilsForecast 库评估模型表现。我们会先合并测试集与预测集,然后将其传入 evaluate 函数。该函数接收数据集、指标、模型、目标列与唯一 ID,用于计算模型指标,并以 pandas 数据框形式展示。
from utilsforecast.losses import mae, rmse, smape
from utilsforecast.evaluation import evaluate
predict_df["ds"] = pd.to_datetime(predict_df["ds"])
test_df = pd.merge(test_df, predict_df, "left", ["ds", "unique_id"])
evaluation = evaluate(
test_df,
metrics=[mae, rmse, smape],
models=["TimeGPT"],
target_col="y",
id_col="unique_id",
)
average_metrics = evaluation.groupby("metric")["TimeGPT"].mean()
average_metrics我们得到了相当不错的结果。

使用 TimeGPT 的多序列预测
Nixtla API 也支持一次性预测多条序列。我们将使用整个数据集,而非按唯一 ID 进行筛选。
为了划分训练集和测试集,我们使用 groupby 函数为每个唯一 ID 切分出 144 个值。否则,我们可能只会得到某个随机唯一 ID 的 144 个值。
values for some randomly chosen unique ID.
test_df = demand_df.groupby("unique_id").tail(144) # 3 days
train_df = (
demand_df.groupby("unique_id")
.apply(lambda group: group.iloc[-1344:-144])
.reset_index(drop=True)
) # 25 daysforecast 函数与前一部分相同,但这次我们还包含了 ID 列。
predict_df = nixtla_client.forecast(
df=train_df,
h=144,
level=[90],
finetune_steps=60,
finetune_loss='mae',
model='timegpt-1-long-horizon',
time_col='ds',
target_col='y',
id_col='unique_id'
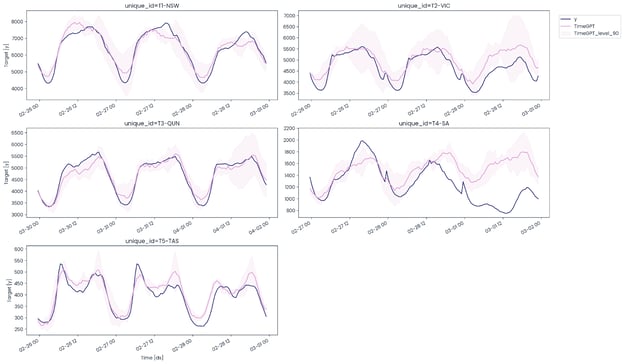
)为所有 5 个唯一 ID 绘制真实值、预测值与 90 置信水平的时间序列图。
nixtla_client.plot(
test_df, predict_df, models=["TimeGPT"], level=[90], time_col="ds", target_col="y"
)可以看到,TimeGPT 模型在多条时间序列上的表现仍然不错,除了南澳大利亚州。它未能预测出用电需求的下降趋势。
为使用 MAE、RMSE 与 SMAPE 指标评估模型,我们需要合并测试与预测数据框。
predict_df['ds'] = pd.to_datetime(predict_df['ds'])
test_df = pd.merge(test_df, predict_df, 'left', ['ds','unique_id'])使用 evaluate 函数生成模型表现报告(pandas 数据框)。其中将包含每个唯一 ID 的模型指标。要计算模型的整体表现,我们需要对这些值取平均并展示最终结果。
evaluation = evaluate(
test_df,
metrics=[mae, rmse, smape],
models=["TimeGPT"],
target_col="y",
id_col = "unique_id"
)
average_metrics = evaluation.groupby('metric')["TimeGPT"].mean()
average_metrics与单一序列微调相比,在多条时间序列上微调能够整体提升模型表现。

交叉验证
Nixtla 客户端还支持对数据集的多个窗口执行交叉验证,以评估模型表现。
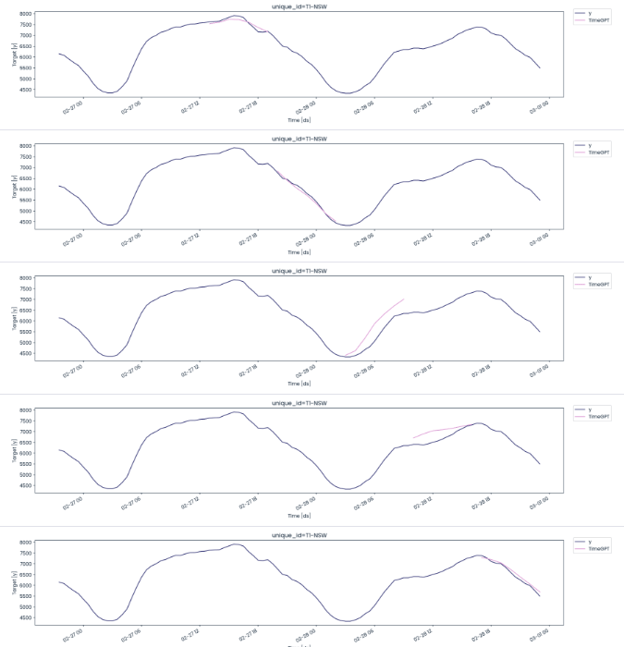
我们将使用 .cross_validation 函数,并传入仅包含新南威尔士州数据的筛选数据集。交叉验证将包含 5 个窗口,每个窗口长度为 7 小时。
timegpt_cv_df = nixtla_client.cross_validation(
T1_df,
h=7,
n_windows=5,
time_col='ds',
target_col='y',
freq='H',
)
timegpt_cv_df.head()可以看到,我们基于五个 7 小时的窗口获得了预测值。

我们将使用截断日期时间来创建 5 个窗口,分别展示预测值与真实值。
cutoffs = timegpt_cv_df['cutoff'].unique()
for cutoff in cutoffs:
fig = nixtla_client.plot(
T1_df.tail(100),
timegpt_cv_df.query('cutoff == @cutoff').drop(columns=['cutoff', 'y']),
time_col='ds',
target_col='y'
)
display(fig)除第 3 与第 4 次划分外,模型整体表现相当不错。
LGBM 与 TimeGPT 的对比
现在我们将比较 TimeGPT 与 Light Gradient-Boosting Machine(LGBM)模型的表现,以明确哪一个在同一数据集上更胜一筹。我们已对新南威尔士州的数据框进行了交叉验证;下一步是使用 evaluate 函数生成模型评估报告。
evaluation = evaluate(
timegpt_cv_df,
metrics=[mae, rmse, smape],
models=["TimeGPT"],
target_col="y",
id_col = "cutoff"
)
evaluation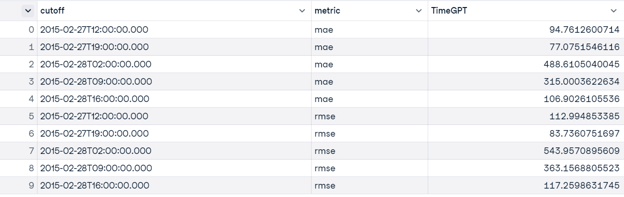
我们需要对 5 个窗口的 MAE、RMSE 与 SMAPE 取均值,以获得模型的整体结果。
average_metrics = evaluation.groupby('metric')["TimeGPT"].mean()
average_metrics即便在较小的数据量上,结果也相当不错。

评估 LGBM 模型需要遵循以下步骤:
- 数据筛选: 确保数据与 TimeGPT 交叉验证所用值一致或相近。
- 日期时间转换: 将日期时间信息转换为数值。
- 特征工程: 使用滞后与滚动窗口技巧创建额外特征。
- 缺失值处理: 删除因创建滞后与滚动窗口而产生的缺失值。
- 建模准备: 定义特征矩阵 X 与目标向量 y,并使用 TimeSeriesSplit 划分。
- 训练与评估: 训练模型、进行评估,并记录每个数据划分的指标。
- 结果汇总: 计算各项模型指标的均值,并以 pandas 数据框展示。
注意:若要使用统计与机器学习模型进行时间序列预测,掌握基础的特征工程技巧与算法至关重要。详尽指南请参阅本教程:DataCamp 上的时间序列预测教程。
import pandas as pd
import numpy as np
import lightgbm as lgb
from sklearn.model_selection import TimeSeriesSplit
from sklearn.metrics import mean_absolute_error, mean_squared_error
# Function to calculate SMAPE
def smape(y_true, y_pred):
return np.mean(2 * np.abs(y_pred - y_true) / (np.abs(y_true) + np.abs(y_pred)))
# Assuming 'ds' is the date/time column and 'y' is the target variable
T1_df['ds'] = pd.to_datetime(T1_df['ds'])
# Filter the DataFrame to include only the specified datetime range
start_date = '2015-02-27T13:00:00'
end_date = '2015-02-28T23:00:00'
T1_df = T1_df[(T1_df['ds'] >= start_date) & (T1_df['ds'] <= end_date)]
# Convert 'ds' to a numerical value (e.g., timestamp)
T1_df['ds_num'] = T1_df['ds'].apply(lambda x: x.timestamp())
# Create lag and window features
for lag in range(1, 4):
T1_df[f'lag_{lag}'] = T1_df['y'].shift(lag)
T1_df['rolling_mean'] = T1_df['y'].rolling(window=3).mean()
T1_df['rolling_std'] = T1_df['y'].rolling(window=3).std()
# Drop NaN values resulting from lag and rolling operations
T1_df.dropna(inplace=True)
# Select features for the model
X = T1_df[['ds_num', 'lag_1', 'lag_2', 'lag_3', 'rolling_mean', 'rolling_std']]
y = T1_df['y']
# Time series split
tscv = TimeSeriesSplit(n_splits=5)
mae_scores = []
rmse_scores = []
smape_scores = []
for train_index, test_index in tscv.split(X):
X_train, X_test = X.iloc[train_index], X.iloc[test_index]
y_train, y_test = y.iloc[train_index], y.iloc[test_index]
# Initialize and train the LGBM model
model = lgb.LGBMRegressor(force_row_wise=True, verbosity=-1)
model.fit(X_train, y_train)
# Make predictions
y_pred = model.predict(X_test)
# Evaluate the model
mae = mean_absolute_error(y_test, y_pred)
rmse = np.sqrt(mean_squared_error(y_test, y_pred))
smape_value = smape(y_test, y_pred)
mae_scores.append(mae)
rmse_scores.append(rmse)
smape_scores.append(smape_value)
# Convert the metrics into a DataFrame
mae_avg = np.mean(mae_scores)
rmse_avg = np.mean(rmse_scores)
smape_avg = np.mean(smape_scores)
metrics_df = pd.DataFrame({
'metric': ['MAE', 'RMSE', 'SMAPE'],
'LGBM': [mae_avg, rmse_avg, smape_avg]
})
# Display the DataFrame
metrics_dfTimeGPT 的表现几乎是 LGBM 的 5 倍之优。

如果您在运行上述代码或配置 TimeGPT 时遇到问题,请查看 DataLab 工作空间:使用 TimeGPT 进行时间序列预测。
结论
TimeGPT 与 Nixtla 生态非常适合刚起步的公司,因为它无需招聘机器学习工程师来训练模型,也无需 MLOps 工程师来部署与维护。如果您是初创企业,既能显著节省成本,又可使用高性能模型。
与 GPT-3 类似,TimeGPT 标志着时间序列领域最先进模型的开端。随着这些模型不断进化,许多公司很可能会采用 Nixtla API,以便捷集成并提升表现。
本教程介绍了 TimeGPT,这一时间序列领域的首个基础模型。此外,我们还学习了如何使用 Python API 访问 TimeGPT 模型,完成预测、时间序列可视化、模型评估、交叉验证与异常检测等任务。
学习如何使用 ARIMA 类模型预测未来,并借助机器学习模型生成预测与洞见,请参阅Python 时间序列技能路径。若您更偏好 R 语言,推荐R 时间序列技能路径,系统掌握时间序列预测。

作为一名持证的数据科学家,我热衷于利用前沿技术打造创新的机器学习应用。凭借在语音识别、数据分析与报告、MLOps、对话式人工智能以及自然语言处理方面的扎实背景,我不断打磨构建智能系统的能力,力求带来切实影响。除技术专长外,我也擅长沟通,能够将复杂概念提炼为清晰、简明的表述。因此,我成为数据科学领域备受关注的博主,与不断壮大的数据专业人士社区分享洞见与实践经验。目前,我专注于内容创作与编辑,借助大语言模型打造有力且吸引人的内容,帮助企业与个人更好地发挥数据价值。
训练时间序列机器学习模型并不简单;它与传统的分类或回归问题有很大不同。您需要创建滑窗与滞后项,从现有数据中生成新特征,但即便如此,模型也可能表现不佳。不仅线性回归模型会吃力,连 LSTM 和 GRU 等深度学习模型在预测股市时也常常效果不佳。
我们是否需要一个类似 GPT-4o 的时间序列模型,能在各种数据集上都有出色表现?答案是肯定的。TimeGPT 是一款最先进的基础模型,甚至可以对未见过的数据集进行预测。
在本教程中,我们将探索 TimeGPT 的架构、训练方式及其基准表现。此外,我们将学习如何使用 Nixtla API 访问 TimeGPT 模型,完成预测、异常检测、时间序列可视化和模型评估等任务。
作者制图 | Canva
什么是 TimeGPT?
TimeGPT-1 是一种基于 Transformer 的时间序列模型,具备自注意力机制,您可以通过 Nixtla API 进行访问。它是首个用于时间序列数据集的基础模型,在未见数据上的准确性也相当不错。您只需在您的数据集上进行微调,几秒内即可获得业界领先的表现。
TimeGPT 的架构由多层编码器-解码器结构组成,每层都配备残差连接与层归一化。输出层为线性层,将解码器的输出映射到预测窗口的维度。
它在目前最大规模的公开时间序列数据集上完成训练,这意味着它无需重新训练即可对未见数据集进行预测。为生成预测,TimeGPT 会取一段历史数值窗口,并加入局部位置编码以增强输入。
来源:2310.03589 (arxiv.org) | TimeGPT 将目标变量的历史数值和额外的外生变量作为输入以生成预测。
TimeGPT 模型优于既有的统计、机器学习与深度学习方法,展现出更强的零样本推理表现、效率与简洁性。如下方基准所示,即便不进行任何特征工程,TimeGPT 也能在多种机器学习指标上表现出色。
来源:2310.03589 (arxiv.org) | 使用 rMAE 与 rRMSE 衡量的基准模型,分数越低越好。