
Track
Associate Data Scientist in Python
90 hr

The advent of the internet and the increasing use of technology has resulted in an exponential increase in data volumes. The increase in businesses’ reliance on data-driven decision making has left them vying for the best talent pool to efficiently source data from relevant and reliable sources, store it, and use it for their businesses.
As businesses continue to make huge investments in not just setting up their data infrastructure, but also in acquiring the right talent pool, the roles of data analyst and data scientist have emerged as the two most popular roles. Their popularity stems from the burgeoning demand for these data specialists across almost every industry.
The distinction between a data analyst and a data scientist stems from the nature of the work they perform. For a data analyst, the profile is primarily exploratory in contrast to an experimental work profile of a data scientist.
The distinction between a data analyst and a data scientist stems from the level of expertise in data usage. Of the two, a data scientist should be more hands-on with advanced programming techniques and computing tools. Also, a data scientist should be more adept at developing data models and algorithms. Understanding the different ways in which businesses use data can further help bring more clarity to their respective roles.
A data analyst employs descriptive analytics to report facts and sometimes provides prescriptive analytics by way of recommendations based on these insights. A data scientist covers the entire range of the analytics journey, focusing primarily on predictive analytics and generating value for organizations with data.
A data analyst may perhaps have many other job titles, such as a strategist, a business intelligence analyst, a market intelligence analyst or a consultant, or a competitive intelligence analyst. Whatever the exact job title is, a data analyst is usually expected to provide insights by querying volumes of data (mostly structured) and then converting them into meaningful reports for various stakeholders. Hence, the role is more about finding patterns in data, generating data visualizations, and communicating the insights to business stakeholders. Find out more about how to become a data analyst or how to become a data scientist in our dedicated articles.
In contrast, a data scientist performs tasks falling in the realm of predictive and prescriptive analytics. For example, taking the example of a ride-hailing software service, a data analyst would analyze the historical impact a promotion had on the ride-hailing activity. On the other hand, a data scientist might work on a matching algorithm that most efficiently matches drivers to riders.
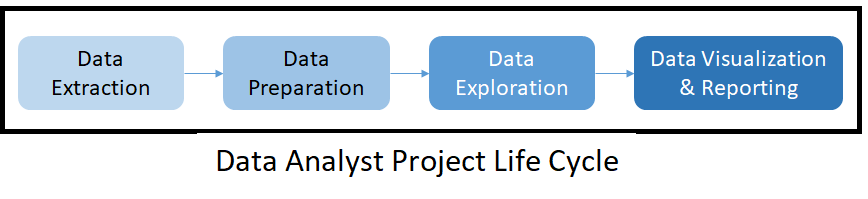
Data Analyst
Detailed below is how the lifecycle of a project handled by a data analyst typically looks.
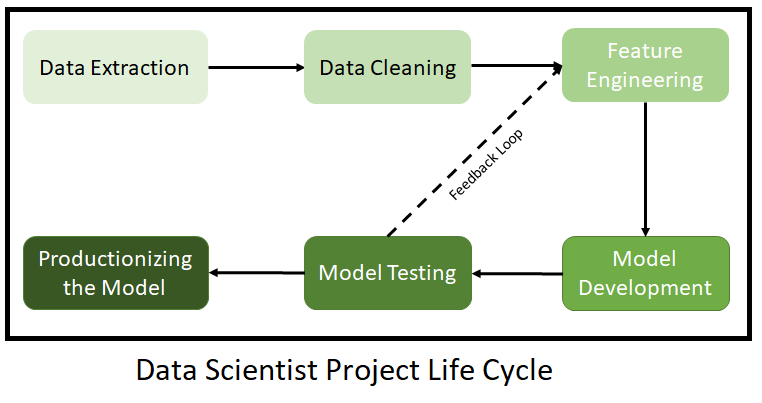
Data Scientist
The process flow chart shown below details the various stages in the project handled by a data scientist.
Now that we have a view on the roles and responsibilities of data analysts and data scientists, the question that follows is which skills will best prepare you for undertaking either of these roles? Here’s a comparative guide on the skill requirements for these roles.
The skill requirements for both roles are very similar. However, the level of proficiency in every skill varies greatly. The table below lists the eight key skills and the level of proficiency in them expected from a data analyst and a data scientist:
| Area of Skill | Data Analyst | Data Scientist |
|---|---|---|
| Data Engineering | Low | Medium |
| Data Exploration | High | High |
| Data Visualization | High | Medium |
| Tools and Programming Languages | Medium | High |
| Data Modeling & Algorithms | Low | High |
| Business Domain Knowledge | High | High |
| Software Engineering | Low | Medium |
| Communication & Presentation | High | High |
| Statistical Analysis | Medium | High |
| Machine Learning | Low | High |
| Big Data Technologies | Low | Medium |
| Data Governance and Compliance | Medium | Medium |
| Project Management | Medium | Low |
| Research & Development | Low | High |
| Data Quality Management | High | Medium |
| Cross-functional Collaboration | High | High |
| Cloud Computing Skills | Low | Medium |
| Data Security and Privacy | Medium | High |
Data Analyst
A project life cycle for a data analyst typically has two stages: Insight generation and insight communication. Let’s understand the skill requirements for each of these stages:
Data Scientist
Though the business problems handled by data scientists seem varied, the projects they manage by and large involve building predictive models and productionalizing them. The skills required to perform these activities are as follows:
This section will give you a high-level view of the educational qualifications a data analyst and a data scientist usually have, their areas of study, and some key emerging trends.
According to Burtch Works Study 2023, the level of education of a data analyst and a data scientist bears a significant impact on their salaries, a finding that will get corroborated in the subsequent section on industry outlook for the two roles.
|
A Look at Educational Qualifications |
|
|
Degree Level Comparison |
Data Scientist |
|
Bachelor's |
31% |
|
Master's |
57% |
|
PhD |
12% |
Source: Burtch Works Study 2023
In 2021, of the total number of data scientists surveyed, 49% held a Ph.D. However, only 19% of data analysts surveyed held a Ph.D.
|
A Comparison of Area of Study |
||
|
Area of Study |
Data Analyst |
Data Scientist |
|
Mathematics/Statistics |
37% |
21% |
|
Business |
21% |
8% |
|
Engineering |
14% |
19% |
|
Economics |
9% |
6% |
|
Computer Science |
8% |
24% |
|
Natural Science |
5% |
21% |
|
Social Science |
5% |
1% |
Source: Burtch Works Study 2021
While computer science emerged as the most popular area of study for data scientists, engineering is gradually picking up pace in its popularity amongst the two roles.
According to the research of Burtch Works Study 2021, the key demographic trends that have emerged for data science and analytics are:
As students and professionals gravitate toward taking up various advanced courses to upskill and re-train themselves, online courses are a great offering that can bundle professional certifications outside the traditional setting of a university.
Given the clear distinction in the roles and responsibilities of a data analyst and a data scientist, DataCamp offers career tracks for both of these roles that meet their specific skill requirements.
This track starts with the basics of the Python programming language for data analysis. After covering the basics, this track dives deeper into data wrangling and data visualization techniques. Also learn to source data from different sources such as the web, databases, and JSON files. In addition, this track provides an overview of exploratory data analysis techniques and upskills the learner on concepts of relational databases and SQL.
This track focuses on the primary skills required by data analysts working with the R programming language. It offers comprehensive content covering the most commonly used R packages like tidyverse, ggplot, and dplyr. Similar to the Python track, the course helps build an intermediate understanding of data analyst skills such as data sourcing, manipulation, and visualization.
This career track helps the learner develop an in-depth understanding of SQL Server, the concepts of relational databases, their design, and performance optimization.
Career tracks for data scientists are available in Python and R. They help the learner deep-dive into the software engineering aspects of Python like object-oriented programming. They also give an overview of statistics and supervised and unsupervised machine learning techniques. The tracks also offer case studies at every milestone to give learners practical exposure to real-life problems.
This course takes the learner on a journey from a beginner to an expert data scientist. Besides introducing Python for data sourcing, data manipulation, and data visualization, it also gives learners an overview of functional and object-oriented programming paradigms. The course provides an in-depth understanding of machine learning algorithms across supervised, unsupervised, and clustering categories. In addition to learning data science concepts, the learner also gets exposure to real-life project challenges through relevant case studies.
For data scientists working with the R programming language, this career track delves deep into R and introduces the functional programming approach to the learners. This course also includes an in-depth introduction to machine learning algorithms like regression, classification, and clustering, to name a few.
The following certifications help bridge the data skill gap that exists in the job market. They ensures that the right skill meets the right opportunity as the learners can showcase their skills while the employer gains confidence in hiring the right talent. The programs validate the learner’s ability in several key areas, including data management, exploratory analysis, statistical experimentation, model development, coding for production environments, and communication and reporting. Expert feedback and mentoring sessions also help the learner acquire the confidence for being job-ready. DataCamp offers two certifications, one for data scientists and one of data analysts.
The DataCamp professional data scientist certification has four stages:
The DataCamp professional data analyst certification has five stages:
Learn more about DataCamp’s certification programs here:
DataCamp’s Data Scientist Certification Programs
DataCamp's Data Analyst Certification Program
The Burtch Works Study from 2021 reviews the salaries of data science and data analytics professionals. This study indicates that the hiring landscape for data science and analytics teams looks promising. The study reports that 73% of data science and analytics teams planned to hire in Q1/Q2 of 2021 compared to 67% in January 2020. Moreover, around 81% of data science and analytics teams plan to recruit in Q3/Q4 of 2021. This is a significant increase compared to the numbers for the first half of 2021.
The table below summarizes the salary trends for a data analyst and a data scientist by level. These trends are for both the role of an individual contributor and a manager. These levels also give a high-level overview of how the career paths of a data analyst and a data scientist can evolve.
|
Median Salary Comparison of Individual Contributors (IC) |
|||||
|
Median Salaries (USD) 2021 |
|||||
|
IC Levels |
Data Analyst |
Data Scientist |
Job Responsibility |
Avg. Years of Exp. |
|
|
Level 1 |
80,000 |
95,000 |
Beginner stage and hands-on with analytics & modeling |
0-3 years |
|
|
Level 2 |
103,500 |
130,000 |
Intermediate level of expertise, hands-on, can assist in training analysts |
4-8 years |
|
|
Level 3 |
135,000 |
160,000 |
Subject Matter Expert, can take up mentorship roles and can independently train analysts |
9+ years |
|
Source: The Burtch Works Study 2021
|
Median Salary Comparison of Managers |
||||
|
Median Salaries (USD) 2021 |
||||
|
Manager Levels |
Data Analyst |
Data Scientist |
Job Responsibility |
|
|
Level 1 |
135,000 |
150,000 |
Should be able to lead a small team w/in a function, execute a project and be tactical |
|
|
Level 2 |
180,000 |
200,000 |
Should be able to lead entire function, handle a moderately sized team and execute strategy |
|
|
Level 3 |
250,000 |
250,000 |
Holds a position in senior/executive management, handles a large team and determines the strategy |
|
Source: The Burtch Works Study 2021
An individual contributor is solely responsible for their performance alone. Their work doesn’t require them to manage a team. A manager, however, supervises the work of other employees as well.
Both data analysts and data scientists are similar as they both work extensively with data; they simply differ when it comes to how they handle data. Some of the key differentiating parameters include their educational backgrounds, the size of data they work with, and the level of programming used by them. Though a data scientist is more likely to get a higher salary, this role also assumes greater responsibilities and expectations. If you're still undecided about which path to pursue, you might want to intially try a course or two from each path to gain a clearer of idea of which kind of working with data you prefer.
Learn with DataCamp
Track
Track
Track
blog
Karlijn Willems
11 min
blog
Austin Chia
8 min
blog
Travis Tang
10 min
blog
Matt Crabtree
15 min
blog
Jose Jorge Rodriguez Salgado
12 min
blog
Javier Canales Luna
11 min