Track
Whether you are adding a data project to your portfolio or you’re starting your first project as a paid data scientist, your first task will be to find a suitable data set. So, what is a data set, and where do you find them?
Data is everywhere, but finding a reputable, accessible source of information to answer the particular questions you’re looking for can be much harder than it seems. But the start of every great data project begins with finding a good data set. In this tutorial, we’ll briefly go over what kinds of data sets are out there, how to find them, and what to do with them once you do.
What Are Data Sets?
A data set is simply a collection of information. Usually, this information is organized in some fashion, though you may find that it is not organized in a way that is immediately useful for your context, and it will need a bit of work on your part to make it usable.
There are several types of data that may be organized in different ways. Common types of data sets include:
- Tabular data, which is arranged in tables, like spreadsheets
- Relational data, which is a collection of tables connected through relationships
- Time-series data, which is data that is ordered chronologically.
Other data sets may include collections of images, text documents, or audio or video recordings.
Where Can I Find Data Sets?
Searching for reliable data sets to work with can be a time-consuming task. There are many free data sets available, although many others are paid or even proprietary.
Finding the data you need to start your project may be complicated by paywalls, legal issues, IP rights or in some cases, the exact data you are looking for may not even exist.
In these latter cases, you may need to get creative about what you can do with the data you can get, or you may even need to collect your own data (which may be a whole project on its own). Check out this web scraping with Python course, this understanding data science course, or this data science for business course to get some ideas on data collection.
DataCamp has a readily accessible collection of curated data sets on a variety of topics. This can be a great place to look, especially if you are not sure where to start.
Other great locations include government websites, non-profit organizations’ websites, universities, and libraries. Below is a table with several great resources for finding interesting data sets.
|
Source of Data sets |
Web Link |
|
DataCamp |
https://www.datacamp.com/workspace/datasets |
|
Google Dataset Search |
https://datasetsearch.research.google.com/ |
|
Data.gov |
https://data.gov/ |
|
Datahub |
https://www.datahub.io/search |
|
UCI Machine Learning Repository |
https://archive.ics.uci.edu/ |
|
Kaggle |
https://www.kaggle.com/datasets |
|
Library of Congress |
https://guides.loc.gov/datasets |
|
US Census Bureau |
https://www.census.gov/data/datasets.html |
|
Federal Trade Commission |
https://www.ftc.gov/policy-notices/open-government/data-sets |
|
World Health Organization |
https://www.who.int/data/sets |
|
Centers for Disease Control and Prevention |
https://open.cdc.gov/data.html |
|
National Institutes for Health |
https://www.ncbi.nlm.nih.gov/datasets/ |
A crucial step when choosing a data source is assessing its quality and reliability. Most importantly, you’ll want to verify that your data source is reputable. Each of DataCamp’s data sets has a link to the source material, allowing you to easily verify its authenticity.
With other data sources, you may need to do a bit more digging to ensure you are using reliable data. Reliability factors you should consider include how the data was collected, which populations are represented by the data, and whether there were any biases in the collection process.
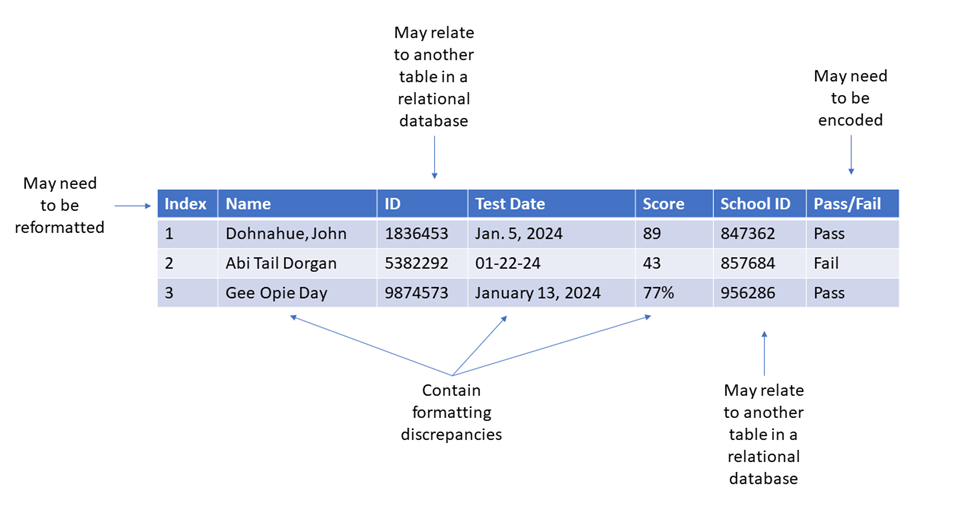
Another factor to consider when choosing a data set is how much cleaning and wrangling is necessary to get the data into a usable format. Choosing a more curated data set may save you time. However, it is often unavoidable to use messier data which requires significant effort to ensure fields are in the same format, missing values are addressed, and duplicate data is deleted.
This data cleaning tutorial will help you address some of these problems.
Exploring Data Set Structures
There is some standard terminology describing the parts of a data set that are useful to know.
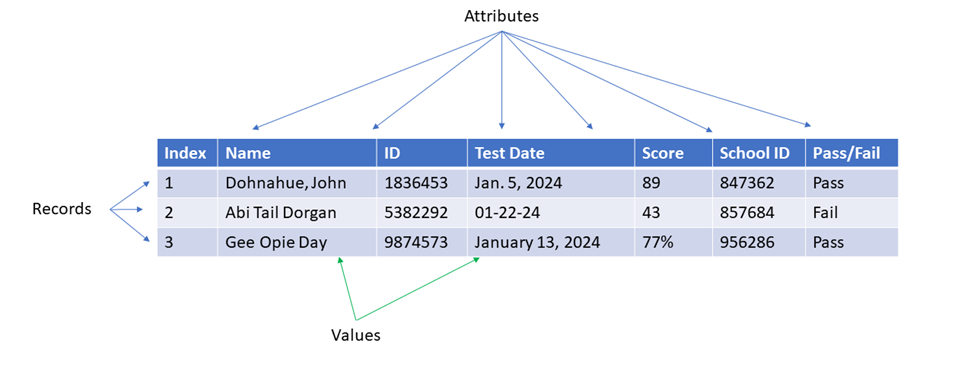
Tabular data sets are composed of rows and columns. Typically, each row is a single record, and each column signifies an attribute or variable of that record.
Each data cell at the intersection of a row and column contains one value. An index gives every record an individual number. The header, or first row of each column, is generally the name of the attribute or column. In a relational database, individual tables may be connected by relations.

When you first obtain a data set, it is important to examine it and identify some of these key features. There are many options for viewing your data set, including loading it into Python, SQL, R, or Matlab and calling specific rows to be displayed.
Depending on the file type and size, you may even be able to open it directly in Microsoft Excel or Google Sheets and view it there. Keep in mind that if your data set is very large, loading the entire data set at once will take a lot of memory, so you may need to view it in chunks.
Cleaning and Preparing Data Sets
Often, after securing a data set for your project, the next step will be a lot of cleaning and preparation to get the data into a usable format. Choosing a curated data set, such as what you would find on DataCamp, will limit the amount of cleaning necessary.
However, you will still likely need to adapt the data set to meet your needs. This is especially true if you are pulling data from multiple sources for your project.

When cleaning and preparing your data sets, some common tasks you may need to perform include:
- Removing data that is not relevant to your analysis
- Identifying and removing duplicate data entries
- Correcting typos, capitalization errors, or inconsistent naming conventions
- Removing or imputing missing data
- Encoding categorical data to a numerical format
- Transforming data to a consistent format
- Ensuring consistency and accuracy within your data set
Check out these courses for more information on cleaning data in Python or cleaning data in SQL server databases.
Exploratory Data Analysis
Exploratory data analysis can help you truly understand your data set, a crucial step before diving into a more complex analysis. Many junior data professionals skip this critical step to their own demise.
I strongly advise you to perform several exploratory analyses on your data set before venturing into any modeling, machine learning, or any other more complex analyses.
This step will help you catch any oddities, inconsistencies, or problems with your data set. It will help to guide you towards an appropriate analysis later on and will help you detect and correct any anomalous results.
This exploratory step should take multiple forms, from descriptive statistics to simple visualizations. For most tabular data sets, summary statistics, such as the mean, median, and standard deviation, along with some simple scatter plots or bar charts can give you an insightful glimpse at the patterns and behavior of your data.
I encourage you to take the time to plot as many variables in your data set as is reasonable. Although this step may not make it to the final dashboard, report, or application you intend for the endpoint of your project, it will help to guide you in your process. Learn more about exploratory data analysis in Python or exploratory data analysis in R.
Showcasing Your Data Story
The end goal of every data project is to present your findings to interested parties. Whether your audience is a business stakeholder, a potential employer, or a data colleague, it’s important for your insights to be clear and easily interpretable.
A simple graph with a descriptive title is sometimes all you need. Other times, a more involved dashboard may be necessary. Whatever you choose, you’ll want to ensure that your interpretation is true to your data set.

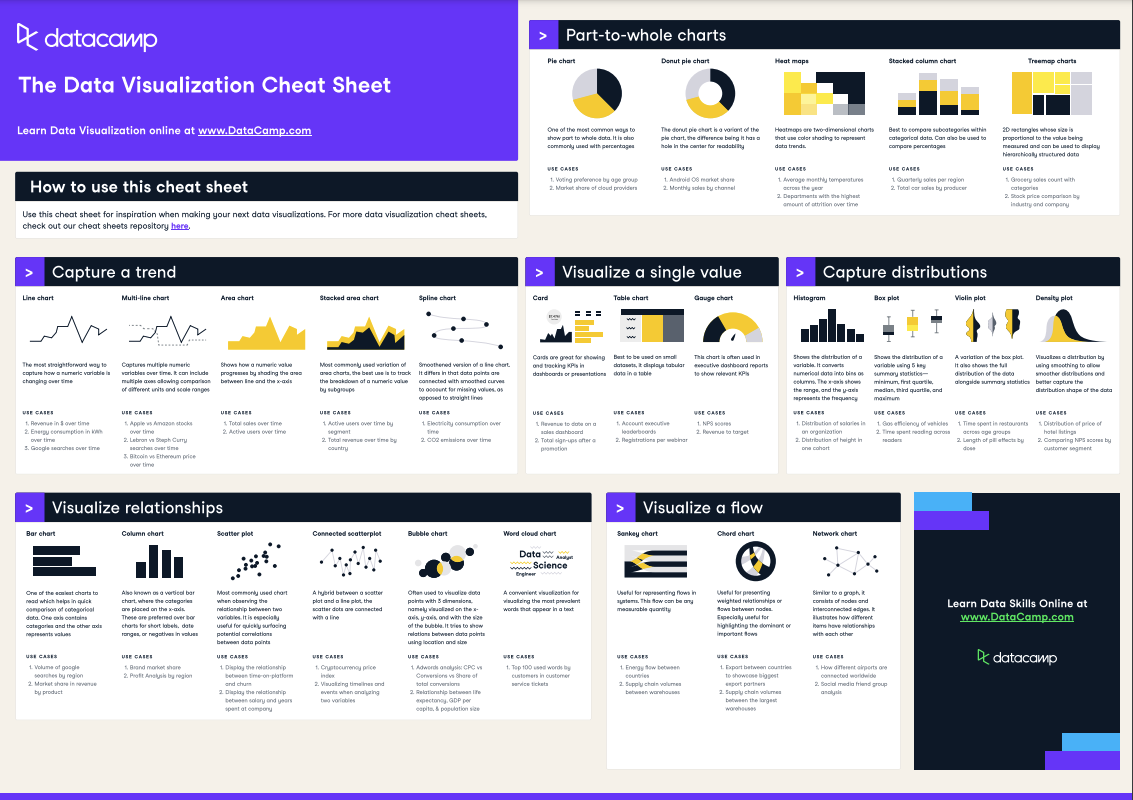
Our data visualization cheat sheet can help you choose the best way to showcase your data sets.
The goal should be to honestly convey to your audience what the data set represents and how it answers your questions. Check out the data storytelling skill track to master this essential data skill.
Data camp is a great venue for showcasing your data portfolio. Other popular choices for hosting a data portfolio include a GitHub repository or a professional webpage. Wherever you host your project, you’ll want to ensure that it is easily accessible to your desired audience.
Conclusion
Information is at the core of data science. Data sets collect information in one place, making it possible to identify trends, make predictions, and push humanity forward. Finding data sets to analyze may seem daunting at first. But knowing a few places to start looking can make all the difference. Check out DataCamp’s selection of interesting data sets and see what inspires you!

I am a PhD with 13 years of experience working with data in a biological research environment. I create software in several programming languages including Python, MATLAB, and R. I am passionate about sharing my love of learning with the world.

