
Cours
Créer des agents IA avec Google ADK
1 h
6.5K
Gemini 3 Pro is the state-of-the-art AI model we have all been waiting for, featuring a massive one-million-token context window that effortlessly handles datasets, documents, videos, and codebases in a single pass. It delivers PhD-level reasoning while excelling at multimodal processing of text, images, audio, and video for seamless creative workflows.
In this project-based tutorial, I will show you how to use the Gemini 3 API to build multi-agent applications that use a CSV dataset provided by the user and perform deep data analytics.
In short, the multi-agent app will perform:
If you're keen to learn more about building agentic AI workflows, I recommend checking out our guide to Google Antigravity, Gemini 3 Flash tutorial, and the AI Agent Fundamentals skill track.
1. Run this command to install all required packages for our multi-agent app:
!pip install -q google-genai langgraph langsmith grandalf pydantic pandas matplotlib markdown2 weasyprint markdown-it-py mdit-py-pluginsPackage Breakdown:
Note: We are using Jupyter Notebook to build this project.
2. Go to Google AI Studio and generate your API key. Make sure you have billing set up on your account, as the Gemini 3 Pro model is not available in the free tier.
3. Next, create a free LangSmith account and generate the API key.
4. Save both API keys as environment variables in your local system. Set LANGSMITH_API_KEY and GEMINI_API_KEY.
5. Import all the necessary Python packages in your notebook:
from google import genai
from google.genai import types
from pydantic import BaseModel
from langgraph.graph import StateGraph, END
import os, json, textwrap, traceback
from pathlib import Path
import pandas as pd
import markdown2
import weasyprint
6. Set the environment variables to specify the LangSmith project name and enable LangSmith tracking:
os.environ["LANGSMITH_TRACING"] = "true"
os.environ["LANGSMITH_API_KEY"] = os.environ.get("LANGSMITH_API_KEY", "YOUR_LANGSMITH_KEY")
os.environ["LANGSMITH_PROJECT"] = os.environ.get("LANGSMITH_PROJECT", "autolab-gemini3pro")
7. Create the folder where all the images and PDFs will be saved:
ARTIFACTS_DIR = Path("artifacts")
ARTIFACTS_DIR.mkdir(exist_ok=True)In this section, we will set up a Gemini API client and wrap calls to the model so they can be traced and logged in LangSmith. Additionally, we will extract token usage metadata and return it in a LangSmith-friendly format.
First, we will initialize the Gemini GenAI client by providing the API key:
client = genai.Client(api_key=os.environ["GEMINI_API_KEY"])
MODEL = "gemini-3-pro-preview"
Next, we will write a small wrapper around a Gemini model call to enable automatic tracing by LangSmith. Using the @traceable decorator, we register the function as an LLM run.
Within this function, the code will send the prompt to Gemini and extract token usage details, which are essential for accurate LangSmith tracking, following the tracing guidelines.
Finally, the function will return the model’s text output along with token statistics and the raw response in the format that LangSmith expects, ensuring that the run is displayed accurately in the UI.
from langsmith import traceable
@traceable(name="gemini_generate_content", run_type="llm")
def gemini_call(prompt: str, thinking_level: str = "high"):
    """
    Gemini wrapper that:
    - uses correct ThinkingConfig schema
    - returns LangSmith LLM-run format so token usage shows in UI
    """
    resp = client.models.generate_content(
        model=MODEL,
        contents=prompt,
        config=types.GenerateContentConfig(
            thinking_config=types.ThinkingConfig(thinking_level=thinking_level)
        ),
    )

    usage = getattr(resp, "usage_metadata", None)
    token_usage = None
    if usage:
        token_usage = {
            "prompt_tokens": usage.prompt_token_count,
            "completion_tokens": usage.candidates_token_count,
            "total_tokens": usage.total_token_count,
            "thoughts_tokens": getattr(usage, "thoughts_token_count", None),
        }

    return {
        "generations": [{"text": resp.text}],
        "llm_output": {
            "model_name": MODEL,
            "token_usage": token_usage,
        },
        "raw_response": resp,
}We will now create tools that provide dataset inspection, safe Python execution, and Markdown‑to‑PDF report generation that will be used inside an AI agent workflow.
This tool takes a file path, reads the CSV into a pandas DataFrame using, and then builds a summary containing the dataset shape, column names, each column’s data type, missing‑value percentages, the first five rows, and full descriptive statistics. It returns this summary so an agent can quickly understand the dataset.
def load_dataset(path: str):
    df = pd.read_csv(path)

    summary = {
        "shape": df.shape,
        "columns": list(df.columns),
        "dtypes": {c: str(t) for c, t in df.dtypes.items()},
        "missing_pct": df.isna().mean().to_dict(),
        "head": df.head(5).to_dict(orient="records"),
        "describe": df.describe(include="all").fillna("").to_dict()
    }
return summaryThis tool safely runs dynamically generated Python code inside a restricted environment. It prepares a small local environment, then executes the provided code with exec.
The executed code is expected to return artifact paths (like saved plots) and metadata.
def run_python(code: str):
    """
    Generated code MUST:
      - save plots to ARTIFACTS_DIR
      - collect paths in _artifacts (list[str])
      - collect meta in _charts_meta (list[dict])
      - optionally set _stdout (string)
    """
    local_env = {"ARTIFACTS_DIR": ARTIFACTS_DIR}
    try:
        exec(textwrap.dedent(code), {}, local_env)
        return {
            "ok": True,
            "stdout": local_env.get("_stdout", ""),
            "artifacts": local_env.get("_artifacts", []),
            "charts_meta": local_env.get("_charts_meta", []),
        }
    except Exception:
return {"ok": False, "traceback": traceback.format_exc()}This tool converts Markdown into a nicely formatted PDF. It first builds a markdown parser that supports tables, lists, task lists, and footnotes.
Then render_pdf converts the markdown text into HTML, wraps it in a custom CSS‑styled template (controlling fonts, table appearance, image sizing, etc.), and uses WeasyPrint to generate a PDF file.
Finally, it saves the PDF into the artifacts folder and returns the path.
from markdown_it import MarkdownIt
from mdit_py_plugins.tasklists import tasklists_plugin
from mdit_py_plugins.footnote import footnote_plugin

# Create a strong markdown parser once (supports tables, lists, etc.)
md = (
    MarkdownIt("commonmark", {"breaks": True, "html": True})
    .enable(["table", "strikethrough"])
    .use(tasklists_plugin)
    .use(footnote_plugin)
)

def render_pdf(markdown_text: str):
    """
    Better Markdown -> HTML -> PDF:
    - proper tables
    - stable lists
    - centered/small images
    - clean page breaks
    """
    html_body = md.render(markdown_text)

    html_template = f"""
    <html>
    <head>
      <meta charset="utf-8">
      <style>
        body {{
          font-family: Arial, sans-serif;
          font-size: 12px;
          line-height: 1.5;
          color: #111;
        }}

        h1 {{ font-size: 20px; margin-bottom: 6px; }}
        h2 {{ font-size: 16px; margin-top: 18px; margin-bottom: 6px; }}
        h3 {{ font-size: 13px; margin-top: 12px; margin-bottom: 4px; }}

        p {{ margin: 6px 0; }}

        ul, ol {{
          margin: 6px 0 6px 18px;
        }}
        li {{ margin: 2px 0; }}

        table {{
          width: 100%;
          border-collapse: collapse;
          margin: 8px 0 12px 0;
          font-size: 11px;
        }}
        th, td {{
          border: 1px solid #ccc;
          padding: 6px;
          text-align: left;
        }}
        th {{ background: #f2f2f2; }}

        img {{
          display: block;
          margin: 8px auto 8px auto;
          max-width: 70%;
          height: auto;
          page-break-inside: avoid;
        }}

        .chart-block {{
          page-break-inside: avoid;
          margin-bottom: 12px;
        }}

        code {{
          background: #f6f6f6;
          padding: 2px 4px;
          border-radius: 4px;
          font-size: 11px;
        }}
        pre code {{
          display: block;
          padding: 8px;
          overflow-x: auto;
        }}
      </style>
    </head>
    <body>
      {html_body}
    </body>
    </html>
    """

    pdf_path = ARTIFACTS_DIR / "report.pdf"
    weasyprint.HTML(
        string=html_template,
        base_url=str(ARTIFACTS_DIR.parent.resolve())
    ).write_pdf(str(pdf_path))

    return str(pdf_path)
This simply registers all three functions as available tools for the agent to use.
TOOLS = [load_dataset, run_python, render_pdf]This class defines a shared state object that holds everything the agent workflow produces: like the dataset path, profiling info, generated plan, code, execution results, insights, and final report, plus retry limits and error messages to prevent infinite loops.
class State(BaseModel):
    dataset_path: str
    profile: dict | None = None
    plan: dict | None = None
    code: str | None = None
    exec_result: dict | None = None
    charts_meta: list | None = None
    insights: str | None = None
    report_md: str | None = None
    report_pdf: str | None = None

    retry_count: int = 0          # NEW: stop infinite loops
    last_error: str | None = None # NEW: pass traceback to coder

MAX_RETRIES = 2We will now create AI agents that will work together to profile the dataset, write and execute analysis code, generate insights, and produce a final PDF report.
This agent is responsible for understanding the dataset and creating a structured analysis plan. It first loads the dataset using the load_dataset tool, which gives it a summary containing shapes, missing values, column types, descriptive stats, and example rows.
Then it sends this dataset summary to the LLM with very explicit instructions: identify the task type, select a target column if applicable, decide what exploratory steps should be taken, propose the charts that should be generated, and outline any modeling steps if the dataset suggests classification or regression.
The LLM returns a JSON structure representing this plan, and the agent parses it, falling back to storing raw text if JSON parsing fails.
Finally, it saves both the dataset profile and the generated plan into the shared state so the next agents have all the information they need.
@traceable(name="profiler_agent")
def profiler_agent(state: State):
    profile = load_dataset(state.dataset_path)

    prompt = f"""
    You are the Data Profiler Agent.
    Produce a JSON analysis plan with:
      - task_type: "classification"|"regression"|"eda_only"
      - target_column (if any)
      - eda_steps (list)
      - charts_to_make (list)  # 5-10 max, most informative
      - baseline_model_steps (list if modeling)
      - risks_or_data_issues (list)

    Dataset profile:
    {json.dumps(profile, indent=2)}
    """

    resp = gemini_call(prompt, thinking_level="high")
    text = resp["generations"][0]["text"]

    try:
        plan = json.loads(text)
    except:
        plan = {"raw_plan": text}

    state.profile = profile
    state.plan = plan
return stateThis agent converts the analysis plan into executable Python code. It receives the dataset profile, the plan, and any previous execution error. Using all that context, it asks the LLM to output only Python code.
The prompt includes strict requirements: load the dataset, follow the plan exactly, generate each specified chart, save plots into ARTIFACTS_DIR, track paths and chart metadata, capture console output, close figures after saving, and optionally compute modeling metrics.
This ensures the code is reproducible and safe in the sandbox. The result is stored in state.code, ready for the executor to run.
@traceable(name="code_writer_agent")
def code_writer_agent(state: State):
    prompt = f"""
    You are the Code Writer Agent.
    Write Python code ONLY (no markdown).

    Previous error to fix (if any):
    {state.last_error}

    HARD REQUIREMENTS:
    1. Load dataset from: {state.dataset_path}
    2. Follow the plan exactly.
    3. Create ALL charts in charts_to_make.
    4. Save every chart in ARTIFACTS_DIR with filenames like:
         ARTIFACTS_DIR / "chart_01_<short_name>.png"
    5. Track saved plot paths in _artifacts (list[str]).
    6. Track chart metadata in _charts_meta (list[dict]) with:
         {{
           "title": "<human readable chart title>",
           "filename": "artifacts/chart_01_x.png",
           "description": "<what this plot shows (1-2 sentences)>",
           "one_liner": "<ONE line insight from the chart>"
         }}
       The one_liner MUST be a single sentence, max ~20 words.

    7. Store useful console output in _stdout.

    IMPORTANT:
    - import matplotlib.pyplot as plt
    - plt.close() after saving each plot
    - ensure _artifacts and _charts_meta exist even if empty
    - if modeling, add baseline metrics to _stdout

    Dataset profile:
    {json.dumps(state.profile, indent=2)}

    Analysis plan:
    {json.dumps(state.plan, indent=2)}

    Return ONLY executable python code.
    """

    resp = gemini_call(prompt, thinking_level="high")
    state.code = resp["generations"][0]["text"]
return stateThis agent runs the Python code produced by the Code Writer using the isolated run_python sandbox. It captures execution results, chart metadata, standard output, and any artifacts created.
If the code runs successfully, the results are stored and the workflow proceeds normally. If it fails, the agent increments the retry counter and stores the traceback so the Code Writer agent can fix the error on the next attempt.
With MAX_RETRIES limiting the loop, this agent prevents infinite cycling and provides the feedback signals needed for self‑correction.
@traceable(name="executor_agent")
def executor_agent(state: State):
    result = run_python(state.code)
    state.exec_result = result
    state.charts_meta = result.get("charts_meta", [])

    if not result["ok"]:
        state.retry_count += 1
        state.last_error = result.get("traceback", "Unknown error")

return stateThis agent interprets the entire analysis. It takes the dataset profile, execution output, and the chart metadata, and produces human‑readable analytical insights.
It instructs the LLM to generate structured insights: for each chart, produce two takeaways and one risk, then generate a limited set of overall insights.
The agent must ensure no empty bullets, no repeated points, and insights must be specific to the dataset, not generic.
The resulting insight report is stored in state.insights, becoming an input for the final reporting stage.
@traceable(name="insights_agent")
def insights_agent(state: State):
    prompt = f"""
    You are the Insights Agent.

    HARD REQUIREMENTS:
    - No empty bullets.
    - No repeated bullets.
    - Be specific to this dataset and these charts.
    - Output format:

      ### Chart Insights
      For each chart in charts_meta:
      - **<title>**
        - Takeaway 1 (one sentence)
        - Takeaway 2 (one sentence)
        - Caveat/Risk (one sentence)

      ### Overall Insights
      - 3-5 bullets max, each one sentence.

    Inputs:
    Profile:
    {json.dumps(state.profile, indent=2)}

    Execution result:
    {json.dumps(state.exec_result, indent=2)}

    Charts meta:
    {json.dumps(state.charts_meta, indent=2)}
    """

    resp = gemini_call(prompt, thinking_level="high")
    state.insights = resp["generations"][0]["text"]
return stateThis is the final synthesis agent. It uses the complete pipeline outputs: profile, insights, chart metadata, execution logs, and crafts a full, clean Markdown report.
The prompt forces strict formatting rules: no repeated titles, consistent spacing, every chart displayed exactly once in a standardized HTML block, and insights integrated cleanly.
Once the Markdown is produced, the agent calls render_pdf to convert it into a polished PDF using WeasyPrint. Both the Markdown and the PDF path are stored in the shared state, completing the analysis workflow.
@traceable(name="report_agent")
def report_agent(state: State):
    prompt = f"""
    You are the Report Agent.
    Create a neat Markdown report (HTML allowed).

    HARD REQUIREMENTS:
    - Do NOT repeat section titles or chart titles.
    - Do NOT output empty bullet points. If a bullet would be empty, skip it.
    - Keep spacing consistent: one blank line between sections.
    - Use charts_meta as the ONLY source of charts.
    - Include EVERY chart, exactly once, in the same order as charts_meta.
    - For each chart output EXACTLY this block:

      <div class="chart-block">
        <h3>Chart {{i}}: {{title}}</h3>
        <img src="{{filename}}" alt="{{title}}">
        <p><b>What it shows:</b> {{one_liner}}</p>
      </div>

      Where:
      - title, filename, one_liner come from charts_meta
      - one_liner must be ONE sentence, max ~20 words.

    Sections:
    1. Dataset Overview (short)
    2. Data Quality Notes (bullets)
    3. Exploratory Analysis (chart-by-chart blocks only, no extra chart titles)
    4. Modeling Results (if any; use a markdown table)
    5. Key Insights (use insights text)
    6. Recommendations / Next Steps (bullets)

    Inputs:
    Profile: {json.dumps(state.profile, indent=2)}
    Exec stdout: {state.exec_result.get("stdout","")}
    Exec ok: {state.exec_result.get("ok")}
    Traceback (if any): {state.exec_result.get("traceback","")}
    Charts meta:
    {json.dumps(state.charts_meta, indent=2)}
    Insights:
    {state.insights}

    Return ONLY the Markdown report.
    """

    resp = gemini_call(prompt, thinking_level="low")
    state.report_md = resp["generations"][0]["text"]
    state.report_pdf = render_pdf(state.report_md)
return stateThis final step involves constructing the complete multi-agent workflow by assembling all agents into a state-driven graph.
A StateGraph is created using a shared State model, ensuring that every agent interacts with the same evolving state object as the workflow progresses. Each component, such as the profiler, code writer, executor, insights writer, and report builder, is added to the graph as a distinct node, representing a specific stage in the pipeline.
The workflow always starts with the profiler agent, which is designated as the entry point. This ensures that the process begins with a thorough understanding of the dataset and the generation of an analysis plan.
Edges are established to define the flow of the process. After profiling, the output is directed to the code writer, which then feeds into the executor. The key logic lies in the conditional routing from the executor.
A helper function, retry_or_continue, examines the execution result. If the code executes successfully, the workflow proceeds to the insights agent.
If it fails but still has retries available, it loops back to the code writer for automatic correction.
If there are no retries left, it bypasses further analysis and moves directly to the report generator, ensuring that the system does not enter an endless loop. The conditional edges are incorporated into the executor node so that the workflow can adapt based on the success or failure of execution.
Finally, the graph connects the insights stage to the report stage, and from the report stage to the conclusion of the workflow. The graph is then compiled into an executable structure, and an ASCII diagram is generated to visualize the flow.
This multi-agent graph orchestrates the entire adaptive analysis pipeline, enabling error recovery, step-by-step coordination, and smooth transitions between agents.
g = StateGraph(State)

g.add_node("profiler", profiler_agent)
g.add_node("code_writer", code_writer_agent)
g.add_node("executor", executor_agent)
g.add_node("insights", insights_agent)
g.add_node("report", report_agent)

g.set_entry_point("profiler")
g.add_edge("profiler", "code_writer")
g.add_edge("code_writer", "executor")

def retry_or_continue(state: State):
    # success path
    if state.exec_result and state.exec_result.get("ok"):
        return "insights"
    # stop retrying after MAX_RETRIES
    if state.retry_count >= MAX_RETRIES:
        return "report"
    return "code_writer"

g.add_conditional_edges(
    "executor",
    retry_or_continue,
    {"code_writer": "code_writer", "insights": "insights", "report": "report"}
)

g.add_edge("insights", "report")
g.add_edge("report", END)

graph = g.compile()

print(graph.get_graph().draw_ascii())
+-----------+
| __start__ |
+-----------+
*
*
*
+----------+
| profiler |
+----------+
*
*
*
+-------------+
| code_writer |
+-------------+
.
.
.
+----------+
| executor |
+----------+
.. ..
.. ..
. ..
+----------+ .
| insights | ..
+----------+ ..
** ..
** ..
* .
+--------+
| report |
+--------+
*
*
*
+---------+
| __end__ |
+---------+ To run the full pipeline, you simply provide a dataset path, create an initial State object, and invoke the compiled graph. In our case, we are providing it with the Boston Housing dataset.
DATASET_PATH = "/work/housing.csv"  # <-- change this

state = State(dataset_path=DATASET_PATH)
out = graph.invoke(state)
Once invoked, the multi‑agent system automatically performs the entire analysis: profiling the dataset, generating a plan, writing and executing Python code, extracting insights, and producing both a Markdown and a PDF report.
--- Modeling Baseline Results ---
Dataset Shape: (489, 4)
Linear Regression -> RMSE: 82,395.54, R2: 0.6911
Random Forest     -> RMSE: 56,931.38, R2: 0.8525
Observations: Random Forest typically outperforms Linear Regression due to capturing non-linear relationships (e.g., LSTAT).
After the run finishes, you can open your LangSmith dashboard and navigate to the “autolab-gemini3pro” project. Every agent run appears there.
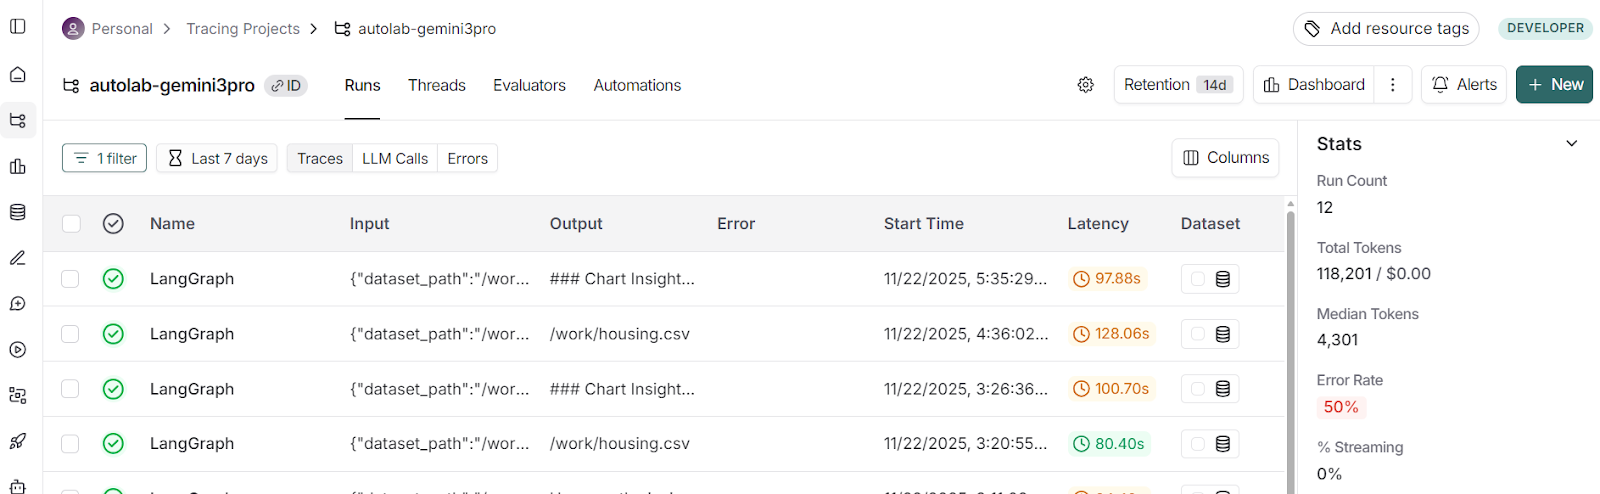
Clicking on the recent run and switching to the Waterfall view displays the timeline of each step: how long the agents took and which tools they used.

You can click into any agent to inspect:
LangSmith was instrumental in improving the entire workflow. What you see is the final version, but it took many tries to get this project right, and Langsmith helped me debug the issues in the agents.
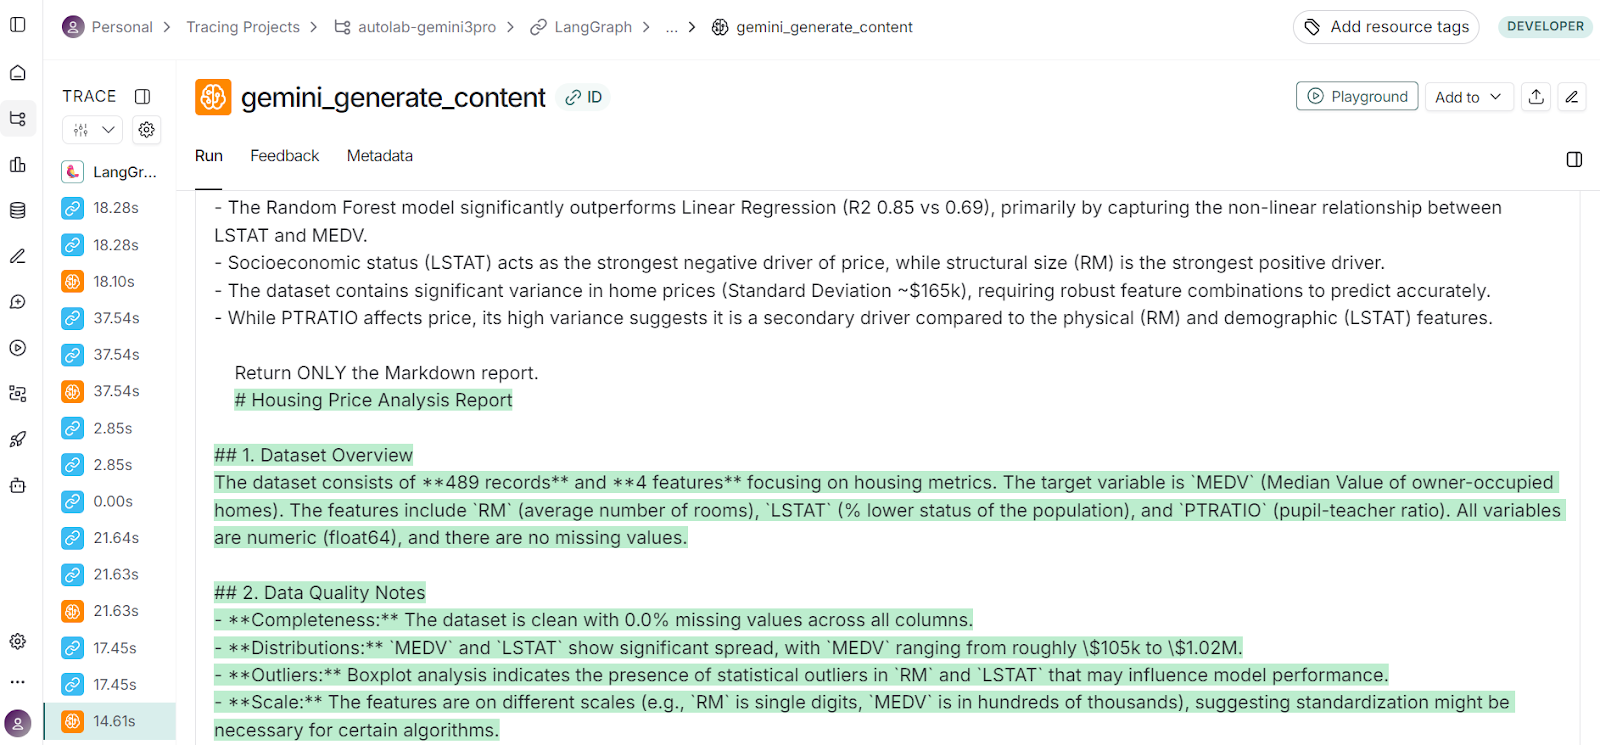
Once the multi‑agent workflow completes, you can directly inspect the generated Markdown report inside your notebook.
The Markdown version is useful for quickly reviewing the analysis, reading insights, and examining the report structure without leaving your workspace.
print(out["report_md"][:2000])# Housing Price Analysis Report
## 1. Dataset Overview
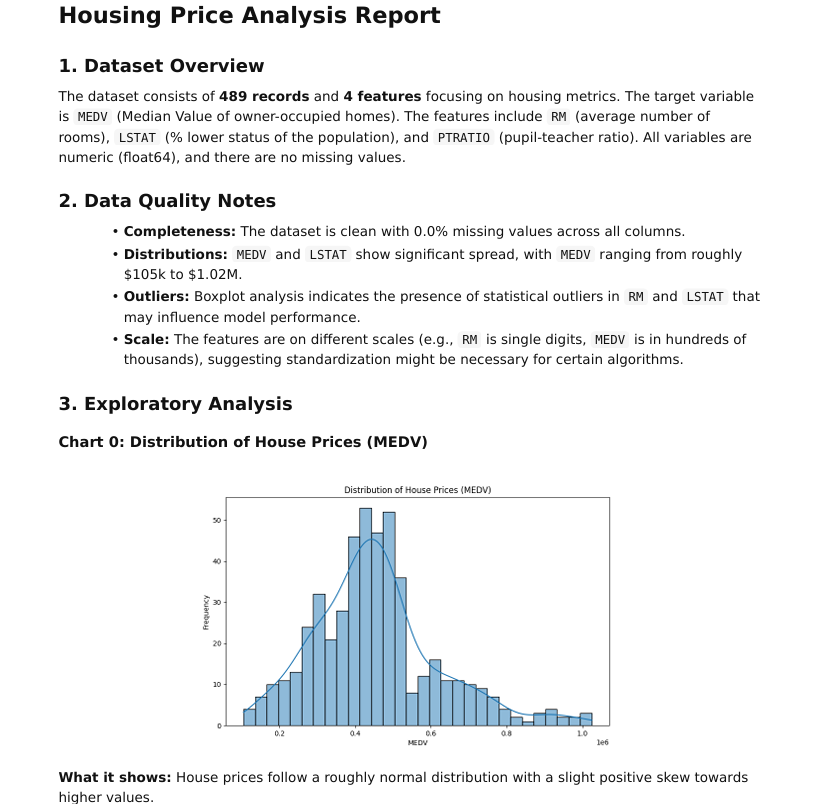
The dataset consists of **489 records** and **4 features** focusing on housing metrics. The target variable is `MEDV` (Median Value of owner-occupied homes). The features include `RM` (average number of rooms), `LSTAT.............In addition to the Markdown, the workflow also produces a polished PDF report. The PDF is saved automatically in the artifacts folder, and you can view the path like this:
print("PDF saved at:", out["report_pdf"])PDF saved at: artifacts/report.pdfThe generated PDF is perfect and contains all key components of the analysis: narrative explanations, visually rendered charts, chart interpretations, modeling summaries, and final recommendations.
This makes it ideal for sharing with teammates, supervisors, or clients, especially when you want a clean, presentation-ready version of the results.
Working on this project made it clear just how far modern AI models and graph‑based agent workflows have evolved. Not long ago, building even a single agent with multiple tools required days of tuning, debugging, and dealing with unpredictable behaviors.
Today, with models like Gemini 3 Pro, the system can understand the dataset, generate accurate code, run analyses, interpret visualizations, and assemble a polished report with remarkable reliability.
In this project, we have built a complete multi‑agent data‑analysis application capable of taking any CSV dataset, performing end‑to‑end exploratory analysis, running baseline models, generating insights, and producing a fully formatted PDF report.
This project uses five coordinated agents: profiling & planning, code generation, execution with retries, insights generation, and reporting, and three core tools for dataset loading, safe code execution, and Markdown‑to‑PDF rendering.
The result is a clean, automated analysis flow that produces a professional, narrative‑driven report supported by visualizations.
Top DataCamp Courses
Cours
Cours
Cours
Tutoriel
Abid Ali Awan
Tutoriel
Abid Ali Awan
Tutoriel
Abid Ali Awan
Tutoriel
Aashi Dutt
Tutoriel
Natasha Al-Khatib
Tutoriel
François Aubry