If you are interested in learning more about statistics in spreadsheets, take DataCamp's Statistics in Spreadsheets course.
In 1900 Karl Pearson developed published a paper on the χ2 test, which is considered to be one of the foundations of modern statistics. In this paper, Pearson investigated the test of goodness of fit (Source). Chi-square test is a non-parametric test (a non-parametric statistical test is a test whose model does not specify conditions about the parameter of the population from which the sample is drawn.). It is used for identifying the relationship between a categorical variable and denoted by χ2.
The chi-squared test is often constructed from a sum of squared errors or through the sample variance. This is a statistical hypothesis test where the sample distribution of test statistics is a chi-squared when the null hypothesis is true. It arises from the assumption of independent, normally distributed data.
Start Learning Data Science For Free
Introduction to Statistics in Google Sheets
Chi-square test
The chi-square test is a statistical test that can be used to determine what observed frequencies are significantly different from expected frequencies or not in one or more categories (Source). In the mathematical expression, it is the ratio of experimentally observed result/frequencies (O) and the theoretically expected results (E) based on certain hypotheses, or it is calculated by dividing the overall deviation from the observed and expected frequencies by the expected frequencies.

If there is no difference in observed and expected frequencies, then the chi-square value would be zero. If there is a difference, then the value of chi-square would be more than zero.
While comparing the calculated value with the table values, you have to calculate the degree of freedom. Then you will be able to compare and draw a conclusion.
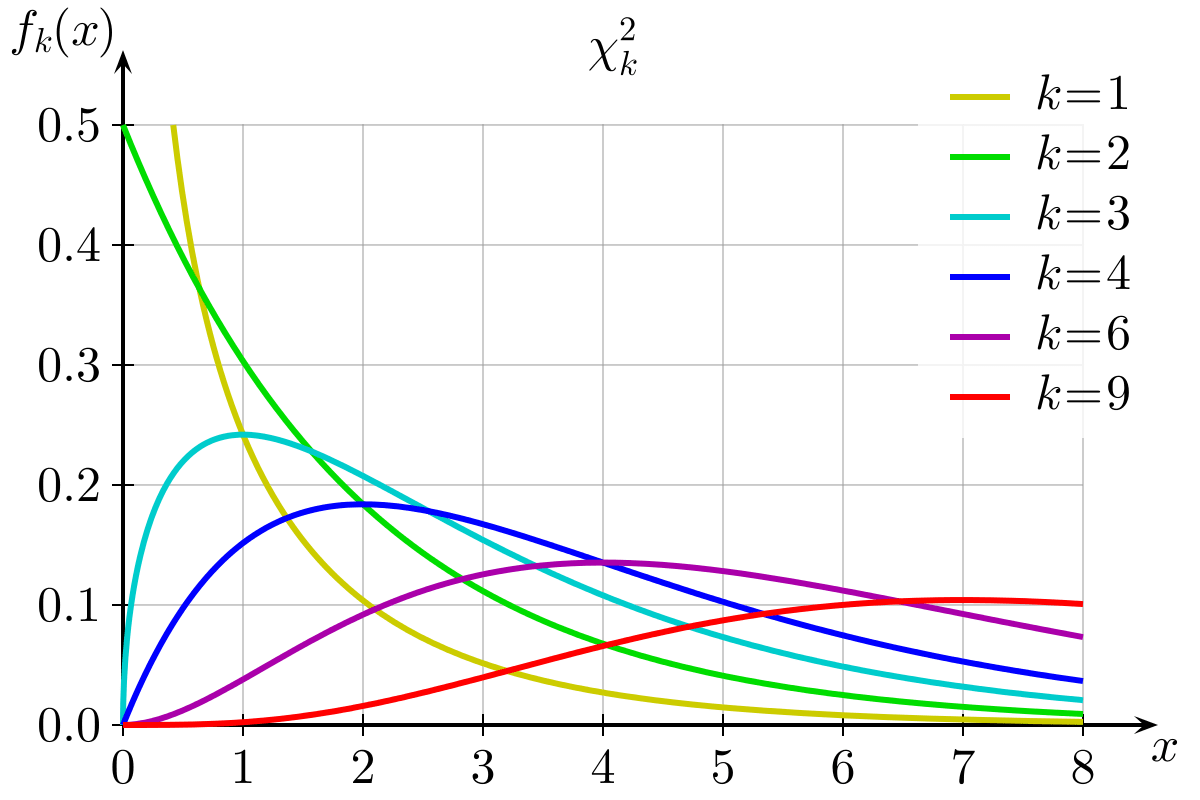
Chi-square probability distribution graph: Image Source:
There are three types of chi-square tests:
- Goodness of fit
- Test of independence
- Test of homogeneity
Terminology
-
Contingency table: This is a cross table or two-way table. You use to show the one variable in a row and another in a column with their frequency count. It is a type of frequency distribution table of the categorical variables.
-
Observed frequencies: Are counts made from experimental data. In other words, you observe the data happening and take measurements. (Source)
-
Expected frequencies: Are counts calculated using probability theory. Expected frequencies are calculated for each cell in the contingency table.

Where,
- Eij: Expected frequency for ith row and jth column
- Ti: Total in the ith row
- Tj: Total in the jth row
- N: Grand Total
Or you can think of this as (row total * column total) / grand total
- Null Hypothesis (H0): It states that no association exists between the two cross-tabulated variables in the population. Hence, the variables are statistically independent. For example, if you compare two methods A and B for its goodness or which one works better, and if the assumption is that both methods are equally good, then this assumption is known as the Null Hypothesis.
-
Alternate Hypothesis (HA): It proposes that the two variables are related to the population. If you assume that from two methods, method A is superior to method B or method B is superior to method A, then this assumption is known as Alternative Hypothesis.
-
Degree of Freedom: The number of independent variates that make up the statistic is known as the degree of freedom of that statistic.
Where,
- r=numbers of rows
- c=number of columns
This will be used in the test of independence and test of homogeneity, not in the goodness of fit.
- Chi-square test Statistics: A chi-squared statistic is a single number that tells you how much difference exists on your observed counts and the counts you would expect if there were no relationship at all in the population.
- Chi-Square p-value: Chi-square P-value will tell you if your test results are significant or not.
Types of Chi-square test
-
Goodness of fit: Chi-Square goodness of fit test is a non-parametric test that is used to find out how the observed value of a given phenomenon is significantly different from the expected value. In this test, you only have one variable from a single population (Source).
-
Null hypothesis (H0): In the Chi-Square goodness of fit test, the null hypothesis assumes that there is no significant difference between the observed and the expected value (Source).
-
Alternative hypothesis (Ha): In the Chi-Square goodness of fit test, the alternative hypothesis assumes that there is a significant difference between the observed and the expected value (Source).
e.g., Let’s take a straightforward example, you rolled a fair 6-sided die 120 times and got the observed frequencies.
-

Hence,
- H0 = Chances are equal to getting all numbers in the same frequency, or data is consistent with the expected one.
p1 = p2 = p3 = p4 = p5 = p6 = 1/6 -
Ha = At least one p is not equal to 1/6, or data is not consistent with the expected one.
- Criteria and Decision Rule: The rejection region is always right-tailed using χ2 distribution with (k-1) degree of freedom. (k =number of the categories) Reject H0 if χ2calulated > χ2tabulated DOF = k-1
-
Test of independence you use this to test two categorical variables are independent or not. e.g., gender vs. opinion independence.
H0: The row variable is independent of the column variable, or there is no significant relationship between variables Ha: The Relationship is significant.
-
Criteria and Decision Rule: Rejection region is always right tailed using χ2 distribution with (r-1)(c-1) degree of freedom. (r = number of the rows, c = number of the columns)
Reject H0 if χ2calulated > χ2tabulated
DOF = (r-1)(c-1)
- Test of homogeneity: Whenever you want to test whether those frequencies of different populations are distributed identically or not. In such cases, you perform the test of homogeneity. Let’s consider an example to grasp it more practically. In a survey, you asked about income as low, medium, or high. In this survey, both populations are diverse such as males and females. In such cases, you perform a chi-square test for homogeneity to determine whether male and female income differs significantly or not.
H0: Frequency count across the population is the same. Ha: Frequency count across the population is different.
-
Criteria and Decision Rule: Rejection region is always right tailed using χ2 distribution with (r-1)(c-1) degree of freedom. (r = number of the rows, c = number of the columns)
Reject H0 if χ2calulated > χ2tabulated
DOF = (r-1)(c-1)
Example of the Chi-square test
Suppose you wish to classify defects in the furniture produced by a manufacturing plant based on the type of defects and the production shift. A total of 390 furniture defects were recorded, and the defects were classified as one of four types A, B, C, and D. At the same time, each piece of defected furniture was identified according to the production shift.
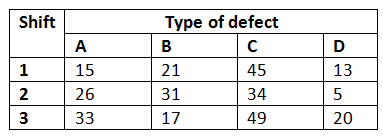
Source: Engineering Statistics book
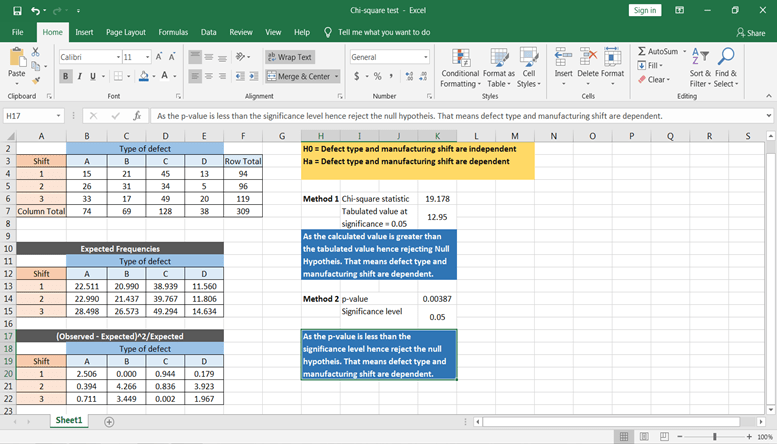
Solution: you need to look at whether the defect types are dependent on the production shift or not. So, let’s solve this using excel.
Solving the example using the Chi-square test in Spreadsheets
Let’s first put this data into the Spreadsheet
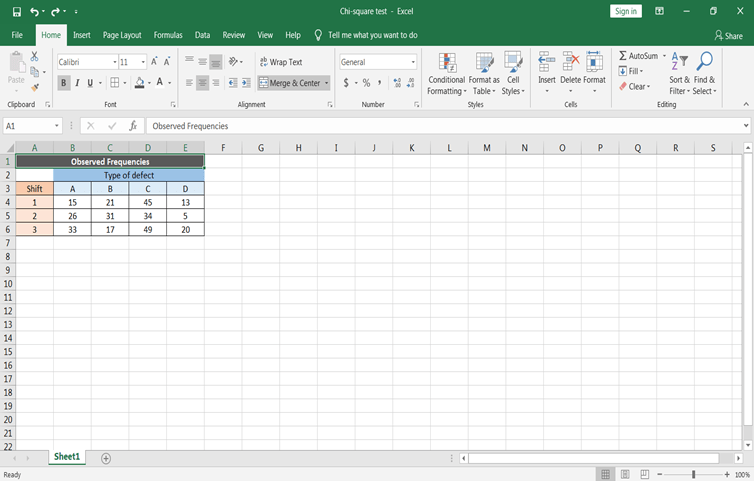
Defining the null hypothesis and the alternative hypothesis
To define the null and alternate hypothesis in the above section. The main objective is to check whether the furniture defects are independent of the production shift or not:
- H0 = Defect type and manufacturing shift are independent
- Ha = Defect type and manufacturing shift are dependent
Calculated expected frequencies
- Before calculating the expected frequencies. First, calculate the row-wise sum of items for each row and the column-wise sum of items for each column using the SUM() function, which is known as row total and column total, respectively. Also, calculate the total of row total and column total. Row and column total both will be the same.
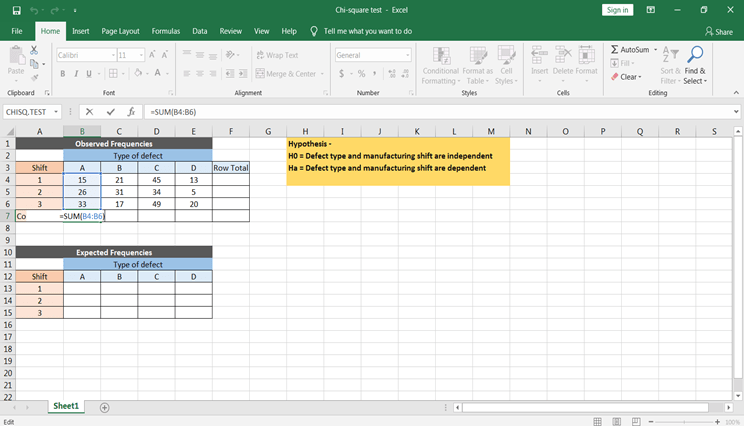
- As you know expected frequency = (row total * column total) / total
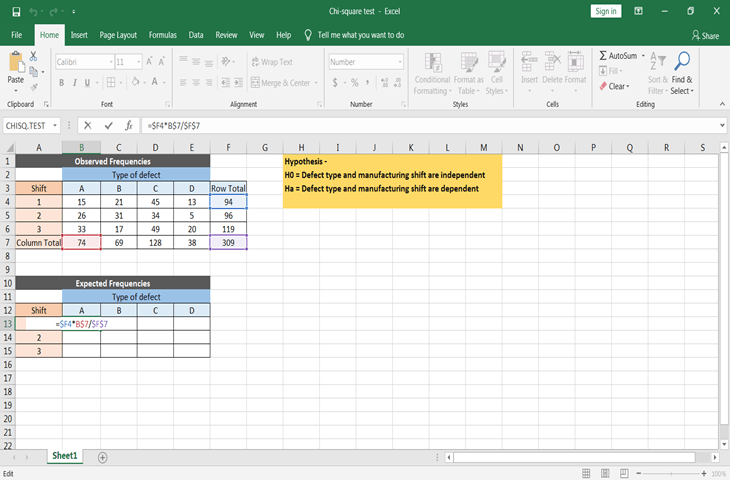
Don’t forget to make cells absolute while applying the formula, so that you can copy & paste the formula for all of the expected values.
Calculate Chi-statistic value
Now before you calculate Chi – statistic value or p-value, lets first assume the significance level. This means at what significance level you want to know the answer. Let’s assume significance level α = 0.05. Also, the degree of freedom would be = (r-1)(c-1) = (3-1)(4-1) = 6.
Now there are two ways to calculate chi-statistic value one by the formula χ^2= ∑(O-E)^2/E or use the excel function to get the chi-square statistic value.
Let’s first calculate using the formula. For this, you need to calculate ∑(O-E)^2/E using excel. This can be done by using the below step –
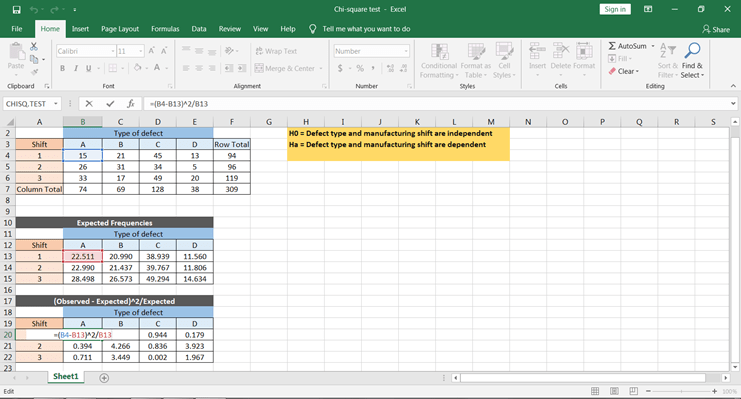
You can get all the values by copy and paste this formula to all the cells.
To get the χ^2 values to take the sum of all the values, this would give us the chi-square statistic calculated value.
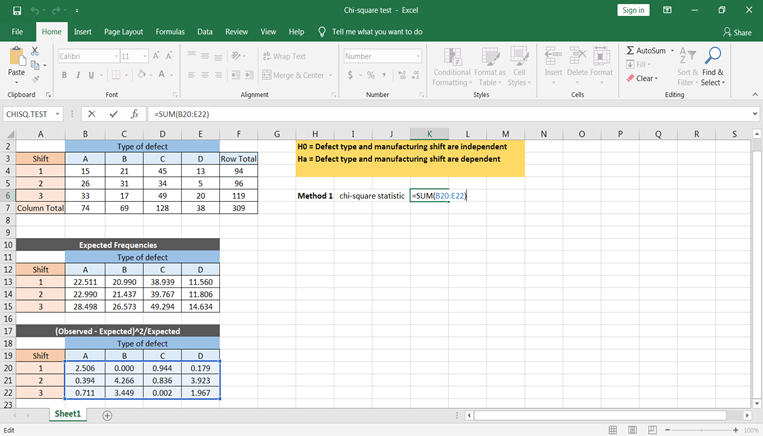
Based on the tabulated and calculated value, you can conclude that the defect types and shift times are dependent.

Now let’s calculate using excel function. CHISQ.TEST() function will give the p-value, which can directly be compared with the significance level to conclude the results.
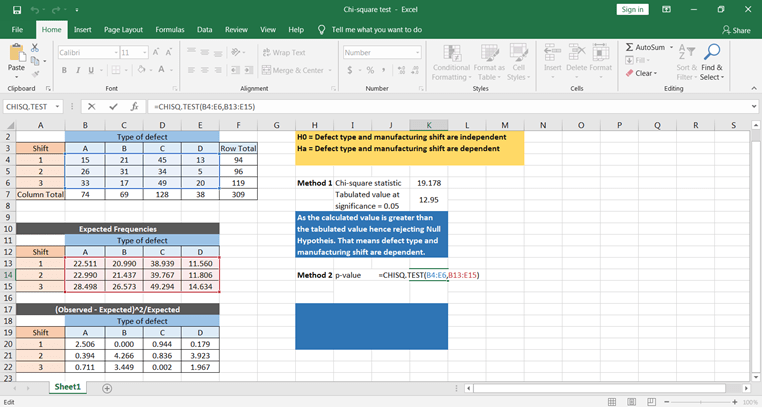
Based on the p-value, you can conclude that the defect is dependent on manufacturing shift time.
Pros and Cons
Pros:
- It is easier to compute.
- It can also be used with nominal data.
- It does not assume anything about the data distribution.
Cons:
- The number of observations should be more than 20.
- Data must be frequency data.
- It assumes random sampling. It means the sample should be selected randomly.
- It is sensitive to small frequencies, which leads to erroneous conclusions.
- It is also sensitive to sample size.
Conclusion
Congratulations, you have made it to the end of this tutorial!
In this tutorial, you have covered a lot of details of the Chi-square test. You have learned what Chi-square is, terminologies used in the Chi-square test, types of Chi-square tests, examples of Chi-square tests, and an example on how to solve a Chi-square test in spreadsheets. Also, you looked over its pros and cons.
Hopefully, you can now utilize the Chi-Square concepts to test the hypothesis. Thanks for reading this tutorial!
Check out our Getting Started with Spreadsheets tutorial.
If you are interested in learning more about statistics in spreadsheets, take DataCamp's Statistics in Spreadsheets course.
Advance Your Career with Excel
Gain the skills to maximize Excel—no experience required.