
Course
Prompt Engineering with the OpenAI API
4 hr
48.1K
GPT-5.2 is a strong model for generating workflows and multi-step pipelines that require reliability, structure, and fewer hallucinations. OpenAI has highlighted improvements in long-context work and even better performance on spreadsheet-style tasks.
In this tutorial, we’ll build a Streamlit app that behaves like a junior analyst:
The key here is that GPT-5.2 doesn’t directly “make slides.” It generates a strict plan that your code deterministically executes.
Also make sure to read our guides on OpenAI's newer models, GPT-5.5, GPT-5.4, GPT-5.3 Codex and GPT-5.3 Instant
GPT-5.2 is OpenAI’s newest GPT-5-series model with improvements for end-to-end tasks like creating spreadsheets, building presentations, writing and debugging code, understanding long contexts, and using tools.
Here are the GPT-5.2 properties that matter most for this project:
In this section, we’ll build a structured artifacts generator(Excel and PowerPoint) using the GPT 5.2 model wrapped in a Streamlit app. At a high level, the final Streamlit app does this:
It reads CSV and builds a canonical workbook
Then, it call GPT-5.2 via OpenAI or OpenRouter with Structured Outputs (response_format: json_schema)
Validates the returned plan against our schema
Renders charts into Excel and styles them to our brand palette
Finally, it generates a PowerPoint with embedded charts with citations
Let’s build it step by step.
Before generating Excel workbooks and PowerPoint decks with GPT-5.2, we need to set up a local environment. We’ll start by installing the core libraries and setting API keys as environment variables.
pip install streamlit pandas pydantic python-dotenv requests openpyxl python-pptxWe’ll use Streamlit to build the interactive web UI, Pandas to load and prep the CSV, Pydantic to validate GPT-5.2’s schema-locked JSON plan. We also use python-dotenv to securely load keys like OPENROUTER_API_KEY/OPENAI_API_KEY from a .env file. The requests library calls the OpenRouter/OpenAI-compatible endpoint, while openpyxl generates the Excel workbook and charts, and python-pptx creates the PowerPoint deck with native (editable) charts.
Next, we set our API key/s:
export OPENAI_API_KEY="your_key"
export OPENROUTER_API_KEY="your_key"
Note that GPT 5.2 can be accessed via multiple services, including OpenAI’s official API as well as services like OpenRouter and more.
It is recommended to use a .env file to locally store the API keys:
Within the .env file, save the following:
OPENROUTER_API_KEY="your_key"
OPENAI_API_KEY="your_key"
Then load these API keys using the load_dotenv library:
from dotenv import load_dotenv
load_dotenv()
At this point, our environment is now ready to authenticate with the OpenAI API.
Next, we define a schema-locked artifact plan that consists of a strict JSON blueprint that tells GPT-5.2 exactly which charts to create and how to structure the slides, so the model’s output can be decoded and validated using Structured Outputs via response_format: { type: "json_schema", strict: true } rather than free-form text.
import os
import io
import re
import json
import math
import tempfile
from dataclasses import dataclass
from pathlib import Path
from typing import Dict, List, Literal, Optional, Tuple
import requests
import pandas as pd
import numpy as np
import streamlit as st
import openpyxl
from dotenv import load_dotenv
from pydantic import BaseModel, Field, ValidationError
from openpyxl import Workbook, load_workbook
from openpyxl.styles import Font, Alignment, PatternFill
from openpyxl.utils import get_column_letter
from openpyxl.chart import LineChart, BarChart, Reference
from openpyxl.chart.series import SeriesLabel
from pptx import Presentation
from pptx.util import Inches, Pt
from pptx.chart.data import CategoryChartData
from pptx.enum.chart import XL_CHART_TYPE, XL_LEGEND_POSITION
ChartKind = Literal["line", "bar"]
def safe_float(x) -> float:
    try:
        if x is None:
            return 0.0
        if isinstance(x, (int, float)):
            return float(x)
        return float(str(x).replace(",", "").replace("$", ""))
    except Exception:
        return 0.0
def fmt_money(v: float) -> str:
    sign = "-" if v < 0 else ""
    v = abs(v)
    if v >= 1_000_000:
        return f"{sign}${v/1_000_000:.2f}M"
    if v >= 1_000:
        return f"{sign}${v/1_000:.1f}K"
    return f"{sign}${v:.0f}"
def fmt_pct(v: float) -> str:
    if v is None or (isinstance(v, float) and (math.isnan(v) or math.isinf(v))):
        return "n/a"
    return f"{v*100:.1f}%"
class ChartSeriesSpec(BaseModel):
    name: str
    metric: str
class ChartSpec(BaseModel):
    id: str
    kind: ChartKind
    title: str
    x_metric: str
    series: List[ChartSeriesSpec]
    anchor: str
class SlideBullet(BaseModel):
    text: str
    citations: List[str] = Field(min_length=1, max_length=4)
class SlideSpec(BaseModel):
    title: str
    chart_id: Optional[str] = None
    bullets: List[SlideBullet] = Field(min_length=2, max_length=4)
class ArtifactPlan(BaseModel):
    charts: List[ChartSpec] = Field(min_length=3, max_length=6)
    slides: List[SlideSpec] = Field(min_length=4, max_length=10)
The above code snippet defines the plan using Pydantic models, which do three important things:
Plan structure: ChartKind = Literal["line", "bar"] constrains chart types to a small enum, ChartSpec captures the full chart contract, and SlideSpec defines slide layout while optionally linking a slide to a chart via chart_id.
Automatic quality enforcement: The constraints like Field() ensure that we always get enough charts/slides, every slide has enough bullets, and every bullet includes citations.
Planning and rendering: GPT-5.2 only produces the blueprint, i.e., charts, slides, and citations, as structured JSON, while the rest of the code handles the execution, Excel formatting, chart rendering, and deck layout.
With this schema in place, GPT-5.2 becomes a planner that produces a validated JSON blueprint.
With the plan schema defined, the next move is to call GPT-5.2 in “schema mode”—so it returns a JSON blueprint you can validate and execute. Instead of hoping the model “behaves,” we tell the API to decode directly into your JSON Schema using response_format: { type: "json_schema", ... strict: true }, which is exactly what Structured Outputs are for.
def chat_json_schema(
    model: str,
    messages: list,
    json_schema: dict,
    api_key: str,
    temperature: float = 0.2,
    max_tokens: int = 6000,
    timeout_s: int = 120,
    api_provider: Optional[str] = None,
) -> dict:
    if api_provider is None:
        if "/" in model:
            api_provider = "openrouter"
        elif os.getenv("OPENAI_API_KEY") and api_key == os.getenv("OPENAI_API_KEY"):
            api_provider = "openai"
        elif os.getenv("OPENROUTER_API_KEY") and api_key == os.getenv("OPENROUTER_API_KEY"):
            api_provider = "openrouter"
        else:
            api_provider = "openrouter"
    if api_provider == "openai":
        url = "https://api.openai.com/v1/chat/completions"
        headers = {
            "Authorization": f"Bearer {api_key}",
            "Content-Type": "application/json",
        }
        if "/" in model:
            model = model.split("/", 1)[1]
    else:
        url = "https://openrouter.ai/api/v1/chat/completions"
        headers = {
            "Authorization": f"Bearer {api_key}",
            "Content-Type": "application/json",
        }
        if os.getenv("OPENROUTER_SITE_URL"):
            headers["HTTP-Referer"] = os.getenv("OPENROUTER_SITE_URL")
        if os.getenv("OPENROUTER_APP_NAME"):
            headers["X-Title"] = os.getenv("OPENROUTER_APP_NAME")
    payload = {
        "model": model,
        "messages": messages,
        "temperature": temperature,
        "max_tokens": max_tokens,
        "response_format": {
            "type": "json_schema",
            "json_schema": {
                "name": "artifact_plan",
                "strict": True,
                "schema": json_schema,
            },
        },
    }
    r = requests.post(url, headers=headers, data=json.dumps(payload), timeout=timeout_s)
    r.raise_for_status()
    data = r.json()
    if "error" in data:
        provider_name = "OpenAI" if api_provider == "openai" else "OpenRouter"
        raise RuntimeError(f"{provider_name} error: {data['error']}")
    finish_reason = data["choices"][0].get("finish_reason")
    if finish_reason == "length":
        raise RuntimeError("Model output truncated (max_tokens). Increase max_tokens or reduce schema size.")
    content = data["choices"][0]["message"]["content"]
    if isinstance(content, dict):
        return content
    try:
        return json.loads(content)
    except json.JSONDecodeError as e:
        preview = (content or "")[:800]
        raise RuntimeError(f"Failed to parse JSON. Preview:\n{preview}") from e
The chat_json_schema() function is the single gateway that turns prompts into a validated plan:
Provider routing (OpenRouter vs OpenAI): If the model name is namespaced (openai/gpt-5.2), you default to OpenRouter because that’s the format OpenRouter uses for model routing. If you explicitly set api_provider="openai", you send the same Chat Completions payload to OpenAI’s endpoint instead. Feel free to skip OpenRouter altogether.
Setting endpoints: For OpenAI, you call the https://api.openai.com/v1/chat/completions endpoint with standard Bearer auth. For OpenRouter, you call the https://openrouter.ai/api/v1/chat/completions endpoint and optionally include attribution headers like HTTP-Referer and X-Title, which OpenRouter documents as recommended metadata.
Schema decoding via response_format: The key payload block is response_format: { type: "json_schema", json_schema: { strict: true, schema: ... } }, which instructs the model to produce output that is restricted to our JSON Schema.
Next, we’ll validate the model’s JSON plan with Pydantic, and only if it passes bounds checks, will we proceed to render the Excel charts and generate the PowerPoint deck.
Before we render anything, we need a small layer that makes any uploaded CSV safe to analyze and consistent to reference. These helper functions do four jobs: load and clean the CSV, create a derived model table, compute a compact set of facts for the prompt, and make Excel output readable with autosized columns.
GPT 5.2 cannot reliably plan charts and slides if the input table is empty or has numeric fields stored as strings. This function standardizes the dataset so downstream steps do not have to guess.
def load_and_validate_csv(csv_path: str) -> pd.DataFrame:
    df = pd.read_csv(csv_path)
    if len(df) == 0:
        raise ValueError("CSV is empty")
    if len(df.columns) == 0:
        raise ValueError("CSV has no columns")
    date_cols = [c for c in df.columns if any(x in c.lower() for x in ['date', 'time', 'month', 'year', 'period', 'week'])]
    if date_cols:
        date_col = date_cols[0]
        df[date_col] = df[date_col].astype(str)
    for col in df.columns:
        if col not in date_cols:
            try:
                df[col] = pd.to_numeric(df[col])
                if df[col].dtype in ['float64', 'int64']:
                    df[col] = df[col].fillna(0)
            except (ValueError, TypeError):
                pass
    return df
The above function:
pd.read_csv.pd.to_numeric, and fills missing numeric values with zero to avoid NaN cascades later. At the end of this step, you have a DataFrame that is non-empty and has numeric columns.
Raw CSVs are messy and inconsistent across domains. The model sheet acts as a normalization layer where we add derived metrics that are useful for charting, without requiring the user to compute them manually.
def compute_model_df(raw_df: pd.DataFrame) -> pd.DataFrame:
    df = raw_df.copy()
    numeric_cols = df.select_dtypes(include=[np.number]).columns.tolist()
    if "new_mrr" in df.columns and "churned_mrr" in df.columns:
        df["net_new_mrr"] = df["new_mrr"] - df["churned_mrr"]
    revenue_cols = [c for c in df.columns if any(x in c.lower() for x in ['revenue', 'mrr', 'income', 'sales'])]
    cost_cols = [c for c in df.columns if any(x in c.lower() for x in ['cost', 'cogs', 'expense'])]
    if revenue_cols and cost_cols:
        revenue = df[revenue_cols[0]]
        cost = df[cost_cols[0]]
        df["gross_margin"] = ((revenue - cost) / revenue.replace(0, pd.NA)).fillna(0)
    for col in numeric_cols[:5]:
        if col not in df.columns:
            continue
        df[f"{col}_change"] = df[col].pct_change().fillna(0)
    return df
The compute_model_df() function does two broadly useful things:
It looks for a primary output value column and a secondary input column and computes a simple ratio to capture how much of the primary signal remains after accounting for the secondary signal.
For a handful of numeric columns, it computes pct_change(), which returns the fractional change from the previous row by default, which becomes an easy baseline for capturing movement in any time-series metric.
Even with Structured Outputs, we still want to give GPT-5.2 a compact summary of what changed over the period. These facts also work as the prompt that the model can reuse in slide bullets.
def compute_facts(model_df: pd.DataFrame) -> Dict[str, str]:
    def delta(a: float, b: float) -> float:
        return 0.0 if a == 0 else (b - a) / a
    if len(model_df) == 0:
        return {"error": "No data"}
    first = model_df.iloc[0]
    last = model_df.iloc[-1]
    date_cols = [c for c in model_df.columns if any(x in c.lower() for x in ['date', 'time', 'month', 'year', 'period', 'week'])]
    period_col = date_cols[0] if date_cols else model_df.columns[0]
    facts = {
        "period": f"{first[period_col]} → {last[period_col]}",
        "row_count": len(model_df),
        "column_count": len(model_df.columns),
    }
    numeric_cols = model_df.select_dtypes(include=[np.number]).columns.tolist()
    for i, col in enumerate(numeric_cols[:5]):
        if col in first.index and col in last.index:
            start_val = safe_float(first[col])
            end_val = safe_float(last[col])
            avg_val = safe_float(model_df[col].mean())
            facts[f"{col}_start"] = fmt_money(start_val) if start_val >= 100 else f"{start_val:.2f}"
            facts[f"{col}_end"] = fmt_money(end_val) if end_val >= 100 else f"{end_val:.2f}"
            facts[f"{col}_change_pct"] = fmt_pct(delta(start_val, end_val))
            facts[f"{col}_avg"] = fmt_money(avg_val) if avg_val >= 100 else f"{avg_val:.2f}"
    return facts
We first pick the first and last row to define the period window. Then we select a column (date, month, week, period) for human-readable reporting.
For a small set of numeric columns, we compute a snapshot of start, end, average, and overall percent change from start to end. This produces a lightweight dictionary of signals that helps the model write slide bullets.
Default Excel column widths make generated workbooks look rough. Autosizing is a simple polish step that immediately improves usability.
def autosize_columns(ws, max_width: int = 45):
    for col in ws.columns:
        max_len = 0
        col_letter = get_column_letter(col[0].column)
        for cell in col:
            if cell.value is None:
                continue
            max_len = max(max_len, len(str(cell.value)))
        ws.column_dimensions[col_letter].width = min(max_len + 2, max_width)
The autosize_columns() function scans each column, finds the maximum string length, and sets ws.column_dimensions[col_letter].width. Then, the OpenPyXL library exposes column_dimensions and its width property for controlling column display size in Excel.
Next, we plug the cleaned model table and facts into the GPT-5.2 planning prompt, validate the returned plan, and then render charts and slides.
Using the cleaned model table and the lightweight summary facts from the previous step, we now generate a deterministic Excel workbook with openpyxl.
def build_workbook_base(raw_df: pd.DataFrame, model_df: pd.DataFrame, out_xlsx: str) -> Tuple[str, int]:
    wb = Workbook()
    wb.remove(wb.active)
    header_fill = PatternFill("solid", fgColor="F2F2F2")
    header_font = Font(bold=True)
    ws_raw = wb.create_sheet("Raw")
    for j, col in enumerate(raw_df.columns, start=1):
        c = ws_raw.cell(row=1, column=j, value=col)
        c.font = header_font
        c.fill = header_fill
        c.alignment = Alignment(horizontal="center", vertical="center")
    for i, row in enumerate(raw_df.itertuples(index=False), start=2):
        for j, val in enumerate(row, start=1):
            ws_raw.cell(row=i, column=j, value=val)
    ws_raw.freeze_panes = "A2"
    autosize_columns(ws_raw)
    row_end = 1 + len(raw_df)
    ws_model = wb.create_sheet("Model")
    for j, col in enumerate(model_df.columns, start=1):
        c = ws_model.cell(row=1, column=j, value=col)
        c.font = header_font
        c.fill = header_fill
        c.alignment = Alignment(horizontal="center", vertical="center")
    for i, row in enumerate(model_df.itertuples(index=False), start=2):
        for j, val in enumerate(row, start=1):
            ws_model.cell(row=i, column=j, value=val)
    ws_model.freeze_panes = "A2"
    autosize_columns(ws_model)
    col_index = {name: idx + 1 for idx, name in enumerate(model_df.columns)}
    money_keywords = ['mrr', 'revenue', 'income', 'sales', 'cost', 'expense', 'cash', 'balance', 'burn', 'price', 'amount', 'fee']
    pct_keywords = ['margin', 'rate', 'ratio', 'pct', 'percent', 'change', 'growth']
    for col_name, col_idx in col_index.items():
        col_lower = col_name.lower()
        is_money = any(kw in col_lower for kw in money_keywords)
        is_pct = any(kw in col_lower for kw in pct_keywords) or 'margin' in col_lower
        is_large_number = False
        if col_name in model_df.columns:
            sample_vals = model_df[col_name].dropna()
            if len(sample_vals) > 0 and pd.api.types.is_numeric_dtype(sample_vals):
                max_val = abs(sample_vals.max())
                is_large_number = max_val > 1000
        for r in range(2, row_end + 1):
            if is_money or is_large_number:
                ws_model.cell(row=r, column=col_idx).number_format = "$#,##0"
            elif is_pct:
                ws_model.cell(row=r, column=col_idx).number_format = "0.0%"
            elif pd.api.types.is_numeric_dtype(model_df[col_name]):
                ws_model.cell(row=r, column=col_idx).number_format = "0.0"
    ws_charts = wb.create_sheet("Charts")
    ws_charts["A1"] = "Charts"
    ws_charts["A1"].font = Font(bold=True)
    wb.save(out_xlsx)
    return out_xlsx, row_end
Here’s what this workbook builder is doing:
Create the workbook skeleton: The Workbook() instantiates a new workbook object, then wb.remove(wb.active) drops the default sheet so we fully control the sheet order. New worksheets are added explicitly with wb.create_sheet("Raw"), wb.create_sheet("Model"), and wb.create_sheet("Charts").
Write the Raw sheet: We write a header row using Font, PatternFill, and Alignment, then append every row from raw_df. The .autosize_columns(ws_raw) function helps with readability without manual resizing.
Compute bounds: We use row_end = 1 + len(raw_df), which gives us a stable last row so that we can safely generate ranges like A2:A{row_end} for chart categories and citations.
Apply number-format heuristics: Next, we set the cell.number_format based on column-name keywords and dtype so Excel displays values as currency, percentages, or plain numbers.
Create a Charts sheet: The wb.create_sheet("Charts") gives us a stable canvas for chart anchors. This matches the openpyxl chart workflow where we create a LineChart or BarChart, bind ranges via Reference, set categories with set_categories, and then place it with ws.add_chart().
After this step, you have a consistent Excel file that the next stage can safely reference by exact cell ranges.
Step 6: Render charts
Now that the workbook structure is fixed, we can render the charts into the Charts sheet and apply a consistent brand look. I applied DataCamp’s color palette with:
def add_charts_to_workbook(xlsx_path: str, charts: List[ChartSpec], metric_to_range: Dict[str, str]):
    wb = load_workbook(xlsx_path)
    ws_model = wb["Model"]
    ws_charts = wb["Charts"]
    header_map = {ws_model.cell(1, c).value: c for c in range(1, ws_model.max_column + 1)}
    def ref_from_metric(metric: str, row_start: int, row_end: int) -> Reference:
        if metric not in header_map:
            raise ValueError(f"Unknown metric in Model sheet: {metric}")
        col = header_map[metric]
        return Reference(ws_model, min_col=col, min_row=row_start, max_col=col, max_row=row_end)
    for ch in charts:
        chart = LineChart() if ch.kind == "line" else BarChart()
        chart.title = ch.title
        x_metric = ch.x_metric
        if x_metric not in header_map:
            date_keywords = ['date', 'time', 'month', 'year', 'period', 'week']
            date_cols = [col for col in header_map.keys() if col and any(kw in str(col).lower() for kw in date_keywords)]
            if date_cols:
                x_metric = date_cols[0]
            else:
                x_metric = list(header_map.keys())[0] if header_map else "month"
        x_ref = ref_from_metric(x_metric, 2, ws_model.max_row)
        chart.set_categories(x_ref)
        chart_colors = ["01EF63", "203147"]
        for i, s in enumerate(ch.series):
            y_ref = ref_from_metric(s.metric, 2, ws_model.max_row)
            chart.add_data(y_ref, titles_from_data=False)
            chart.series[-1].title = SeriesLabel(v=s.name)
            series = chart.series[-1]
            color_hex = chart_colors[i % len(chart_colors)]
            try:
                if ch.kind == "line":
                    series.graphicalProperties.line.solidFill = color_hex
                    series.graphicalProperties.line.width = 30000
                else:
                    series.graphicalProperties.solidFill = color_hex
            except AttributeError:
                pass
        anchor = ch.anchor.strip()
        if "!" in anchor:
            anchor = anchor.split("!")[-1]
        if anchor and anchor.isalpha():
            anchor = f"{anchor}2"
        if not re.match(r'^[A-Z]+[0-9]+
The add_charts_to_workbook() function is the chart-rendering engine that turns our schema plan into branded Excel visuals.
Load the workbook: We start by opening the generated Excel file with load_workbook(xlsx_path). Next, we build a header_map from the first row, mapping each column name to its Excel column index.
Build cell-range references: The Reference() function defines the exact range to plot, and chart.set_categories(x_ref) wires up the X-axis categories. The standard pattern is to create reference objects, add data, and then set categories.
Instantiate the chart type: For each chart spec, we create either a LineChart() or a BarChart(), and set the chart.title.
Add the brand palette: For every series in the spec, we bind the Y-range with chart.add_data(), then set the display label using SeriesLabel().
Finally, the ws_charts.add_chart() function places each chart at a specific top-left cell.
This step is where the plan becomes a real slide deck. We create a PowerPoint, lay out titles and bullets, embed charts built from the same table we used for Excel, and add a footer that preserves the plan’s cell-range citations.
def build_pptx(out_pptx: str, model_df: pd.DataFrame, plan: ArtifactPlan):
    prs = Presentation()
    blank = prs.slide_layouts[6]
    chart_by_id = {c.id: c for c in plan.charts}
    def add_title(slide, title: str):
        box = slide.shapes.add_textbox(Inches(0.5), Inches(0.2), Inches(9.0), Inches(0.6))
        tf = box.text_frame
        tf.clear()
        p = tf.paragraphs[0]
        p.text = title
        p.font.size = Pt(32)
        p.font.bold = True
    def add_bullets(slide, bullets: List[SlideBullet], left, top, width, height):
        box = slide.shapes.add_textbox(left, top, width, height)
        tf = box.text_frame
        tf.word_wrap = True
        tf.clear()
        for i, b in enumerate(bullets):
            p = tf.paragraphs[0] if i == 0 else tf.add_paragraph()
            p.text = b.text
            p.font.size = Pt(18)
            p.level = 0
            p.space_before = Pt(4)
            p.space_after = Pt(8)
    def add_sources_footer(slide, bullets: List[SlideBullet]):
        sources = []
        seen = set()
        for b in bullets:
            for c in b.citations:
                if c not in seen:
                    seen.add(c)
                    sources.append(c)
        if not sources:
            return
        text = "Sources: " + "; ".join(sources)
        box = slide.shapes.add_textbox(Inches(0.5), Inches(6.8), Inches(9.0), Inches(0.4))
        tf = box.text_frame
        tf.clear()
        p = tf.paragraphs[0]
        p.text = text
        p.font.size = Pt(9)
        p.font.italic = True
    def add_chart(slide, chart_spec: ChartSpec, left, top, width, height):
        date_cols = [c for c in model_df.columns if any(x in c.lower() for x in ['date', 'time', 'month', 'year', 'period', 'week'])]
        x_col = date_cols[0] if date_cols else model_df.columns[0]
        categories = model_df[x_col].astype(str).tolist()
        chart_data = CategoryChartData()
        chart_data.categories = categories
        chart_colors = ["01EF63", "203147"]
        for i, s in enumerate(chart_spec.series):
            values = model_df[s.metric].apply(safe_float).tolist()
            chart_data.add_series(s.name, values)
        chart_type = XL_CHART_TYPE.LINE if chart_spec.kind == "line" else XL_CHART_TYPE.COLUMN_CLUSTERED
        graphic_frame = slide.shapes.add_chart(chart_type, left, top, width, height, chart_data)
        chart = graphic_frame.chart
        chart.has_title = True
        chart.chart_title.text_frame.text = chart_spec.title
        chart.has_legend = True
        chart.legend.position = XL_LEGEND_POSITION.BOTTOM
        chart.legend.include_in_layout = False
        from pptx.dml.color import RGBColor
        for i, series in enumerate(chart.series):
            color_hex = chart_colors[i % len(chart_colors)]
            color_rgb = RGBColor(
                int(color_hex[0:2], 16),
                int(color_hex[2:4], 16),
                int(color_hex[4:6], 16)
            )
            fill = series.format.fill
            fill.solid()
            fill.fore_color.rgb = color_rgb
            if chart_spec.kind == "line":
                line = series.format.line
                line.color.rgb = color_rgb
                line.width = Pt(3)
    for s in plan.slides:
        slide = prs.slides.add_slide(blank)
        add_title(slide, s.title)
        has_chart = bool(s.chart_id and s.chart_id in chart_by_id)
        if has_chart:
            add_bullets(
                slide,
                s.bullets,
                left=Inches(0.5),
                top=Inches(1.0),
                width=Inches(4.5),
                height=Inches(5.5),
            )
            add_chart(
                slide,
                chart_by_id[s.chart_id],
                left=Inches(5.2),
                top=Inches(1.0),
                width=Inches(4.5),
                height=Inches(5.5),
            )
        else:
            add_bullets(
                slide,
                s.bullets,
                left=Inches(0.5),
                top=Inches(1.0),
                width=Inches(9.0),
                height=Inches(5.5),
            )
        add_sources_footer(slide, s.bullets)
    prs.save(out_pptx)
def build_allowed_ranges(model_df: pd.DataFrame, row_end: int) -> Dict[str, str]:
    ranges = {}
    for i, col in enumerate(model_df.columns, start=1):
        col_letter = get_column_letter(i)
        ranges[col] = f"Model!{col_letter}2:{col_letter}{row_end}"
    return ranges
def validate_plan(plan: ArtifactPlan, allowed_ranges: Dict[str, str]) -> None:
    allowed_set = set(allowed_ranges.values())
    chart_ids = {c.id for c in plan.charts}
    if len(chart_ids) != len(plan.charts):
        raise ValueError("Duplicate chart ids in plan.")
    for s in plan.slides:
        if s.chart_id and s.chart_id not in chart_ids:
            raise ValueError(f"Slide references unknown chart_id: {s.chart_id}")
    for s in plan.slides:
        for b in s.bullets:
            for c in b.citations:
                if c not in allowed_set:
                    raise ValueError(f"Citation not in allowed set: {c}")
    allowed_metrics = set(allowed_ranges.keys())
    for c in plan.charts:
        if c.x_metric not in allowed_metrics:
            pass
        for s in c.series:
            if s.metric not in allowed_metrics:
                raise ValueError(f"Unknown series metric: {s.metric}")
Let’s understand the above code step by step:
Create deck and index charts: prs = Presentation() starts a new PPTX, while blank = prs.slide_layouts[6] gives us a blank canvas for precise placement.
Titles and bullets: The add_title() function writes into a textbox text_frame, and add_bullets() adds one paragraph per bullet while controlling font size and spacing via paragraph formatting.
Citations footer: The add_sources_footer() function deduplicates citations across bullets and renders a compact Sources: line at the bottom so traceability stays intact without cluttering the slide.
Embed charts: add_chart() builds a CategoryChartData() object using a time-like X column and the planned series values, then inserts it via slide.shapes.add_chart(), which returns a GraphicFrame.
Brand styling: Finally, we convert hex to RGBColor and apply it per series.
Layout rules and guardrails: If a slide has a valid chart_id, then we use a two-column layout, otherwise we use full-width bullets. The build_allowed_ranges() function creates the allow-list of citable ranges, and validate_plan() enforces unique chart IDs, valid references, allowed citations, and valid metrics so the model can’t invent fields.
At this point, we have clean tabular data, which we’ll turn into a schema build plan (charts, slides, and citations) that the renderer can execute.
def generate_plan_with_llm(
    api_key: str,
    model: str,
    goal: str,
    allowed_ranges: Dict[str, str],
    facts: Dict[str, str],
    num_slides: int = 6,
    num_charts: int = 4,
) -> ArtifactPlan:
    plan_schema = {
        "type": "object",
        "properties": {
            "charts": {
                "type": "array",
                "minItems": 3,
                "maxItems": 6,
                "items": {
                    "type": "object",
                    "properties": {
                        "id": {"type": "string"},
                        "kind": {"type": "string", "enum": ["line", "bar"]},
                        "title": {"type": "string"},
                        "x_metric": {"type": "string"},
                        "series": {
                            "type": "array",
                            "minItems": 1,
                            "maxItems": 3,
                            "items": {
                                "type": "object",
                                "properties": {
                                    "name": {"type": "string"},
                                    "metric": {"type": "string"},
                                },
                                "required": ["name", "metric"],
                                "additionalProperties": False,
                            },
                        },
                        "anchor": {"type": "string"},
                    },
                    "required": ["id", "kind", "title", "x_metric", "series", "anchor"],
                    "additionalProperties": False,
                },
            },
            "slides": {
                "type": "array",
                "minItems": 4,
                "maxItems": 10,
                "items": {
                    "type": "object",
                    "properties": {
                        "title": {"type": "string"},
                        "chart_id": {"type": ["string", "null"]},
                        "bullets": {
                            "type": "array",
                            "minItems": 2,
                            "maxItems": 4,
                            "items": {
                                "type": "object",
                                "properties": {
                                    "text": {"type": "string"},
                                    "citations": {
                                        "type": "array",
                                        "minItems": 1,
                                        "maxItems": 4,
                                        "items": {"type": "string"},
                                    },
                                },
                                "required": ["text", "citations"],
                                "additionalProperties": False,
                            },
                        },
                    },
                    "required": ["title", "chart_id", "bullets"],
                    "additionalProperties": False,
                },
            },
        },
        "required": ["charts", "slides"],
        "additionalProperties": False,
    }
    system = (
        "You produce investor-grade slides with traceability.\n"
        "Output MUST match the JSON schema exactly.\n"
        "Rules:\n"
        "1) Use ONLY the allowed citation ranges (exact strings).\n"
        "2) No generic filler. Every bullet must contain at least ONE number (e.g., $X, X%, X mo).\n"
        "3) Keep bullets short: <= 12 words.\n"
        "4) Prefer trends (start→end) or averages; avoid speculation.\n"
        "5) Provide exactly the requested number of charts and slides.\n"
        "6) Use chart_id to attach the correct chart to each slide.\n"
        "7) Chart anchors: Use cell references ONLY (e.g., 'A2', 'A20', 'A38'). Do NOT include sheet name like 'CHARTS!A'.\n"
    )
    user = (
        f"Goal: {goal}\n"
        f"Requested: {num_charts} charts and {num_slides} slides.\n\n"
        f"Facts (use these; do not invent):\n{json.dumps(facts, indent=2)}\n\n"
        f"Allowed citation ranges (use exact values only):\n{json.dumps(list(allowed_ranges.values()), indent=2)}\n\n"
        "Metric keys available for charts:\n"
        f"{json.dumps(list(allowed_ranges.keys()), indent=2)}\n\n"
        "Chart requirements:\n"
        "- x_metric: Use a date/time column (e.g., 'month', 'date', 'period', 'week') for the X-axis.\n"
        "  If no date column exists, use the first column from the available metrics.\n"
        "- Create meaningful charts based on available metrics in the data.\n"
        "- Focus on trends, comparisons, and key business metrics.\n"
        "- Chart colors: Use these specific shades for all chart series:\n"
        "  * Primary color: #01ef63 (bright green)\n"
        "  * Secondary color: #203147 (dark blue/navy)\n"
        "  * Alternate between these two colors for multiple series in the same chart.\n"
        "Slide requirements:\n"
        "- Create slides that tell a story with the available data.\n"
        "- Suggested structure: Overview, Key Metrics, Trends, Analysis, Summary, Next Steps.\n"
        "- Adapt slide titles and content to match the data domain (e.g., sales, marketing, operations, finance).\n"
    )
    messages = [{"role": "system", "content": system}, {"role": "user", "content": user}]
    plan_json = chat_json_schema(
        model=model,
        messages=messages,
        json_schema=plan_schema,
        api_key=api_key,
        temperature=0.2,
        max_tokens=6000,
    )
    try:
        plan = ArtifactPlan.model_validate(plan_json)
        validate_plan(plan, allowed_ranges)
        if len(plan.slides) != num_slides:
            raise ValueError(f"Expected {num_slides} slides, got {len(plan.slides)}")
        if len(plan.charts) != num_charts:
            raise ValueError(f"Expected {num_charts} charts, got {len(plan.charts)}")
        return plan
    except (ValidationError, ValueError) as e:
        repair = messages + [
            {"role": "assistant", "content": json.dumps(plan_json)},
            {"role": "user", "content": f"Fix JSON to satisfy schema + rules. Error:\n{str(e)}"},
        ]
        plan_json = chat_json_schema(
            model=model,
            messages=repair,
            json_schema=plan_schema,
            api_key=api_key,
            temperature=0.0,
            max_tokens=6000,
        )
        plan = ArtifactPlan.model_validate(plan_json)
        validate_plan(plan, allowed_ranges)
        if len(plan.slides) != num_slides or len(plan.charts) != num_charts:
            raise RuntimeError("Plan repaired but counts still wrong. Tighten prompt or increase max_tokens.")
        return plan
The generate_plan_with_llm() function is the brain of this demo. Here is how we add it to the pipeline:
Explicit JSON Schema: The plan_schema defines the only response shape the model is allowed to produce, charts[] and slides[], with required fields and enums.
System prompt guardrails: We hard-code non-negotiables to ensure the plan remains renderable and auditable. We also restrict chart placement to plain cell, so chart layout remains deterministic instead of model-improvised. This kind of multi-step control is precisely what GPT-5.2 is designed to handle.
User message: The user message provides the goal, requested counts, computed facts, and the allowed metric keys. Since the model never sees anything else, it has far fewer ways to invent columns, ranges, or unsupported claims.
Schema-adherent decoding: We call chat_json_schema() with response_format set to json_schema and strict: true, which enforces schema adherence during decoding.
Validate in two layers: First, ArtifactPlan.model_validate(plan_json) function confirms that the response matches our Pydantic models. Then, validate_plan() enforces domain constraints.
Finally, we wire together CSV loading, Excel generation, LLM planning, chart rendering, and final PPTX export, then return the output paths.
@dataclass
class RunOutputs:
    xlsx_path: str
    pptx_path: str
    plan_path: str
    logs: str
def run_pipeline(csv_path: str, goal: str, outdir: str, model: str, num_slides: int, num_charts: int) -> RunOutputs:
    load_dotenv()
    openai_key = os.getenv("OPENAI_API_KEY")
    openrouter_key = os.getenv("OPENROUTER_API_KEY")
    if "/" in model or openrouter_key:
        api_key = openrouter_key
        if not api_key:
            raise RuntimeError("Missing OPENROUTER_API_KEY (required for OpenRouter models)")
    elif openai_key:
        api_key = openai_key
    else:
        raise RuntimeError("Missing API key. Set either OPENAI_API_KEY or OPENROUTER_API_KEY")
    out = Path(outdir)
    out.mkdir(parents=True, exist_ok=True)
    xlsx_path = str(out / "investor_update.xlsx")
    pptx_path = str(out / "investor_update.pptx")
    plan_path = str(out / "plan.json")
    raw_df = load_and_validate_csv(csv_path)
    model_df = compute_model_df(raw_df)
    xlsx_path, row_end = build_workbook_base(raw_df, model_df, xlsx_path)
    allowed_ranges = build_allowed_ranges(model_df, row_end)
    facts = compute_facts(model_df)
    plan = generate_plan_with_llm(
        api_key=api_key,
        model=model,
        goal=goal,
        allowed_ranges=allowed_ranges,
        facts=facts,
        num_slides=num_slides,
        num_charts=num_charts,
    )
    with open(plan_path, "w", encoding="utf-8") as f:
        json.dump(plan.model_dump(), f, indent=2)
    add_charts_to_workbook(xlsx_path, plan.charts, allowed_ranges)
    build_pptx(pptx_path, model_df, plan)
    logs = (
        f"CSV rows: {len(raw_df)}\n"
        f"Excel: {xlsx_path}\n"
        f"PPTX:  {pptx_path}\n"
        f"Plan:  {plan_path}\n"
        f"Facts used: {facts}\n"
    )
    return RunOutputs(xlsx_path=xlsx_path, pptx_path=pptx_path, plan_path=plan_path, logs=logs)
Let’s join all the components of our pipeline step by step:
@dataclass creates a lightweight container for xlsx_path, pptx_path, plan_path, and logs, so that the Streamlit UI can treat the pipeline result as a single structured value instead of juggling tuples or globals.load_dotenv() method loads our .env file into environment variables so OPENAI_API_KEY and OPENROUTER_API_KEY can be read via os.getenv(). Then we pick the provider key using a simple rule i.e., if OPENROUTER_API_KEY exists, use OpenRouter; otherwise, fall back to OpenAI if available.build_workbook_base(). The generate_plan_with_llm() function then returns an ArtifactPlan which gets saved as JSON using json.dump() so it’s easy to inspect and debug.build_pptx() builds the slide deck from the plan and the table.After this step, our Streamlit app can call run_pipeline(), show the logs, and expose three deterministic outputs for download, including the Excel workbook, the PPTX deck, and the JSON plan.
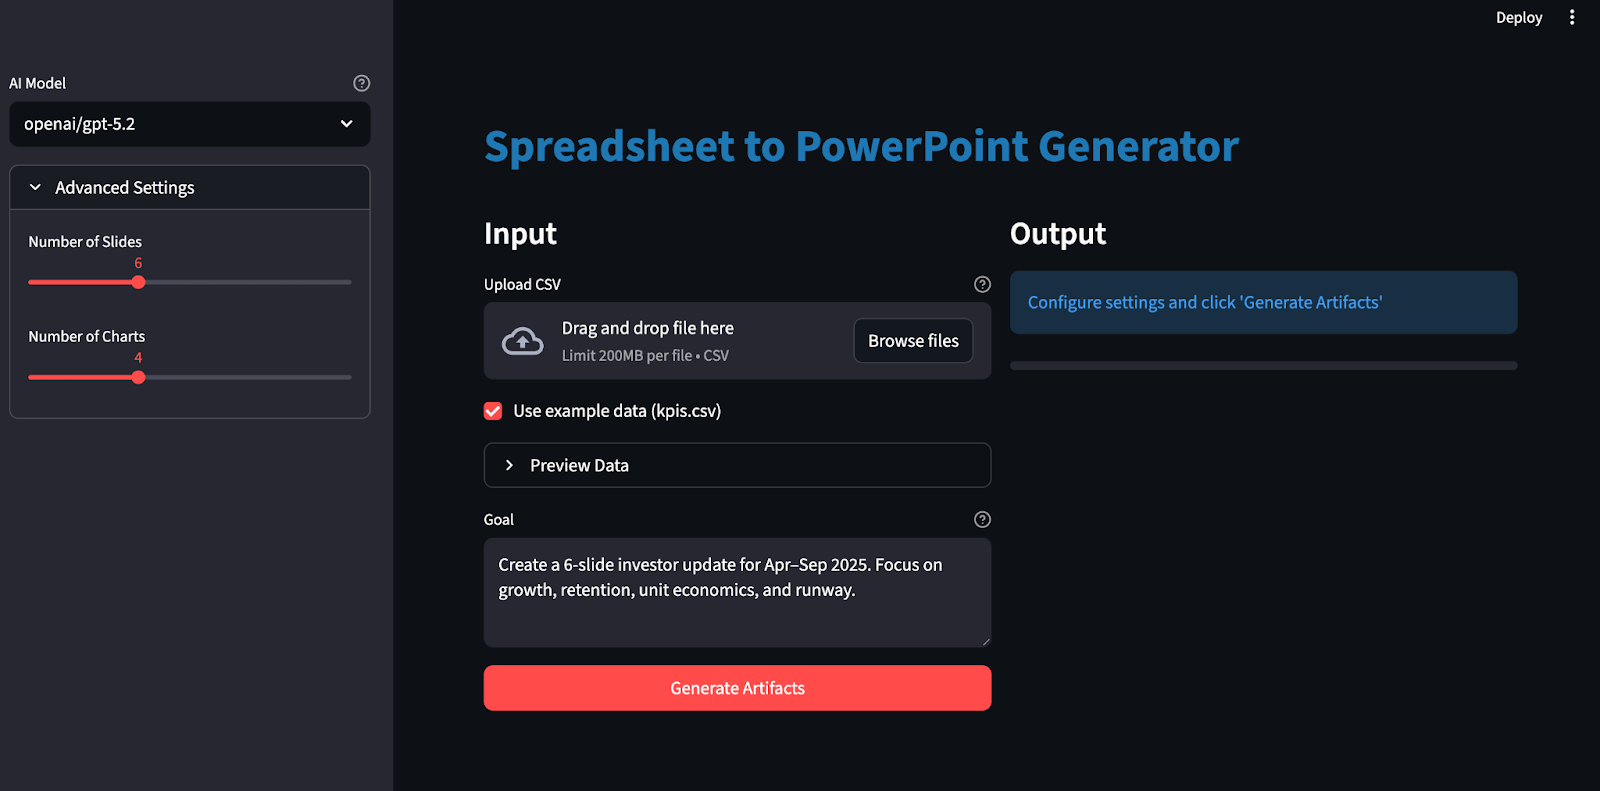
Now that the core pipeline is ready, the final step is wrapping it in a Streamlit app so anyone can upload a file, set a goal, pick a model, and download the generated artifacts.
load_dotenv()
st.set_page_config(
    page_title="GPT-5.2 PPT and Excel Generator",
    page_icon="",
    layout="wide",
    initial_sidebar_state="expanded"
)
st.markdown("""
<style>
    .main-header {
        font-size: 2.5rem;
        font-weight: 700;
        color: #1f77b4;
        margin-bottom: 1rem;
    }
    .sub-header {
        font-size: 1.2rem;
        color: #666;
        margin-bottom: 2rem;
    }
    .success-box {
        padding: 1rem;
        background-color: #d4edda;
        border-left: 4px solid #28a745;
        margin: 1rem 0;
    }
    .error-box {
        padding: 1rem;
        background-color: #f8d7da;
        border-left: 4px solid #dc3545;
        margin: 1rem 0;
    }
    .info-box {
        padding: 1rem;
        background-color: #d1ecf1;
        border-left: 4px solid #17a2b8;
        margin: 1rem 0;
    }
    .slide-preview {
        border: 2px solid #ddd;
        border-radius: 8px;
        padding: 10px;
        margin: 10px 0;
        background: white;
        box-shadow: 0 2px 4px rgba(0,0,0,0.1);
    }
</style>
""", unsafe_allow_html=True)

def main():
    try:
        if 'outputs' not in st.session_state:
            st.session_state.outputs = None
        if 'generated' not in st.session_state:
            st.session_state.generated = False
        st.markdown('<div class="main-header">Spreadsheet to PowerPoint Generator</div>', unsafe_allow_html=True)
        with st.sidebar:
            # API Provider selection
            api_provider = st.selectbox(
                "API Provider",
                ["OpenAI", "OpenRouter"],
                help="Select which API to use. Make sure the corresponding API key is set in your .env file"
            )

            # Model selection based on provider
            if api_provider == "OpenAI":
                model = st.selectbox(
                    "AI Model",
                    [
                        "gpt-4o",
                        "gpt-4-turbo",
                        "gpt-4",
                        "gpt-3.5-turbo",
                    ],
                    help="OpenAI models. Requires OPENAI_API_KEY in .env file"
                )
            else:  # OpenRouter
                model = st.selectbox(
                    "AI Model",
                    [
                        "openai/gpt-5.2",
                        "openai/gpt-4-turbo",
                        "openai/gpt-4o",
                        "anthropic/claude-3-opus",
                        "anthropic/claude-3-sonnet",
                    ],
                    help="OpenRouter models. Requires OPENROUTER_API_KEY in .env file"
                )
            with st.expander("Advanced Settings"):
                num_slides = st.slider("Number of Slides", 4, 10, 6)
                num_charts = st.slider("Number of Charts", 3, 6, 4)
        col1, col2 = st.columns([1, 1])
        with col1:
            st.markdown("### Input")
            uploaded_file = st.file_uploader(
                "Upload CSV",
                type=['csv'],
                help="Upload any CSV file. The app will automatically detect columns and create appropriate charts and slides."
            )
            use_example = st.checkbox("Use example data (kpis.csv)", value=True if not uploaded_file else False)
            if uploaded_file or use_example:
                if use_example:
                    csv_path = "kpis.csv"
                    df = pd.read_csv(csv_path)
                else:
                    df = pd.read_csv(uploaded_file)
                    with tempfile.NamedTemporaryFile(delete=False, suffix='.csv', mode='w') as f:
                        df.to_csv(f, index=False)
                        csv_path = f.name
                with st.expander(" Preview Data", expanded=False):
                    try:
                        st.dataframe(df, width='stretch')
                    except Exception as e:
                        st.write("**Data Preview:**")
                        st.table(df.head(20))
                        if len(df) > 20:
                            st.caption(f"Showing first 20 of {len(df)} rows")
                    st.caption(f"Rows: {len(df)} | Columns: {len(df.columns)}")
            else:
                csv_path = None
                st.info("Upload a CSV or use example data to continue")
            goal = st.text_area(
                "Goal",
                value="Create a 6-slide investor update for Apr–Sep 2025. Focus on growth, retention, unit economics, and runway.",
                height=100,
                help="Describe what you want the AI to create"
            )
            generate_btn = st.button("Generate Artifacts", type="primary", use_container_width=True)
        with col2:
            st.markdown("### Output")
            status_container = st.empty()
            progress_bar = st.progress(0)

            if not generate_btn:
                status_container.info("Configure settings and click 'Generate Artifacts'")
        if generate_btn:
            if not csv_path:
                st.error("Please upload a CSV or select 'Use example data'")
                st.stop()
            try:
                status_container.info("Processing... This may take 30-60 seconds")
                progress_bar.progress(10)
                output_dir = Path("out")
                output_dir.mkdir(exist_ok=True)
                progress_bar.progress(20)
                with st.spinner("Generating artifacts..."):
                    outputs: RunOutputs = run_pipeline(
                        csv_path=csv_path,
                        goal=goal,
                        outdir=str(output_dir),
                        model=model,
                        num_slides=num_slides,
                        num_charts=num_charts
                    )
                st.session_state.outputs = outputs
                st.session_state.generated = True
                progress_bar.progress(100)
            except Exception as e:
                status_container.markdown(
                    f'<div class="error-box"> <b>Error:</b> {str(e)}</div>',
                    unsafe_allow_html=True
                )
                st.exception(e)
                st.session_state.generated = False
        if st.session_state.generated and st.session_state.outputs:
            outputs = st.session_state.outputs
            try:
                if "Error" not in outputs.logs:
                    status_container.markdown(
                        '<div class="success-box"><b>Success!</b> Artifacts generated successfully</div>',
                        unsafe_allow_html=True
                    )
                    tab1, tab2, tab3, tab4 = st.tabs(["PowerPoint", "Excel", "JSON Plan", "Logs"])
                    with tab1:
                        st.markdown("### PowerPoint Slides")
                        pptx_path = Path(outputs.pptx_path)
                        if pptx_path.exists():
                            try:
                                prs = Presentation(str(pptx_path))
                                slide_count = len(prs.slides)
                            except:
                                slide_count = "unknown"
                            with open(pptx_path, "rb") as f:
                                st.download_button(
                                    label="Download PowerPoint",
                                    data=f.read(),
                                    file_name="investor_update.pptx",
                                    mime="application/vnd.openxmlformats-officedocument.presentationml.presentation",
                                    width='stretch',
                                    key="pptx_download"
                                )
                            st.markdown("---")
                            col_info1, col_info2 = st.columns(2)
                            with col_info1:
                                st.metric("Slides", slide_count)
                            with col_info2:
                                file_size = pptx_path.stat().st_size / 1024  # KB
                                st.metric("File Size", f"{file_size:.1f} KB")
                        else:
                            st.error("PowerPoint file not found")
                    with tab2:
                        st.markdown("### Excel Workbook")
                        xlsx_path = Path(outputs.xlsx_path)
                        if xlsx_path.exists():
                            with open(xlsx_path, "rb") as f:
                                st.download_button(
                                    label="Download Excel",
                                    data=f.read(),
                                    file_name="investor_update.xlsx",                               mime="application/vnd.openxmlformats-officedocument.spreadsheetml.sheet",
                                    width='stretch',
                                    key="xlsx_download"
                                )
                            wb = openpyxl.load_workbook(xlsx_path)
                            st.markdown("#### Data Preview")
                            ws = wb["Model"]
                            data = []
                            headers = [cell.value for cell in ws[1]]
                            for row in ws.iter_rows(min_row=2, values_only=True):
                                data.append(row)
                            df_preview = pd.DataFrame(data, columns=headers)
                            try:
                                st.dataframe(df_preview.head(10), width='stretch')
                            except Exception:
                                st.table(df_preview.head(10))
                            if len(df_preview) > 10:
                                st.caption(f"Showing first 10 of {len(df_preview)} rows")
                        else:
                            st.error("Excel file not found")
                    with tab3:
                        st.markdown("### Schema-Locked JSON Plan")
                        plan_path = Path(outputs.plan_path)
                        if plan_path.exists():
                            with open(plan_path, "r") as f:
                                plan_data = json.load(f)
                            st.download_button(
                                label="Download JSON",
                                data=json.dumps(plan_data, indent=2),
                                file_name="plan.json",
                                mime="application/json",
                                key="json_download"
                            )
                            st.markdown("---")
                            st.json(plan_data)
                            col_a, col_b = st.columns(2)
                            with col_a:
                                st.metric("Charts Generated", len(plan_data.get("charts", [])))
                            with col_b:
                                st.metric("Slides Generated", len(plan_data.get("slides", [])))
                        else:
                            st.error("JSON plan not found")
                    with tab4:
                        st.markdown("### Generation Logs")
                        st.code(outputs.logs, language="text")
                else:
                    status_container.markdown(
                        f'<div class="error-box"> <b>Error occurred</b><br>{outputs.logs}</div>',
                        unsafe_allow_html=True
                    )
            except Exception as e:
                st.error(f"Error displaying results: {str(e)}")
                st.exception(e)
    except Exception as e:
        st.error(f"Fatal Error: {str(e)}")
        st.exception(e)
        st.info("Try installing dependencies: pip install -r requirements.txt")

if __name__ == "__main__":
    try:
        main()
    except Exception as e:
        import sys
        print(f"Fatal error: {e}", file=sys.stderr)
        import traceback
        traceback.print_exc()
In the Streamlit layer, we set an app frame with st.set_page_config( layout="wide"), then split the screen using st.columns() so the left side collects inputs while the right side shows run controls and outputs. The pipeline only runs when the user clicks st.button(), where we first guard against missing uploads, wrap st.spinner() so the UI doesn’t look frozen, then we ship the artifacts back to the user with st.download_button() for the Excel, PowerPoint, and plan file.
With this step complete, we save everything as app.py and launch the full experience with:
streamlit run app.pyLearn with DataCamp
Course
Course
Course
blog
Aashi Dutt
7 min
blog
Adel Nehme
7 min
Tutorial
Abid Ali Awan
Tutorial
Aashi Dutt
Tutorial
Javier Canales Luna
code-along
Andrea Valenzuela