Course
Introduction to Power BI
4 hr
793.3K
In this article, we will navigate through the various stages of becoming a proficient Power BI developer, from acquiring foundational knowledge and hands-on experience to achieving professional certification and understanding the diverse career opportunities available.
We have a separate article that discusses what Power BI is, its history, and where its strengths and weaknesses are. To learn more about what Power BI is capable of if you master it, check out our article on what you can do with Power BI.
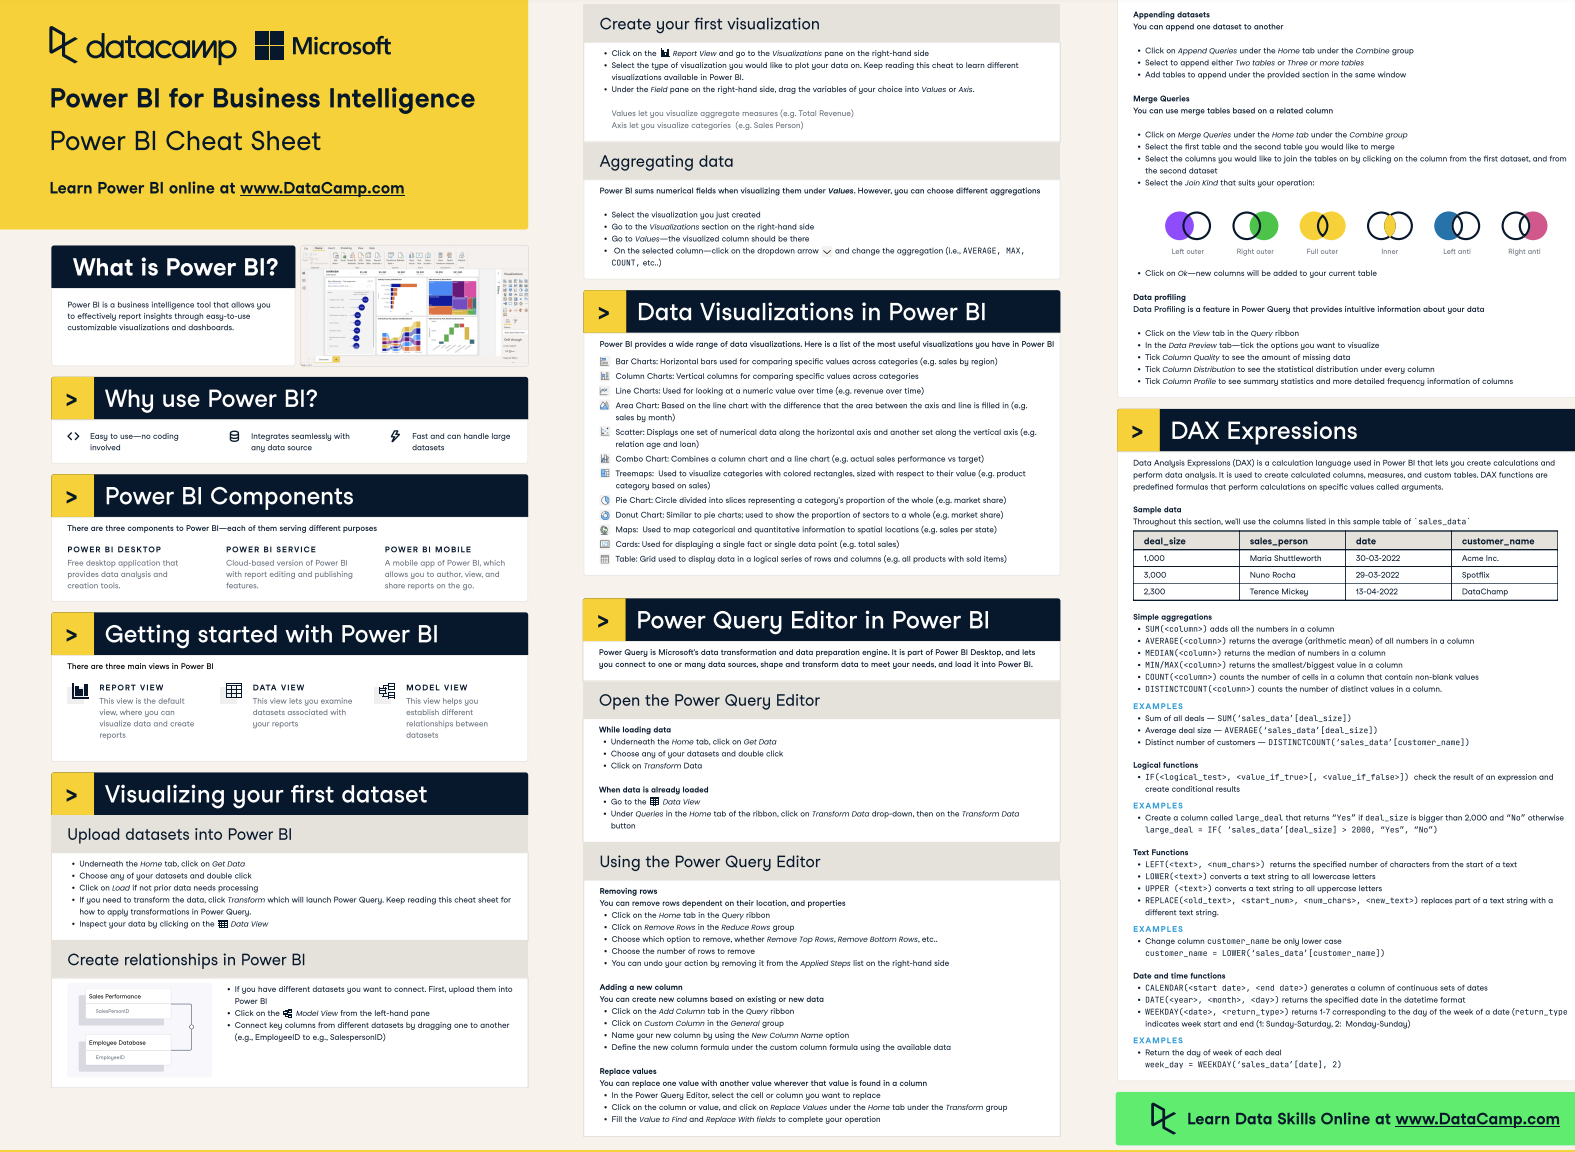
You can use our Power BI cheat sheet to get started with Power BI quickly–from creating your first visualization to Power Query and DAX calculations.
As you work through this roadmap, adopt an implementation mindset. Each time you learn a new concept, consider how you can implement it in Power BI using actual data. The faster you can move from theory to practice, the more quickly you can become proficient in Power BI.
Our comprehensive Data Analyst in Power BI career track covers every step of this roadmap. You’ll learn everything you need to know to land your first job as a Power BI developer, and it fully prepares you to get certified (more on that later).
To begin your journey into Power BI, it's important first to understand what BI is, why it's important, and how it can help businesses make data-driven decisions. By understanding the role of BI in an organization and the value it can bring to businesses and individuals, you can approach your learning from a practical standpoint.
Once you have a better understanding of the field of business intelligence, you should start exploring the available BI tools, including Power BI. A common Power BI interview question you may encounter one day is whether you know of any other BI platforms and how Power BI compares to them, so use this time to get familiar with the BI landscape.
For starters, check out our comparison of Power BI vs Tableau in our full guide.

Before going any further, download and install Power BI Desktop. It's completely free, but it only works on Windows, so keep that in mind.
The best way to learn Power BI is to dive in and start working with it hands-on. Before you start any courses, open up Power BI Desktop and explore the interface. Read the tooltips that appear when you hover over an icon or a button. Go through the ribbon and explore the visualization options. Doing this first will allow you to grasp new concepts and explanations later. When a course instructor or tutorial mentions the filter pane or the modeling tab in the ribbon, you will know what they refer to.
You can start going through Microsoft's official documentation and Datacamp’s Power BI tutorial for beginners to explore the basic features of Power BI and get familiar with the terminology. The sooner you can associate certain keywords with their place in Power BI Desktop, the quicker you'll be able to move through the basics and onto the real applications of Power BI - analyzing and visualizing data.
The next step is to learn to import data from various sources like Excel, databases, and cloud services. Find datasets that are already clean and ready to analyze to avoid getting bogged down with the more technical aspects of using the Power Query editor to clean and transform your data. That will come later.
You should focus on exploring and visualizing data at this stage. Start with simple charts and get comfortable with how you can visually represent your data. You will learn when to use each type of visualization. For example, line charts are good for showing trends over time, and bar charts are good for categorical data. We have an article on designing engaging Power BI reports with guidelines for choosing the right visualization and some key design features available in Power BI.
You can also find our guides on creating Gantt Charts and Power BI slicers that can help you create better reports.
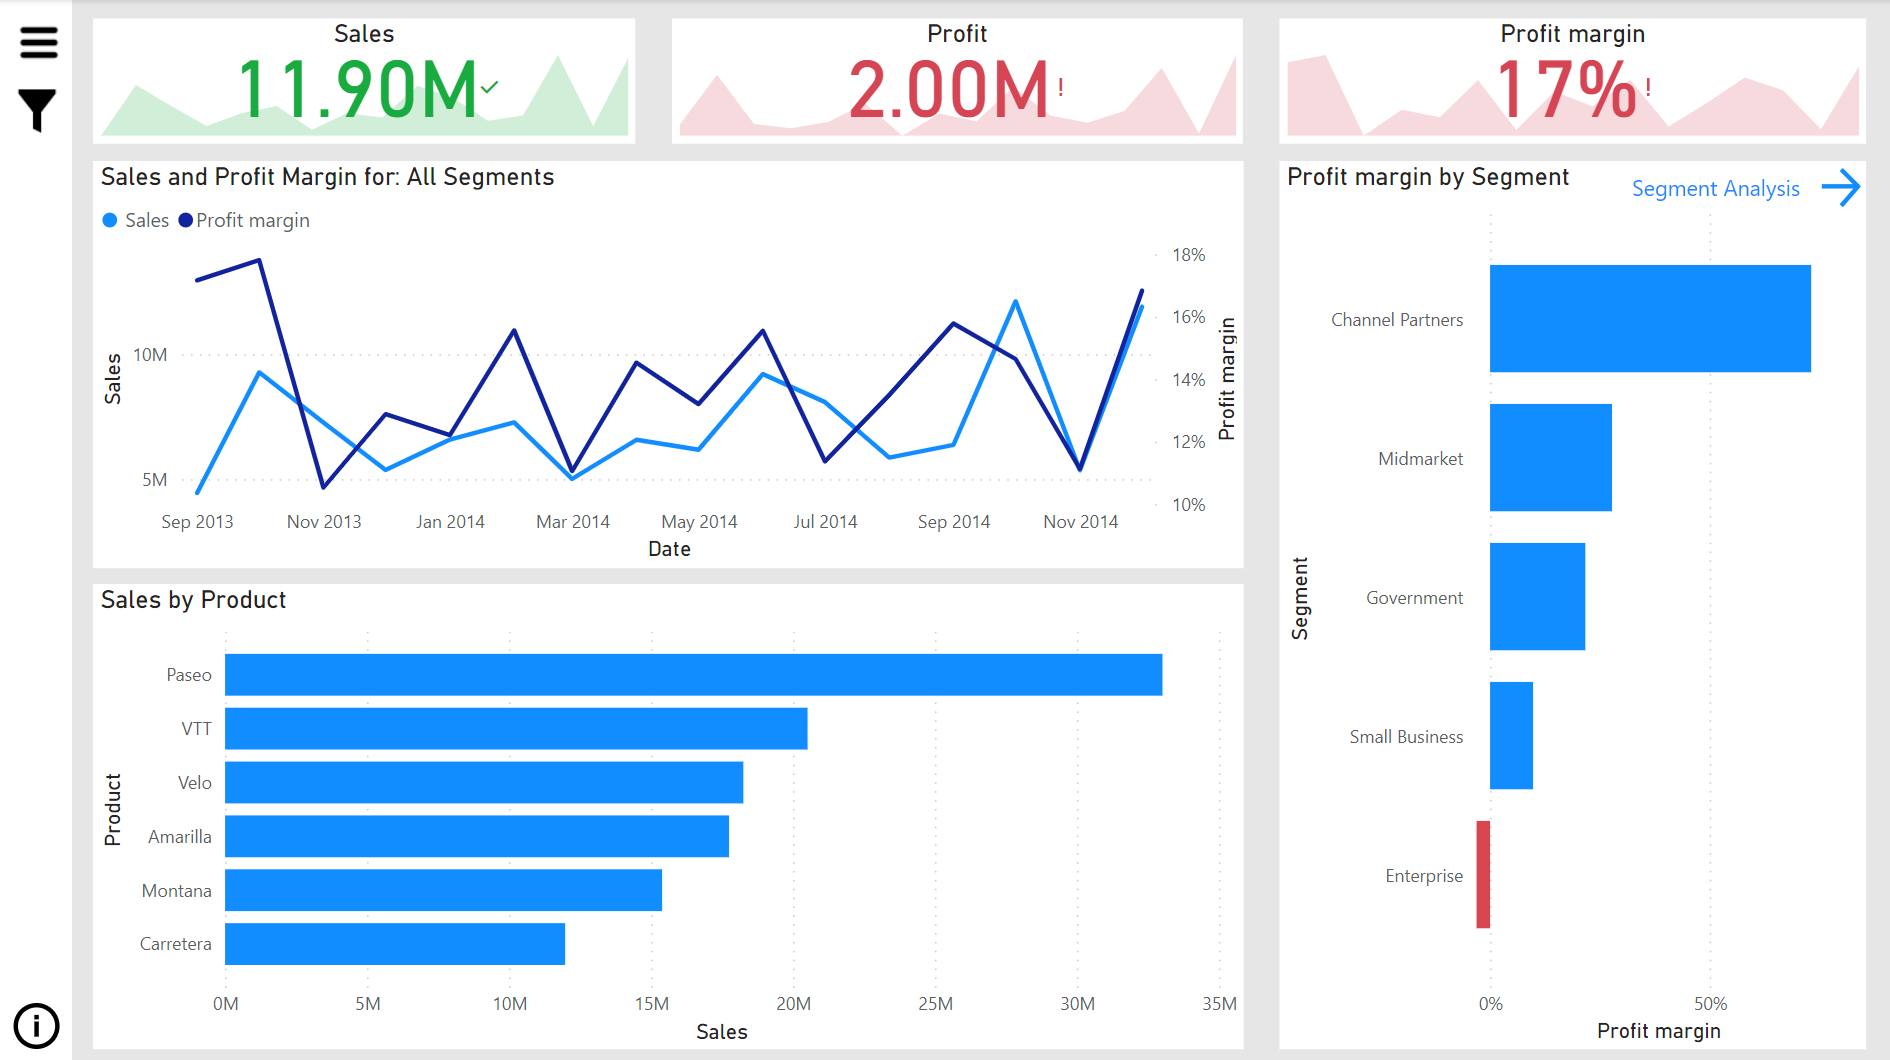
Image by author (Power BI Design Example)
This is where your journey into Power BI will become more technical. You should be comfortable with exploring and visualizing your data and should now start laying the groundwork for further analysis.
Proper data transformation and modeling are foundational for accurate and efficient data analysis. When your data is clean and well-modeled, you can trust the insights you derive from it. This confidence is crucial for making sound business decisions.
First, you will want to get comfortable transforming data using Power Query. This is where you will spend most of your time making your data tidy and useful. Here are a few key concepts you'll want to learn at this stage:
Once you've learned how to prepare your data for analysis, you can dive into data modeling. Check out our tutorial on data modeling in Power BI. This is where you will learn how to create relationships between your data tables. You will also learn about cardinality and how to set the cross filter direction. You can also learn about creating and customizing pivot tables in Power BI and how to merge tables in our separate tutorials.
When discussing data modeling in general, the term you will hear most often is the star schema. This is a widely adopted approach to designing data warehouses and relational databases and is the recommended approach in Power BI. Understand why this is the case, how the star schema compares to the snowflake schema, and which to choose depending on your situation.
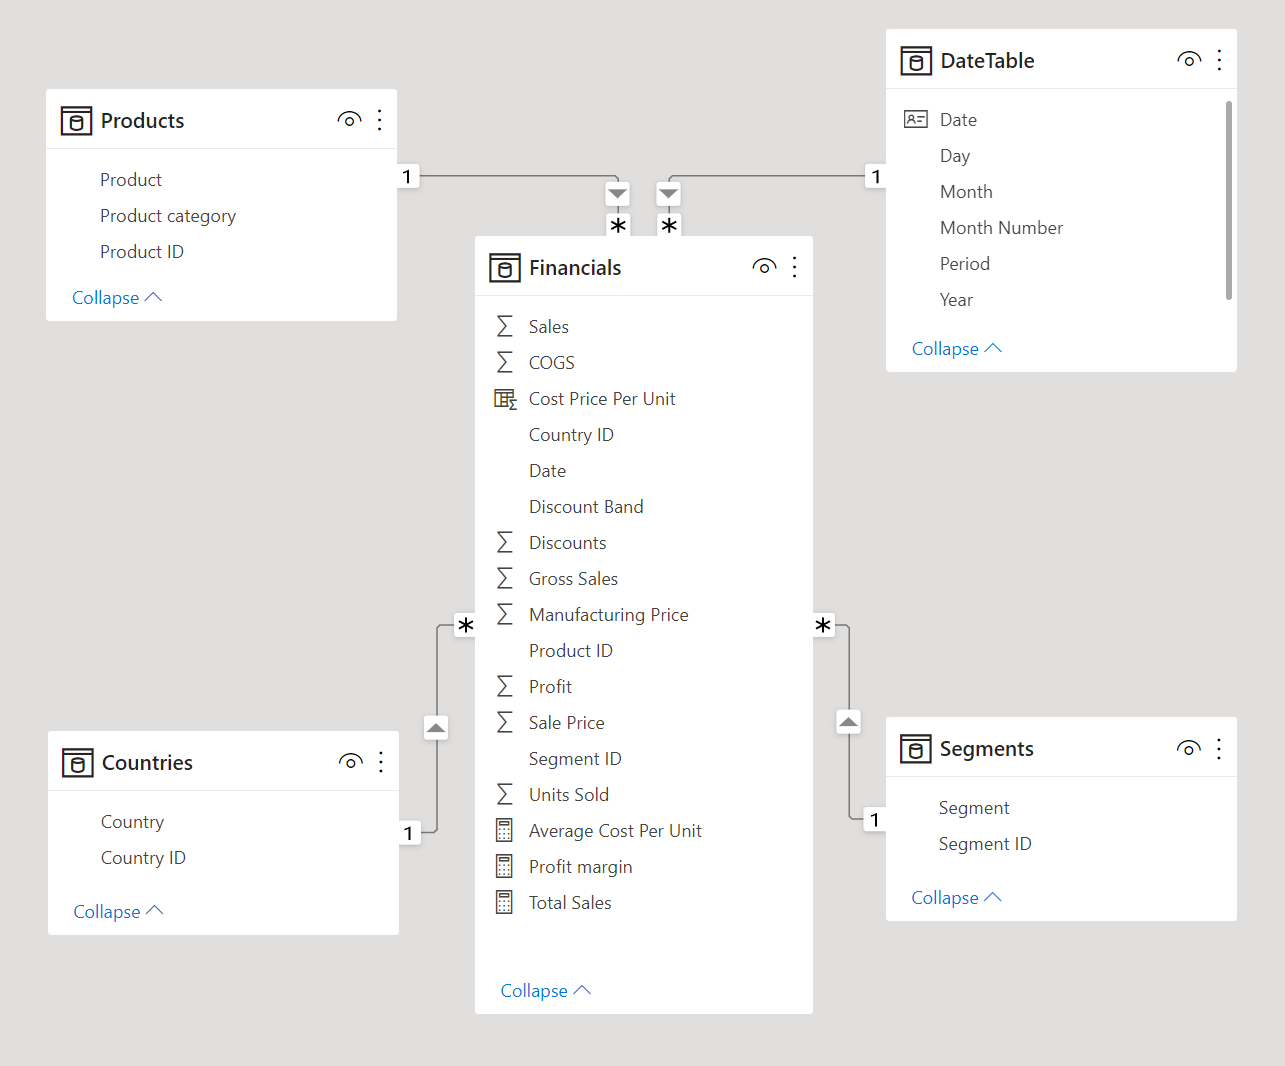
Image by author (Power BI Star Schema)
DAX or Data Analysis Expressions drive all the calculations you can perform in Power BI. DAX formulas are versatile, dynamic, and very powerful – they allow you to create measures, columns, and tables in your model. At this stage, you should learn the basics of DAX, including syntax, functions, and context. Our DAX tutorial will give you a quick introduction—practice writing simple summary measures and calculated columns for now.
Before moving on, ensure you also have a solid understanding of contexts in DAX formulas. DAX formulas in Power BI are dynamic and change according to the context in which they were created. Understanding how contexts work in DAX can help you avoid confusing formula errors. You can learn about specific DAX formulas, such as DAX SUMMARIZE() and DAX LOOKUPVALUE, in our range of tutorials.
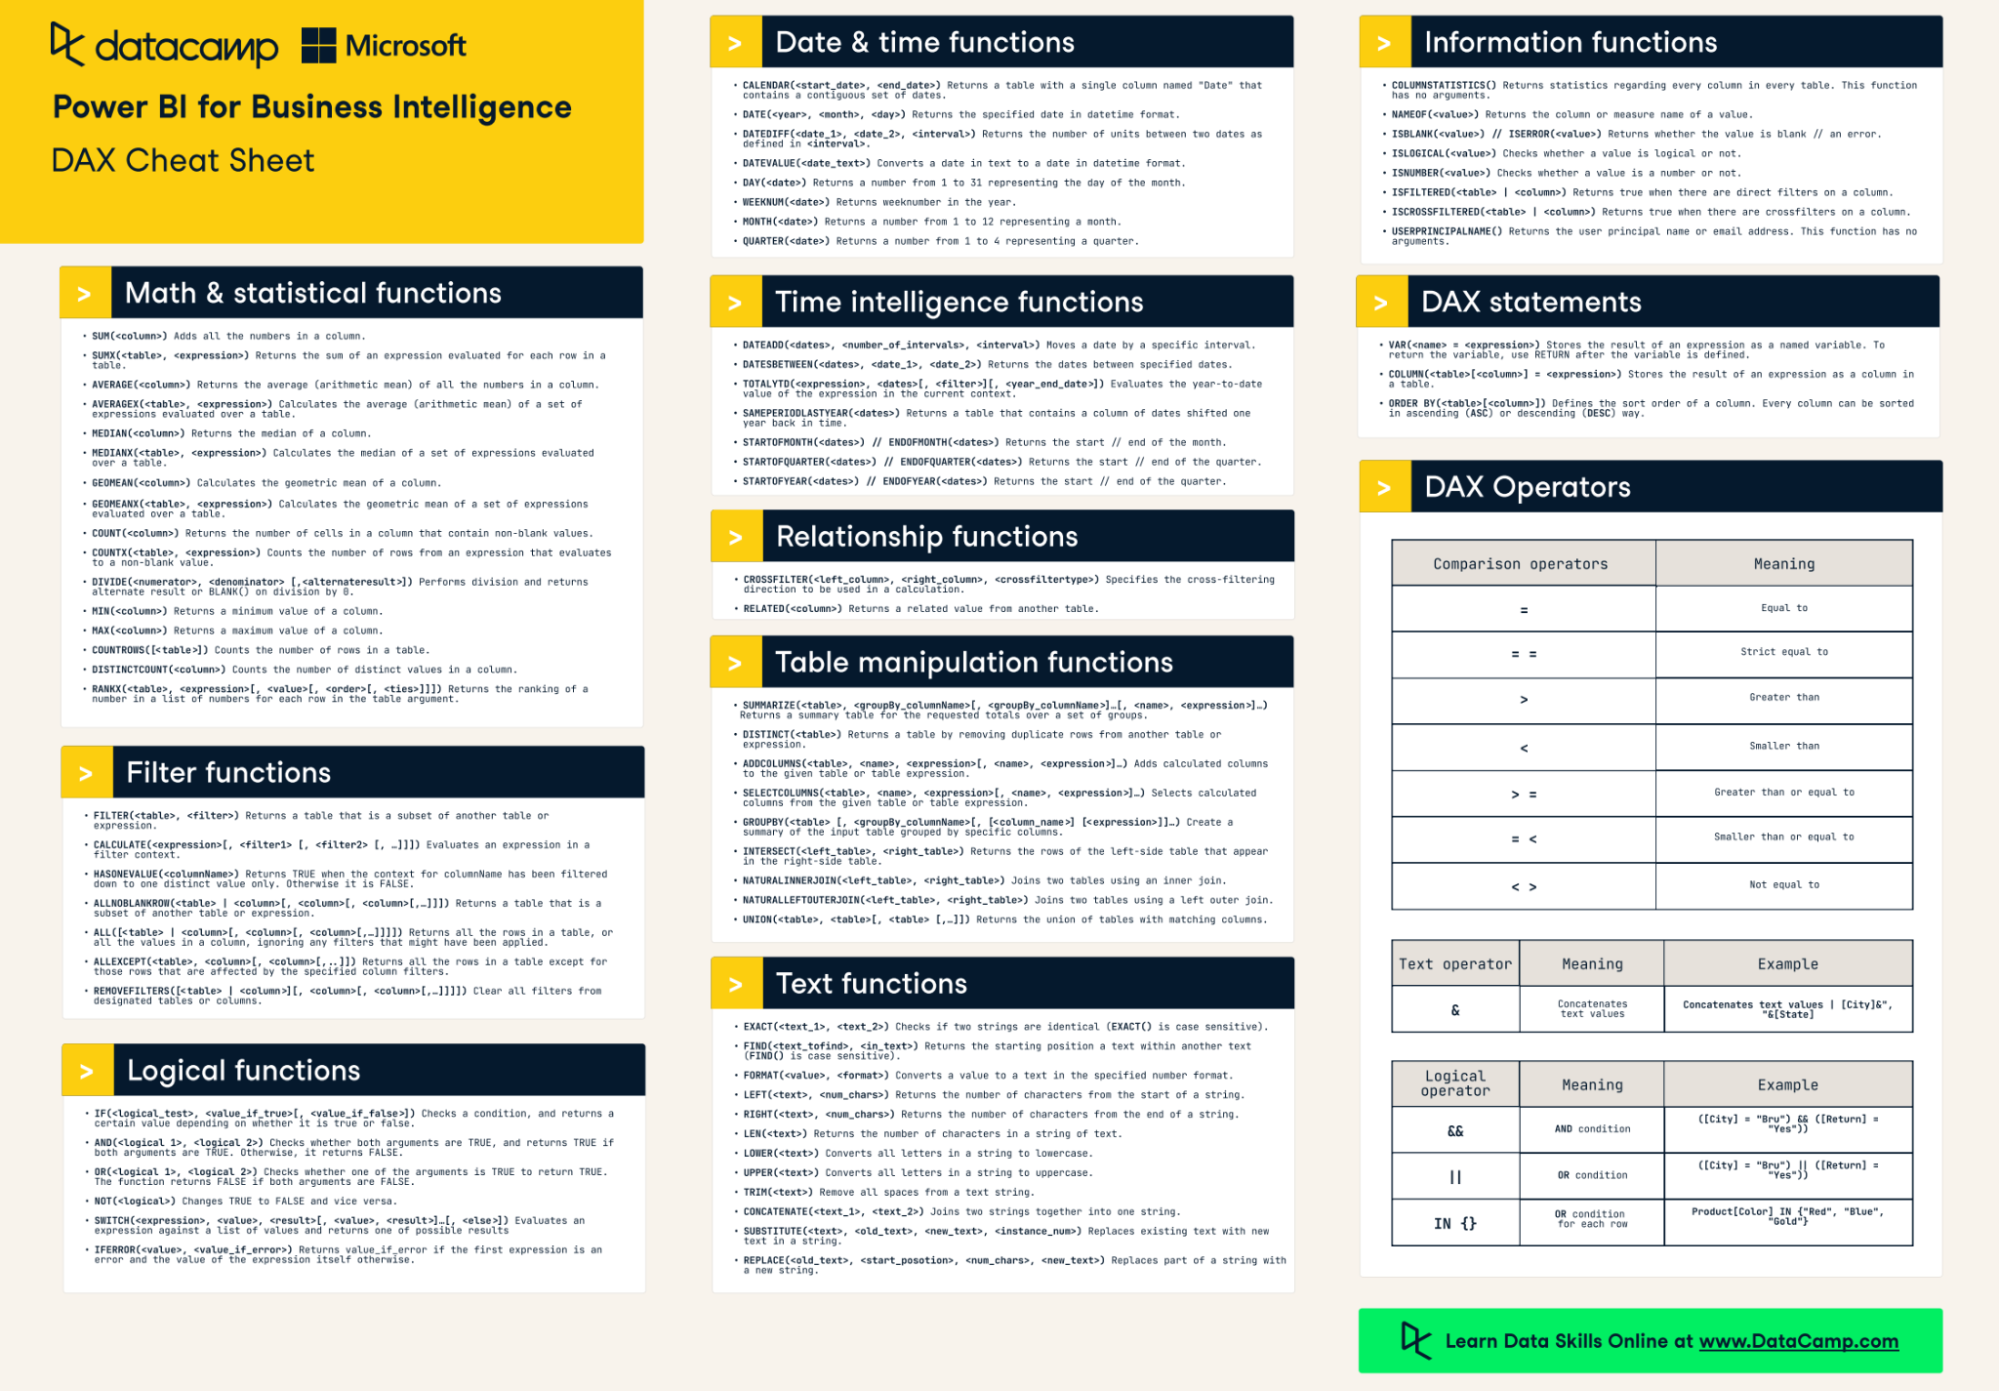
Check out our DAX cheat sheet for a quick overview of DAX formulas and statements in Power BI.
The advanced features of Power BI can greatly enhance the analytical capabilities of your reports. We have a quick tutorial that will take you through some of the advanced visualization and analytics options in Power BI. These include custom visuals, conditional formatting, dynamic lines, trend lines, forecasting, and clustering.
At this stage, you can also deepen your knowledge of DAX by learning more advanced DAX concepts and formulas to perform complex calculations.
You can take it further by learning how to use Power BI for predictive analytics. This is where you can branch out into programming and learn to write R or Python scripts directly in Power BI to create powerful predictive analytics models. Our tutorial on mastering predictive analytics with Power BI can quickly get you up to speed. You can also learn about new tools and features, such as how to use Power BI Copilot in Microsoft Fabric.
You should now be ready to move beyond learning and practicing skills in isolation. You should apply your new skills to real-world data, solving actual problems and showcasing your ability to turn data into insights. Working on real-world projects gives you hands-on experience and a better understanding of how you can use Power BI in business contexts. We have an interactive course analyzing job market data using Power BI that will guide you through a real-world dataset from start to finish.
Building a stand-out professional portfolio will catch the attention of potential employers and demonstrate that you have the skills needed to get the job done.
Start with datasets that interest you or are relevant to your desired industry. Each project should have a clear use case or business question it addresses. This approach will make your portfolio projects more impactful and relatable to potential employers.
For each project in your portfolio, document your process from start to finish. Explain how you transformed and modeled the data, the insights you discovered, and why you chose specific visualizations. Discuss any challenges you faced and how you resolved them, demonstrating your problem-solving skills and adaptability.
Getting certified is a significant milestone in becoming a Power BI developer. Certifications demonstrate and validate your skills, opening you up to more career opportunities.
The Microsoft Certified: Power BI Data Analyst Associate certification is well-known and will carry a lot of weight on your resume, so it is one of the most highly recommended certifications to get if you want to be a Power BI developer.
Our Data Analyst in Power BI career track can fully prepare you for this certification. You can also check out this webinar, where we give an in-depth overview of this career track and what you can expect.
You must pass the certification exam, Exam PL-300: Microsoft Power BI Data Analyst, which covers various aspects of Power BI, including data preparation, modeling, visualization, and maintaining datasets in Power BI. You could also get a 50% discount on the PL-300 exam through DataCamp!
As you progress through your career, you'll encounter various stages, each offering unique roles and responsibilities that contribute significantly to your professional growth and the value you bring to organizations. Throughout each stage, the role of a Power BI developer is marked by continuous learning, adapting to new technologies, and keeping up with the latest trends in data analytics.
At the entry-level, you begin in roles like junior Power BI developer or data analyst. Here, you'll focus on learning the basic applications of Power BI in an organization, honing your skills in data visualization, and understanding how to transform raw data into meaningful insights. It’s about laying a strong foundation in data handling and report creation.
As you move to mid-level, your responsibilities and the complexity of tasks increase. You will see roles such as Power BI developer or business intelligence analyst at this level. You won’t just be creating basic reports but moving into advanced data modeling, tackling more intricate DAX calculations, and working closely with stakeholders to translate business requirements into actionable data insights.
Reaching advanced levels in your Power BI career means you're ready to specialize or take on leadership roles. Positions like senior Power BI developer, Power BI consultant, or business intelligence manager are common here. Your focus shifts to managing complex projects, leading teams, developing strategic BI initiatives, and possibly providing consultancy to clients. This level is characterized by a deeper involvement in shaping business strategies and driving data-driven cultures within organizations.
Becoming a Power BI developer starts with building a strong foundation in Power BI fundamentals, including data modeling and visualization. As you progress, tackle real-world projects to deepen your understanding and refine your skills. Embrace feedback and collaboration, as these are invaluable for growth and learning.
Remember, the role of a Power BI developer goes beyond technical skills. Understanding the business context, communicating insights effectively, and maintaining data privacy and security are key components of success. Balance attention to detail with an eye on your projects' bigger picture and overall goals.
If you’re ready to get started, check out our Data Analyst in Power BI career track, which has everything you need to support you on your journey.
Master the world's most popular business intelligence tool.
Start Your Power BI Journey Today!
Course
Course
Course
blog
Matt Crabtree
11 min
blog
Joleen Bothma
9 min
blog
Matt Crabtree
10 min
blog
Joleen Bothma
6 min
blog
Joleen Bothma
10 min
blog
Austin Chia
15 min