Introduction to DAX in Power BI
BeginnerSkill Level
3 hr
172.1K learners
There are three ways you can use DAX formulas in Power BI:
The main difference between these three calculation types is their context (more on this later) and the outputs they produce.
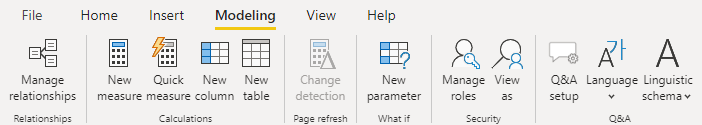
To add any one of these types of calculations to a model, navigate to the Modeling tab of the ribbon. Here, you will find three choices for adding a new measure, calculated column, or table. Alternatively, you can right-click a table in the Fields pane and get the option to add a new measure or calculated column in the drop-down menu.
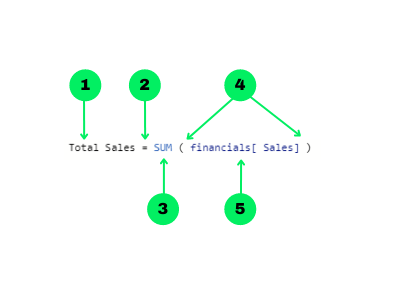
DAX formulas are intuitive and easy to read. This makes it easy to understand the basics of DAX so you can start writing your own formulas relatively quickly. Let’s go over the building blocks of proper DAX syntax.
DAX functions can also be nested inside each other to perform multiple operations efficiently. This can save a lot of time when writing DAX formulas. For example, it is often useful to have multiple nested IF statements or to use the IFERROR function to wrap around another function so that any errors in the formula are represented by the value you specify.
Some of the most common DAX functions used in reports are:
COUNT, DISTINCTCOUNT, SUM, AVERAGE, MIN, MAX.SUMMARISE: Returns a table typically used to further apply aggregations over different groupings.CALCULATE: Performs an aggregation along with one or more filters. When you specify more than one filter, the function will perform the calculation where all filters are true.IF: Based on a logical condition, it will return a different value if it is true or false. This is similar to the CASE WHEN operation in SQL.IFERROR: Looks for any errors for an inner function and returns a specified resultISBLANK: This function checks if the rows in a column are blank and returns true or false. It is useful in conjunction with other functions like IF.EOMONTH: Returns the last day of the month of a given date (column reference in a date format) for as many months in the past or the future.DATEDIFF: returns the difference between two dates (both as column references in date formats) in days, months, quarters, years, etc.DAX formulas in Power BI are dynamic and change according to the context in which they were created. It’s important to understand how contexts work in DAX, as it can help save you a lot of headaches when you run into confusing errors in your formulas.
There are two main types of context in DAX: row context and filter context.
This refers to just “the current row” across all columns of a table and extends to all columns in related tables. This type of context lets the DAX formula know which rows to use for a specific formula.
Here is an example of a formula for a calculated column that has a row context:
Cost Price Per Unit = financials[COGS] / financials[Units Sold]
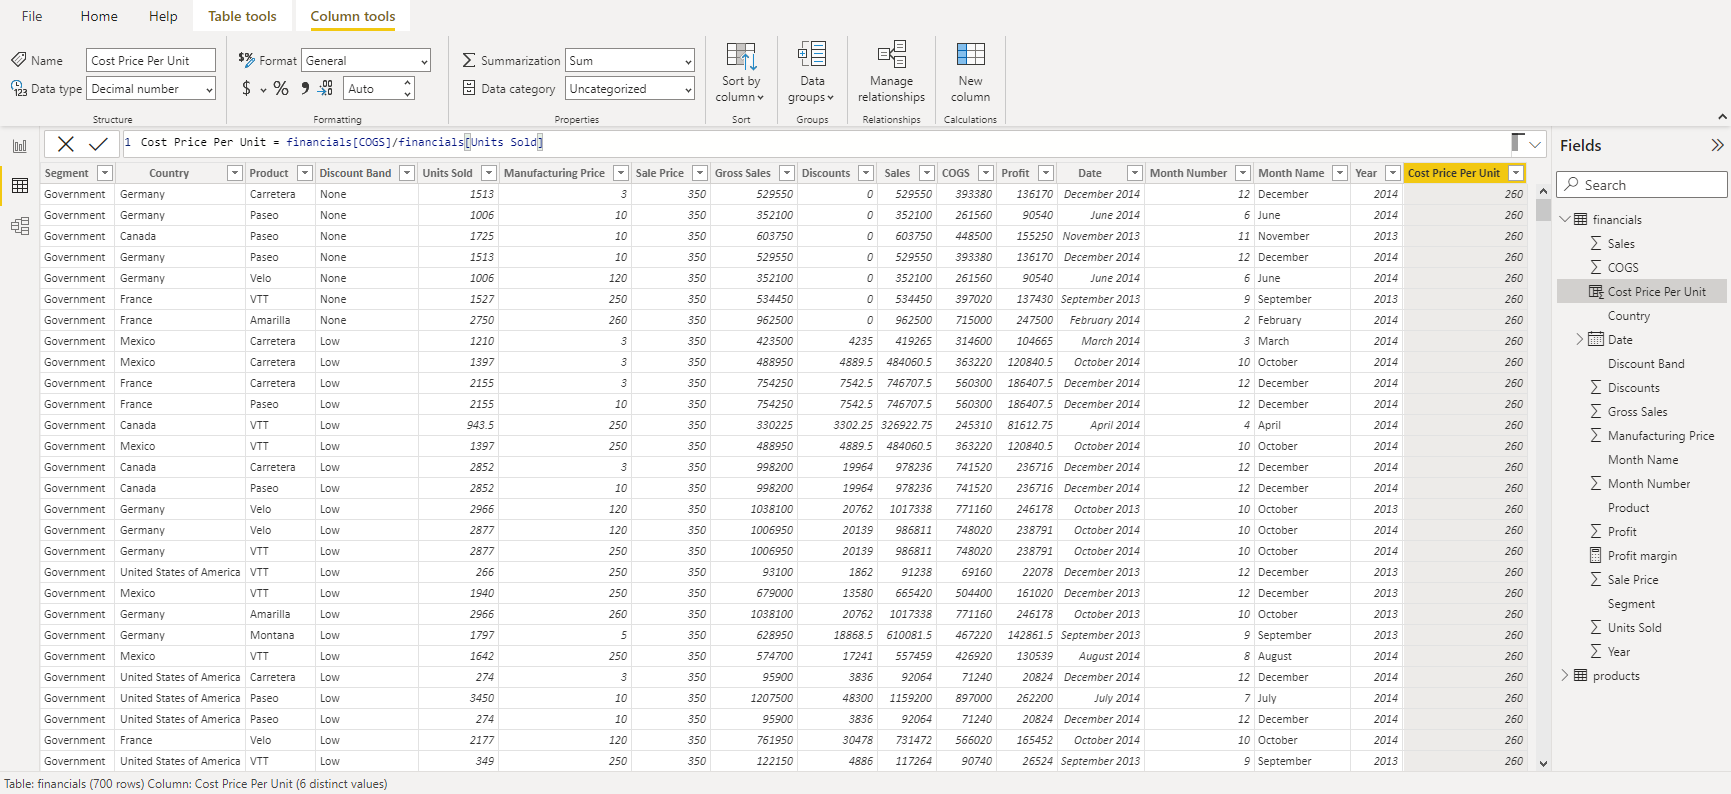
In this example, the Cost Price Per Unit is calculated on a row-by-row basis. This means that DAX needs to know the current row as it proceeds through the dataset, making the calculation and populating the new column with the result.
Row context is implicit in calculated columns. This is because the calculations performed in calculated columns are done on a row-by-row basis; thus, the row context is defined by default. However, this is not the case in measures since the aggregations are applied for all rows in a table. These calculations do not need to have any knowledge of a current row since all rows are aggregated together.
As an example of a measure, consider the following DAX formula:
Profit margin = SUM ( financials[Profit] ) / SUM ( financials[Sales] )
In this case, the entire Profit column is summed to produce a single number, and this is divided by the sum of the entire Sales column. DAX does not need to know the current row since it performs an aggregation. Thus, this measure has no row context.
To explicitly define a row context in a measure, you need to use a special function called an iterator. Examples of iterator functions are SUMX, AVERAGEX, and COUNTX. These functions will first perform a calculation on a row-by-row basis and then perform the final aggregation on the result (i.e., sum, average, count, etc.). In this way, the row context is defined explicitly by using these iterators.
Let’s take a look at an example of an iterator function in action:
Average Cost Per Unit = AVERAGEX ( financials, financials[COGS] / financials[Units Sold] )
This example performs two calculations: first, the expression is evaluated on a row-by-row basis, and then the result is applied to the AVERAGE function. An alternative way of reaching this same result is to first create the calculated column Cost Price Per Unit as we did above and then create a separate AVERAGE measure for that column. However, knowing when to use these iterator functions can make your reports more efficient and use less memory, as you can effectively perform two calculations using just a single formula.
Filter context is applied on top of a row context and refers to a subset of rows or columns that are specified as filters in the report. Filters can be applied in a few ways:
A good example of adding a filter context to a DAX formula is using the CALCULATE function, which allows you to add one or more filter parameters to the measure. In the example below, we create a profit margin measure filtered for the USA only:
USA Profit Margin = CALCULATE ( SUM ( financials[Profit] ) / SUM ( financials[Sales] ), financials[Country] = "United States of America")
When learning DAX, beginners often encounter common pitfalls that can make understanding and debugging formulas more challenging. Here are some of the issues and tips to address them:
1. Confusing row and filter contexts: Many beginners struggle with distinguishing between row and filter contexts. Remember that row context refers to operations performed row-by-row (e.g., calculated columns). In contrast, filter context applies additional filters to calculations (e.g., slicers or filters in a report). Tip: Use iterator functions like SUMX or AVERAGEX to explicitly define row contexts in measures.
2. Overusing calculated columns: While calculated columns are useful, they can often be replaced by measures, which are more memory-efficient and dynamic. Creating unnecessary calculated columns can bloat your data model. Tip: Use measures whenever possible, as they are calculated on the fly, and do not permanently increase the size of your data model.
3. Neglecting proper naming conventions: Poorly named measures or calculated columns can quickly become confusing in complex reports. Tip: Adopt consistent and descriptive naming conventions to organize your DAX formulas.
4. Ignoring performance optimization: DAX formulas can become slow with large datasets if not optimized. Overcomplicated formulas or excessive use of nested functions may lead to performance issues. Tip: Use tools like DAX Studio to analyze and optimize your formulas, and consider simplifying calculations where possible.
To improve the performance of DAX formulas, especially in large datasets, follow these best practices:
| Best practice | Description |
|---|---|
| Use measures over calculated columns | Measures are dynamic and calculated on demand, consuming less memory than calculated columns. |
| Avoid nested iterations | Minimize the use of complex nested functions (e.g., SUMX, AVERAGEX) to prevent performance bottlenecks. |
| Filter early | Apply filters at the data source or in DAX formulas to reduce the number of rows processed. |
| Leverage variables | Use VAR to store intermediate results and avoid redundant calculations within a formula. |
| Simplify relationships | Ensure the data model has clear relationships and appropriately indexed tables for faster processing. |
| Optimize cardinality | Reduce the number of unique values in columns used for filtering or joining to enhance performance. |
You now have some basic DAX tools to try out, and they are just the tip of the iceberg of all that DAX can do. With over 250 functions, the road to DAX mastery is challenging and rewarding. You can start taking your DAX skills to the next level today with our Introduction to DAX in Power BI course!
Master the world's most popular business intelligence tool.
Learn more about Power BI with these courses!
Course
Course
Course
Tutorial
DataCamp Team
Tutorial
Austin Chia
Tutorial
Kafaru Simileoluwa
Tutorial
Austin Chia
Tutorial
Joleen Bothma
Tutorial
Joleen Bothma