Course
Introduction to Power BI
4 hr
793.3K
Master the world's most popular business intelligence tool.
Using Python with Power BI introduces a whole new set of possibilities for working with data. Python turns Power BI into a platform that can do almost anything.
Here are a few examples of the types of tasks that can be performed with Python in Power BI:
Some limitations in using Python with Power BI that you should keep in mind when writing your scripts are:
As mentioned, Power BI Service only supports a limited number of Python libraries. These same restrictions do not apply when building reports using Power BI Desktop, so keep an eye on the libraries you are using if you intend to publish your reports to Power BI Service.
Also, bear in mind that Power BI Service currently supports the Python 3.7.7 runtime. If you are writing your Python scripts in an earlier version of Python, then your code may not run correctly.
Power BI Service supports these libraries:
It is worth noting that in order for the integration between Power BI and Python to work, a minimum of two Python libraries must be installed – Pandas and Matplotlib.
Before you can write any scripts in Power BI, you will need to install the latest version of Python from the Python website.
The Power BI documentation recommends that you avoid using environment managers like Anaconda since it could cause some issues with running the scripts. A possible workaround if using a custom environment in Anaconda is to activate the environment from the command line and then open Power BI Desktop from the command line, too.
However, if you are less familiar with these aspects of programming, then it is easier to stick to Power BI’s recommendation by just downloading Python from its website without using custom environments.
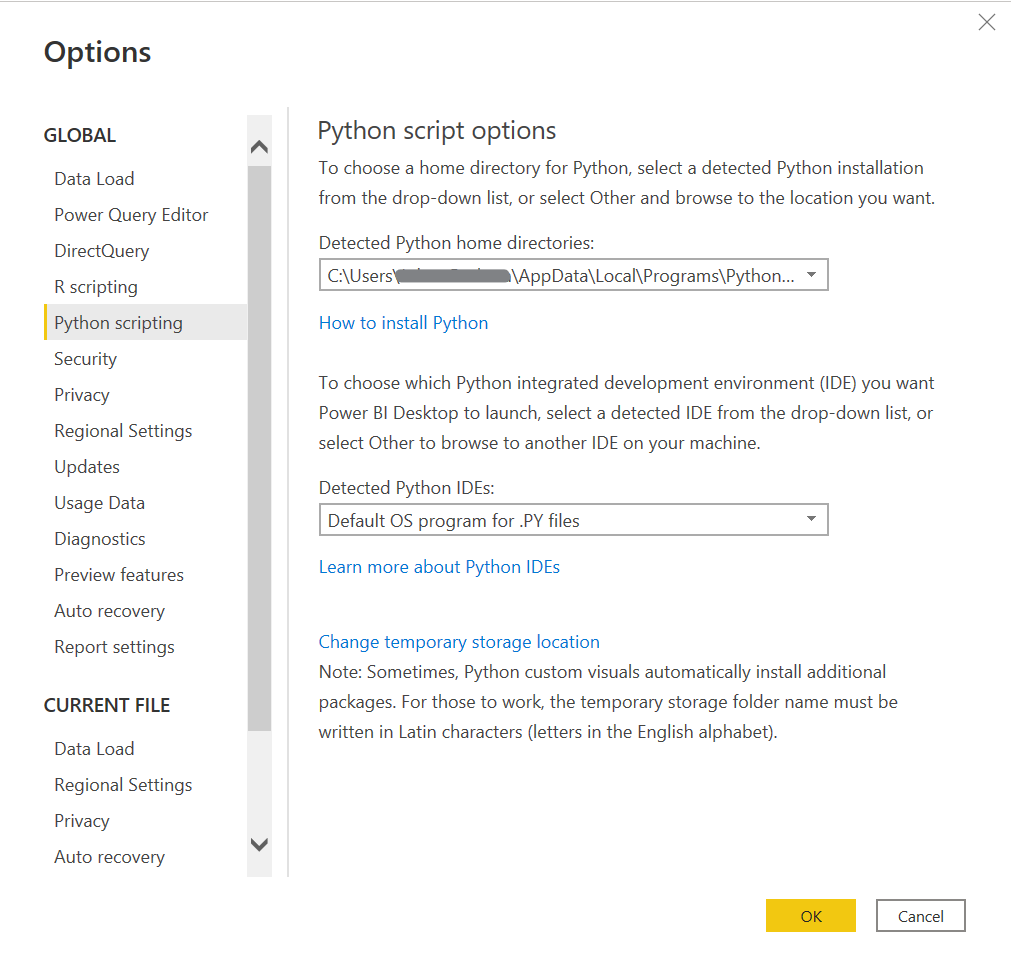
Once you have installed Python, you need to specify the correct Python file path in Power BI Desktop. From the ribbon, select ‘File’, then ‘Options and settings’, and then select ‘Options’. In the list of global options, look for ‘Python scripting’. This is where you will need to find the directory that contains the Python distribution.
You should be able to see all Python distributions installed on your computer in the drop-down selection. If you need to manually type in the file path, note that only absolute file paths are supported here, and you cannot enter a relative file path such as from the location of the Power BI report location
There are a few ways you can use Python scripts in Power BI:
The rest of this tutorial will cover how to use Python as a data source and to enrich an existing data source.
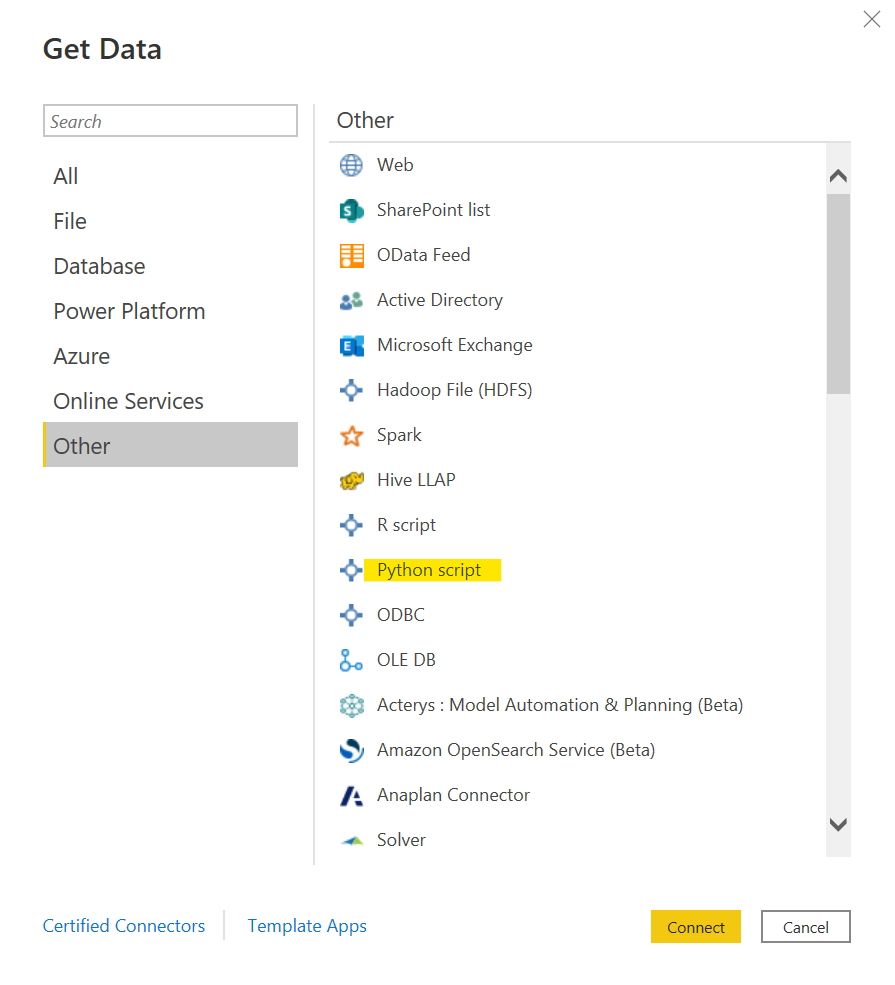
In the Home tab of the ribbon, select ‘Get data’ to bring up the full list of data connections. Select the ‘Other’ category and find ‘Python script’ on the list. This will allow you to write a Python script to import a dataset. I find this to be particularly useful when connecting to a data source that is not supported in Power BI’s list of connections, or even a dataset that requires extensive data transformation before importing (such as from an API).
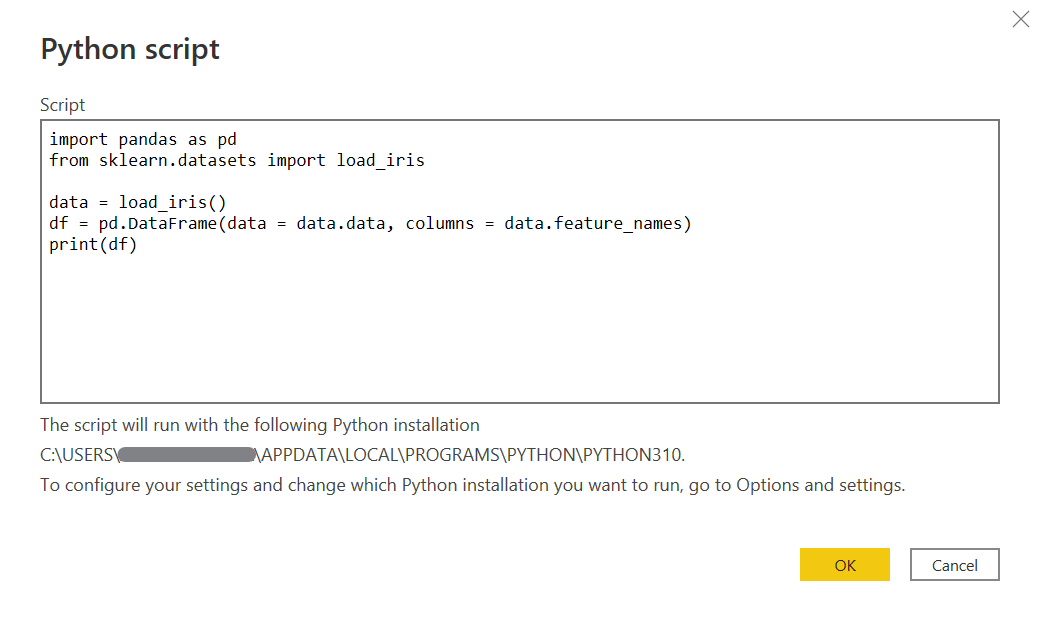
A dialogue box will pop up where you can enter your Python code. In this example, we will be using the Scikit-Learn library to load the Iris dataset that we will also use in the next section. Remember that Power BI only allows you to import Pandas DataFrames, so we must convert the dataset using ‘pd.DataFrame’ first.
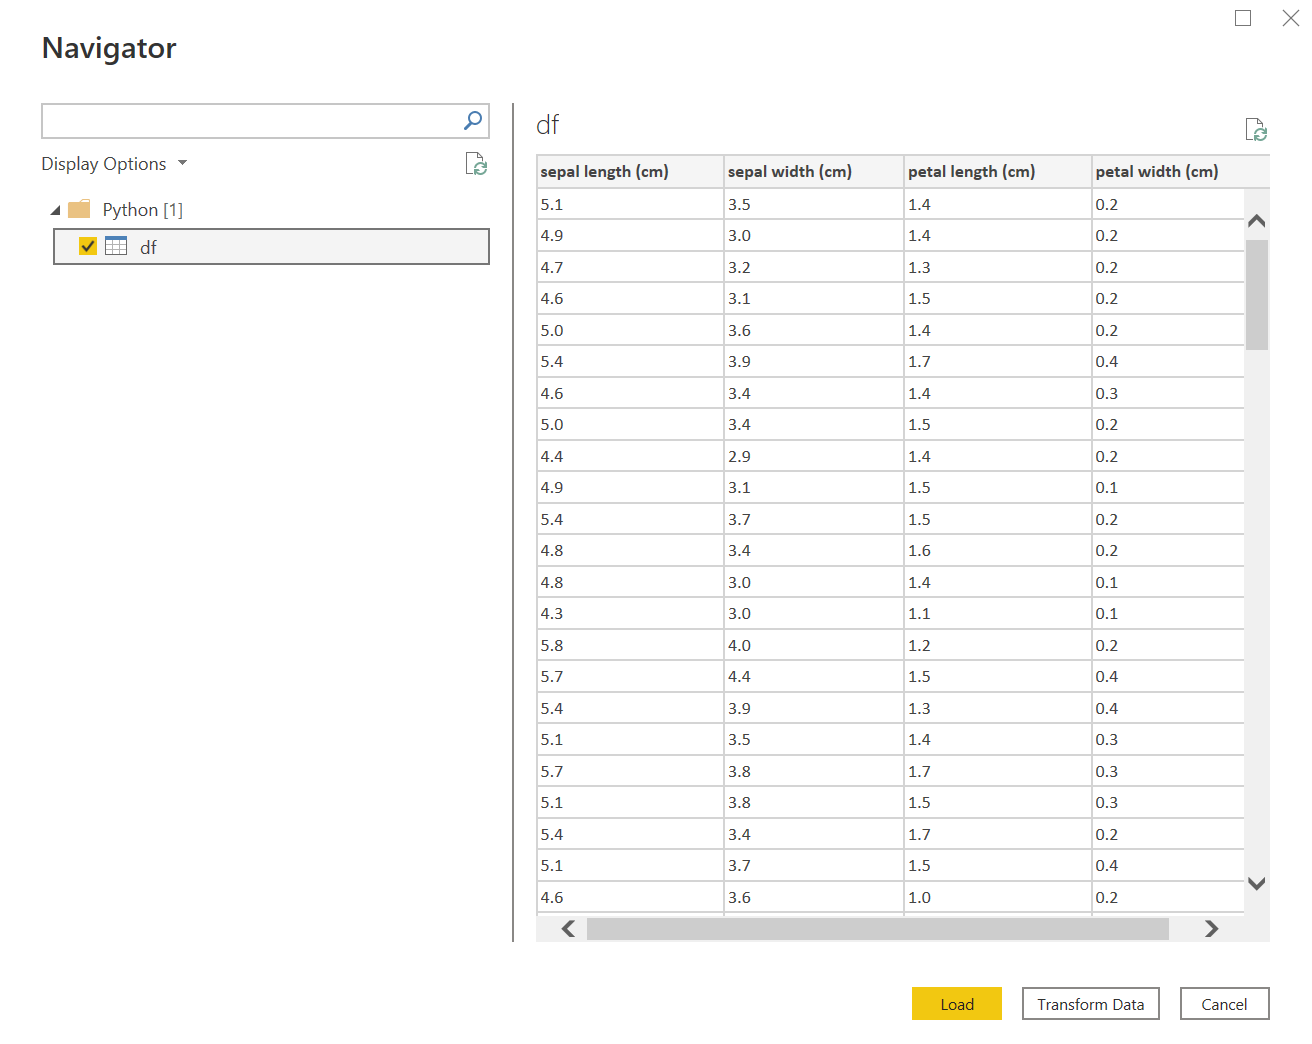
In the next window, select the table called ‘df’ which contains the data. This will now allow you to load this dataset to the data model just like any other data source in Power BI.
K-Means clustering is an unsupervised machine learning technique that allows you to find groups of data points that are similar to each other – these are the clusters. This technique is particularly useful to businesses in marketing and customer service to better understand their customers.
Power BI has the ability to perform cluster analysis on your data without the need for Python. However, it is somewhat restrictive in that it determines the number of clusters to split the data into and does not allow you to change it. This kind of situation makes Python the perfect solution, as you now have the flexibility to write a script according to your own requirements.
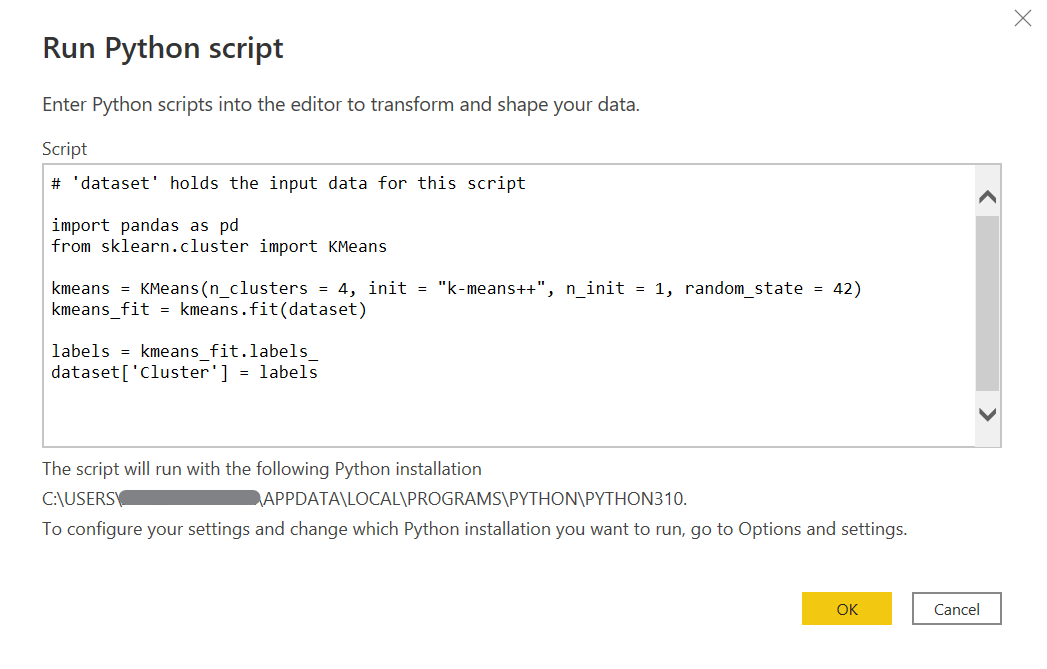
From within the Power Query Editor, select the Transform tab in the ribbon and then select ‘Run Python Script’. This brings up almost the same dialogue box we had when importing the dataset, except here, there is a placeholder for our current dataset called ‘dataset’.
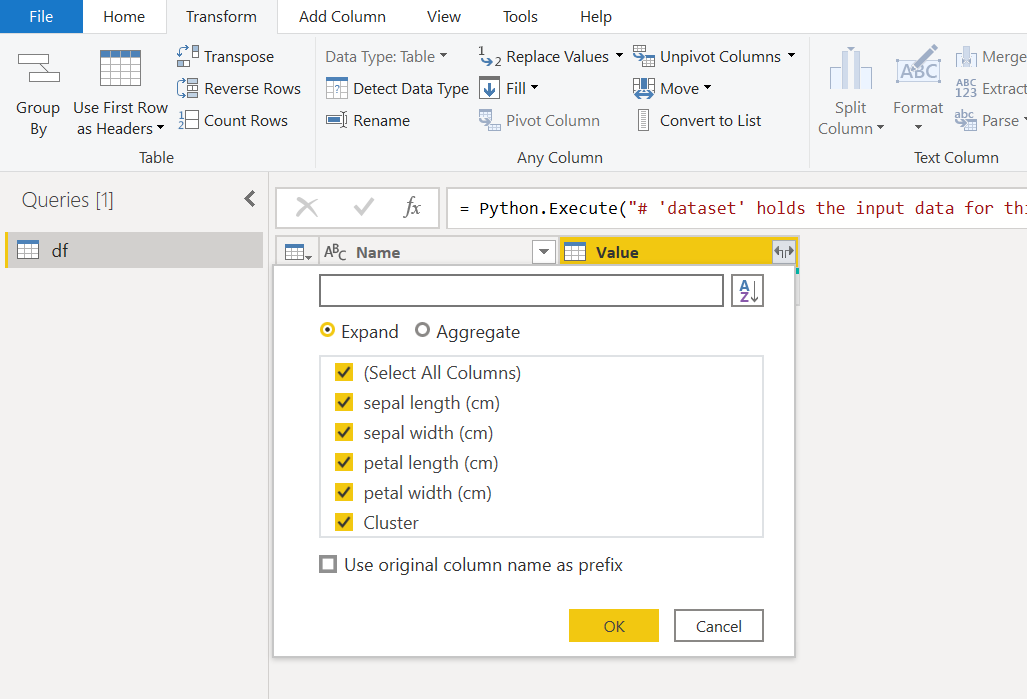
Selecting ‘OK’ will import a collapsed table. You now need to expand the Value column out to select which columns you would like to include in the query. Select all columns, including our new ‘Cluster’ column that was just created from the script above and be sure to uncheck the box that says ‘Use original column name as prefix'.
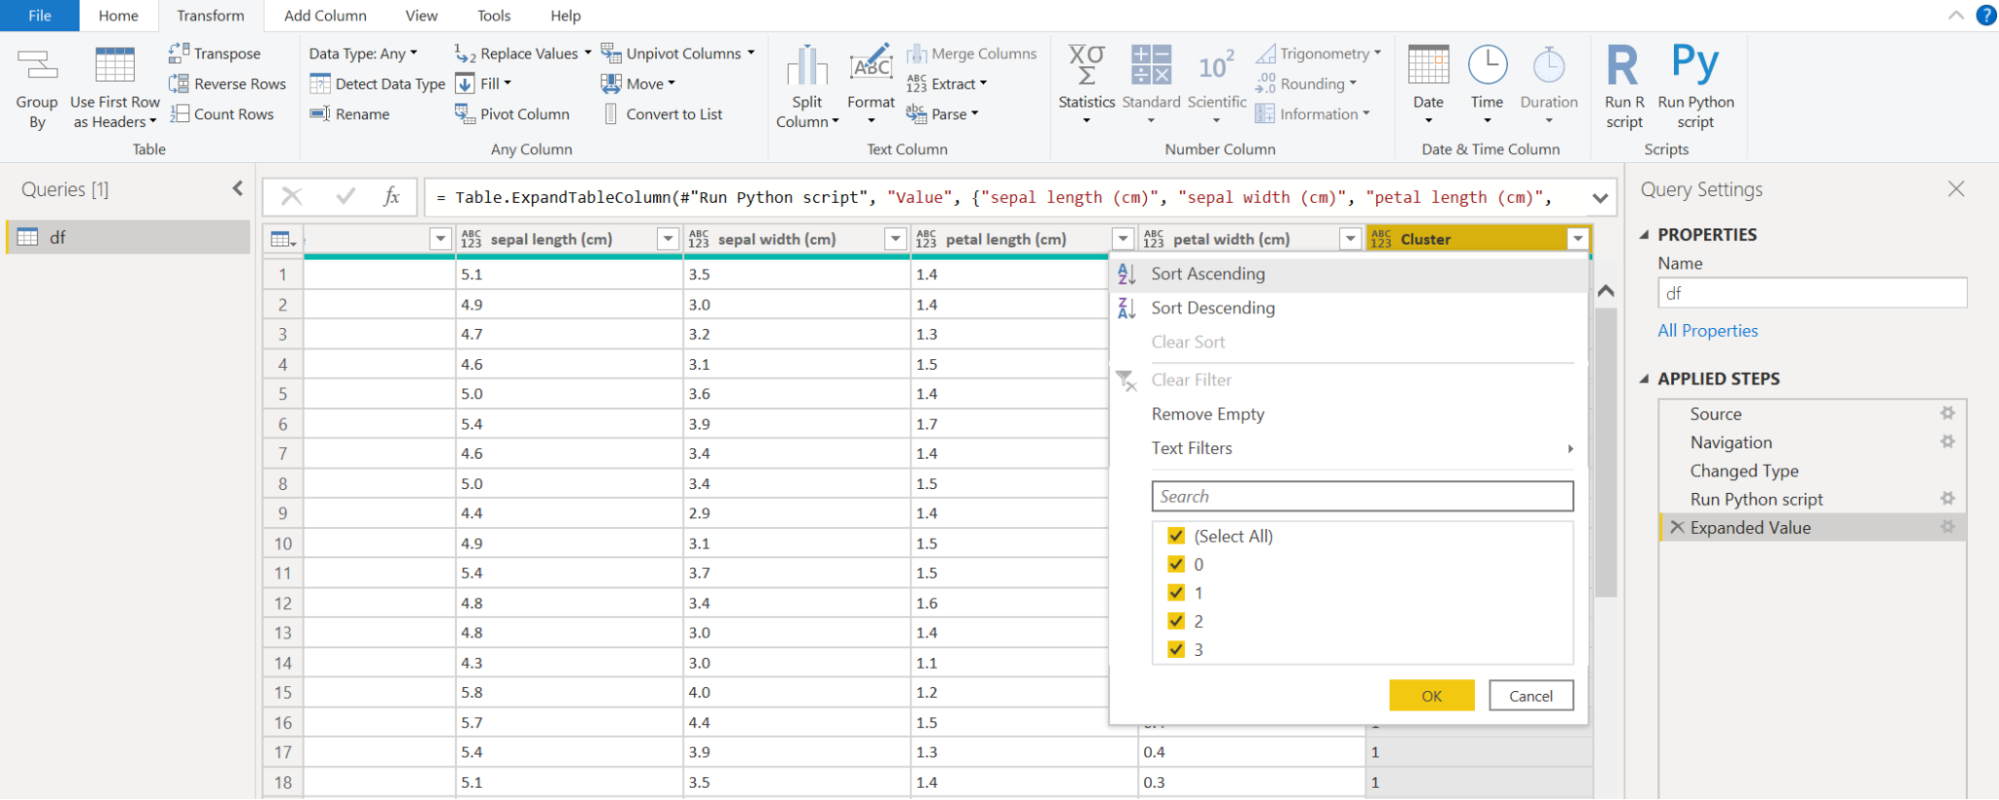
In the end, we are left with a dataset that contains all the original columns plus an additional column that shows the cluster to which each row of the data is assigned. In this example, we chose to split the data into 4 clusters, and so there should be cluster labels from 0 to 3.
This is just the tip of the iceberg for what is possible with Python and Power BI integration. If this tutorial has piqued your curiosity about getting the most out of Power BI, you might want to check out DataCamp’s Power BI Fundamentals skills track or the Data Analyst with Power BI career track.
Power BI Courses at DataCamp
Course
Course
Course
Tutorial
Parul Pandey
Tutorial
Abid Ali Awan
Tutorial
Jason Graham
Tutorial
Parul Pandey
Tutorial
Aditya Sharma
code-along
Nick Switzer