Course
Intermediate Data Visualization with Seaborn
4 hr
75K
Matplotlib is a powerful library for creating visualizations in Python. When using Jupyter Notebooks, DataLab, or other compatible environments, you can use Matplotlib inline to display Matplotlib plots directly within the notebook without the need for additional windows. For more on Matplotlib's capabilities, check out this tutorial on using the Matplotlib library.
Matplotlib inline is a backend command in Jupyter Notebooks that enables the rendering of Matplotlib plots directly below code cells. This means that when you execute code that generates Matplotlib plots, the plots are displayed inline within the notebook, rather than in a separate window or output cell.
This inline rendering can be useful when iterating through versions of a plot in a notebook. Since the graph appears directly below the code that generates it, it is easy to see how the changes to your code affect the result. You can use this while applying standard plot features, such as a title, axes labels, a legend, or color coding.
Beware, in some cases, you may run into memory leakage problems, an error where the memory is not freed between plotting events resulting in the figure being incorrectly plotted after changes. If you notice this as a problem, try using the .clf() and .close() methods to clear the memory from the previous plot before replotting.
Important note: In the current versions of Jupyter Notebook, using Matplotlib inline is not necessary as plots are displayed automatically. However, it is still useful to use especially when sharing code. So if you are using the latest version of Jupyter Notebook or are using DataLab, and don’t have code to share, you can skip this tutorial and jump into learning Matplotlib instead.
To enable Matplotlib inline mode in a Jupyter notebook, simply include the following command at the beginning of your notebook:
import matplotlib
%matplotlib inline
This command tells Jupyter to render Matplotlib plots directly in the notebook, as opposed to opening a new window or needing to save an external plot. Once enabled, you can proceed to create and display plots using Matplotlib as usual.

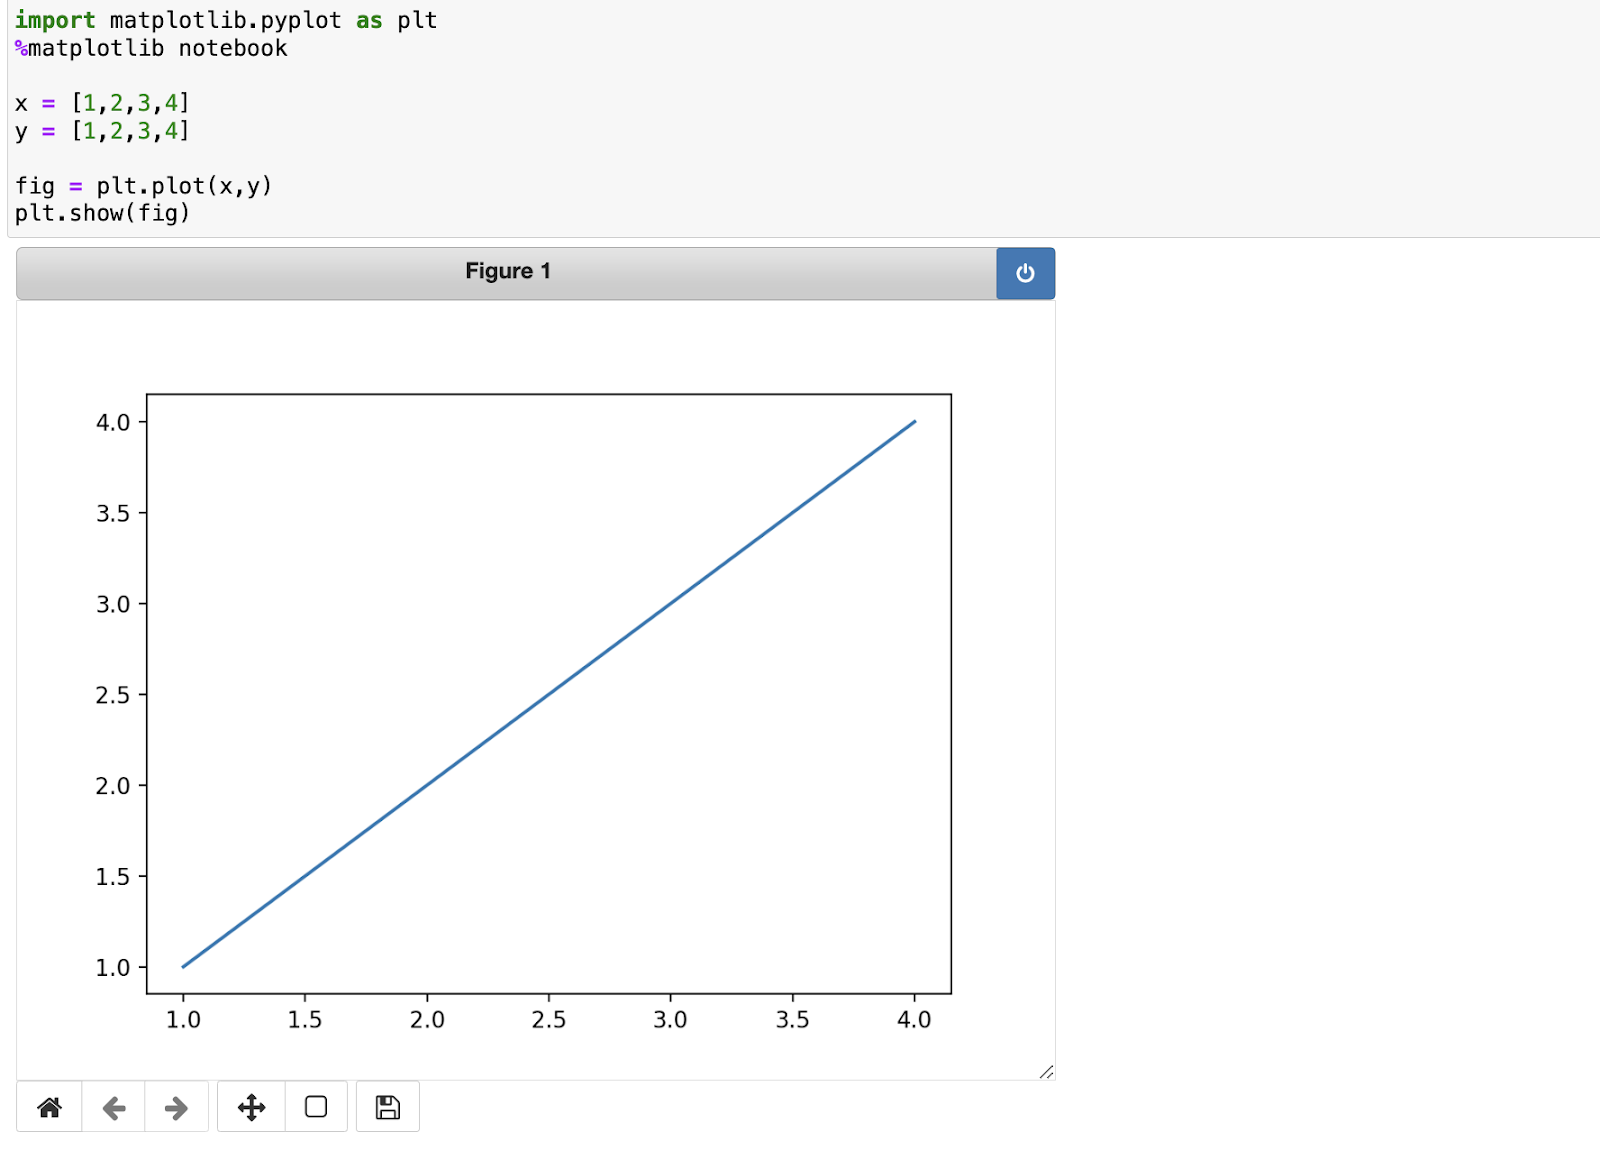
An example of %matplotlib inline in action on a Jupyter Notebook
As mentioned earlier, the latest versions of Jupyter Notebooks & IDEs like DataLab don’t require you to add %matplotlib inline to see plots within the same cell. However, I prefer to add this single line to the top of my scripts even when using such IDEs. It makes it easier to transfer the code between systems and team members. It also reduces the chances of an unexpected error if the IDE stops working the way you expect.
%matplotlib notebookIf you are looking for interactivity in your inline plots, try the %matplotlib notebook backend command. This command still makes your plots visible within the notebook, and adds some interactivity like zooming, panning, and data inspection. However, I have found this can be temperamental on some systems. If you have trouble with this magic command, I recommend using plotly.io instead for interactive, inline plots.
An example of %matplotlib notebook in action on a Jupyter Notebook
%matplotlib inline with Other Plotting LibrariesThe %matplotlib inline command is not limited to matplotlib plots. It integrates easily with other plotting libraries such as seaborn and plotly, expanding the breadth of plot types you can create inline in your notebook.
Using this command alongside the seaborn library expands the customization options for the plots.

An example of %matplotlib inline with seaborn in action on a Jupyter Notebook
Using this command alongside the plotly library enables interactivity, such as zooming and panning.

An example of %matplotlib inline with plotly in action on a Jupyter Notebook
Key Takeaway: Use the %matplotlib inline command to activate inline plotting in Jupyter notebooks. Pair this command with other plotting libraries to create powerful visualizations.
%matplotlib inlineWhen using %matplotlib inline, there are a few best practices to consider:
Matplotlib inline mode is a convenient feature that enhances the usability of Matplotlib in Jupyter notebooks. By enabling inline rendering of plots, it streamlines the workflow of creating, exploring, and communicating insights from data.
To learn more about data visualizations, check out Introduction to Data Visualizations with Matplotlib. Try building your advanced plots and visualizations in this Seaborn course and this tutorial on histograms in Matplotlib.
Continue Your Data Visualization Journey Today!
Course
Course
Course
blog
Karlijn Willems
11 min
cheat-sheet
Karlijn Willems
Tutorial
Kevin Babitz
Tutorial
Arunn Thevapalan
Tutorial
Aditya Sharma
Tutorial
Bekhruz Tuychiev