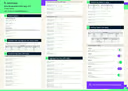
How to Subset Data in R: Select, Filter, and Extract Data
Learn how to subset data frames in R using brackets [], subset(), and dplyr. Includes code examples and a comparison of methods.
Updated May 21, 2026 · 6 min read
Almost every R data analysis project involves extracting specific rows, columns, or values from a larger dataset. Subsetting is how you do it in R, using bracket notation [] for low-level indexing control, the subset() function for readable condition-based filtering, or dplyr verbs like filter() and select() for modern data pipelines.
TL;DR
Use bracket notation df[rows, cols] for position-based subsetting of rows and columns
Use $ to extract a single column as a vector: df$column_name
Use subset(df, condition) for readable condition-based filtering in interactive sessions
Add drop = FALSE when selecting a single column to keep the result as a data frame
For production code and data pipelines, prefer bracket notation or dplyr::filter() over subset()
Selecting Rows
Here is an example of subsetting on a data frame called debt.
debt[3:6, ]
      name  payment
3      Dan      150
4      Rob       50
5      Rob       75
6      Rob      100
The syntax df[rows, columns] is the foundation of R subsetting. Here, 3:6 selects rows 3 through 6, and the empty space after the comma means "return all columns." The result is a smaller data frame with the same column structure as the original.
Your Path to Mastering R
Start from scratch and build core R skills for data science.
One behavior to watch for is the simplification that happens when you select a single column. Selecting the first three rows of just the payment column simplifies the result into a vector.
debt[1:3, 2]
100 200 150
The 2 here refers to the second column of debt, which is payment. Because we selected a single column, R drops the data frame structure and returns a plain numeric vector.
Dataframe formatting
To keep it as a dataframe, just add drop = FALSE as shown below:
debt[1:3, 2, drop = FALSE]
    payment
1       100
2       200
3       150
Selecting a specific column
You can also select a single column with the $ operator by writing dataframe$column. The following example extracts the payment column from debt. R returns the result as a vector rather than a data frame.
debt$payment
100 200 150 50 75 100
Using the subset() Function
When looking to create more complex subsets or a subset based on a condition, the next step up is to use the subset() function. For example, what if you wanted to look at debt from someone named Dan. You could just use the brackets to select their debt and total it up, but it isn't a very robust way of doing things, especially with potential changes to the dataset.
# This works, but is not informative
debt[1:3, ]
subset() on a categorical variable
A better way to do this is to use the subset() function to select the rows where the name column is equal to Dan. Notice that there needs to be a double equals sign (==), known as a relational operator.
# This works, but is not informative nor robust
debt[1:3, ]

# Much more informative!
subset(debt, name == "Dan")
      name     payment
1      Dan         100
2      Dan         200
3      Dan         150
The result contains only the three rows where name equals "Dan". Notice that the original row numbers (1, 2, 3) are preserved, which helps you trace results back to the source data frame.
subset() on a numeric variable
We can also subset on numeric columns. If we wanted to see rows where payments equal $100, you would do the following:
subset(debt, payment == 100)
      name  payment
1      Dan      100
6      Rob      100
Two rows match the condition: row 1 (Dan) and row 6 (Rob) both have payments of exactly $100. This shows that subset() scans every row regardless of the name, returning all matches.
Accessing and Subsetting Dataframes
What if you need only the cash flows from company A? Here the subset() function filters rows from a different data frame, cash:
subset(cash, company == "A")
      company  cash_flow  year
1           A       1000     1
2           A       4000     3
3           A        550     4
Remember:
The first argument you pass to subset() is the name of your dataframe, cash.
Notice that you shouldn't put company in quotes!
The == is the equality operator. It tests to find where two things are equal and returns a logical vector.
Interactive Example of the subset() Method
In the following example, we use subset() to select rows of cash corresponding to company B, then filter for cash flows due in 1 year.
# Rows about company B
subset(cash, company == "B")

# Rows with cash flows due in 1 year
subset(cash, year == 1)
When you run the above code, it produces the following result:
  company cash_flow year
4       B      1500    1
5       B      1100    2
6       B       750    4
7       B      6000    5
The tidyverse package dplyr provides a modern alternative for subsetting data frames. Its filter() function selects rows and select() picks columns, both using a pipe-based syntax that chains operations together.
library(dplyr)

# Filter rows where name is "Dan"
debt %>% filter(name == "Dan")

# Select only the payment column (stays as a data frame)
debt %>% select(payment)

# Combine: filter rows and select columns in one pipeline
debt %>%
  filter(payment >= 100) %>%
  select(name, payment)
Unlike subset(), dplyr functions work reliably inside other functions and handle grouped operations, joins, and summaries in the same pipeline. If you're building data analysis workflows rather than running one-off queries, dplyr is the standard tool.
Comparison of Subsetting Methods
Let's compare the different subsetting methods in R in a table:
Method
Syntax
Best for
Notes
Brackets []
df[rows, cols]
Low-level control, programming
Works on all R objects
$
df$col
Quick single-column extraction
Returns a vector, not a data frame
subset()
subset(df, cond)
Interactive filtering
Not recommended inside functions
dplyr::filter()
df %>% filter(cond)
Data pipelines, readable code
Requires the dplyr package
Final Thoughts
R gives you several ways to subset data: bracket notation [] for full control, subset() for readable interactive filtering, and dplyr::filter() for data pipelines. Brackets work on any R object, subset() reads clearly for one-off exploration, and dplyr scales well when you're chaining multiple operations.
What is the difference between subset() and dplyr::filter() in R?
Both functions filter rows based on conditions, but they behave differently in programming contexts. subset() uses non-standard evaluation, which makes it convenient for interactive use but unreliable inside user-defined functions. dplyr::filter() is designed to work safely inside functions and integrates with the pipe operator (%>%) for chaining multiple data manipulation steps together.
How do I subset multiple columns at once in R?
You can pass a vector of column names or indices inside brackets. For example, df[, c("name", "payment")] selects two columns by name, while df[, c(1, 3)] selects them by position. With dplyr, you can use select(df, name, payment) or helper functions like starts_with() and contains() to match columns by pattern.
Why does selecting a single column in R return a vector instead of a data frame?
R simplifies the result by default when only one column is selected using bracket notation. This behavior is controlled by the drop parameter, which defaults to TRUE. To keep the result as a data frame, add drop = FALSE to your bracket expression, for example, df[, 2, drop = FALSE].
Can I subset rows based on multiple conditions in R?
Yes. You can combine conditions using & (AND) and | (OR) operators. For example, subset(df, name == "Dan" & payment > 100) returns rows where the name is Dan and the payment exceeds 100. With dplyr, you can separate conditions with commas inside filter(): df %>% filter(name == "Dan", payment > 100).
Learn about several useful functions for data structure manipulation, nested-lists, regular expressions, and working with times and dates in the R programming language.