
Track
Machine Learning Engineer
44 hr
The concept of cross-entropy traces its roots back to the field of information theory, where information entropy, also known as Shannon entropy, was formally introduced in 1948 by Claude Shannon in a paper titled “A Mathematical Theory of Communication.” Before we tackle cross-entropy, let’s deal with entropy.
Entropy calculates the degree of randomness or disorder within a system. In the context of information theory, the entropy of a random variable is the average uncertainty, surprise, or information inherent to the possible outcomes. To put things simply, it measures the uncertainty of an event.
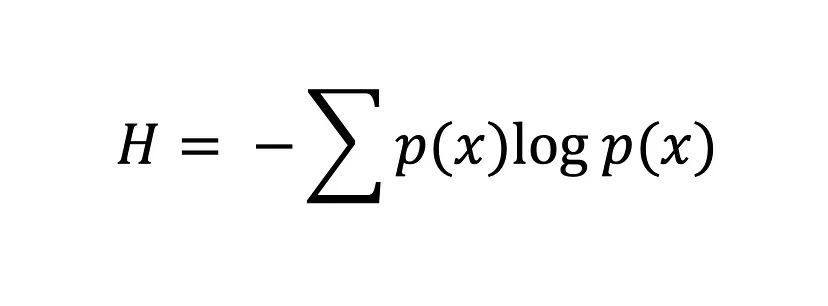
The Shannon entropy equation
The greater the value of entropy, H(x), the greater the uncertainty for the probability distribution, and the smaller the value, the less uncertainty.
Cross-entropy, also known as logarithmic loss or log loss, is a popular loss function used in machine learning to measure the performance of a classification model.
It measures the average number of bits required to identify an event from one probability distribution, p, using the optimal code for another probability distribution, q. In other words, cross-entropy measures the difference between the discovered probability distribution of a classification model and the predicted values.
The cross-entropy loss function is used to find the optimal solution by adjusting the weights of a machine learning model during training. The objective is to minimize the error between the actual and predicted outcomes. A lower cross-entropy value indicates better performance. This optimization happens through gradient descent, where the gradients of the loss function guide parameter updates.
If you’re familiar with Kullback-Leibler (KL) Divergence, you may wonder, “What’s the difference between cross-entropy and KL divergence?” And that’s a fair question. Both concepts are widely used to measure probability distributions' differences or similarities. Although they share some similarities, they serve different purposes.
As mentioned above, cross-entropy measures the average number of bits required to identify an event from one probability distribution, P, using the optimal code for another probability distribution, Q, and is typically used in machine learning to evaluate the performance of a model where the objective is to minimize the error between the predicted probability distribution and true distribution.
In contrast, KL divergence measures the difference between two probability distributions, P and Q. Namely, KL divergence quantifies the amount of information loss when Q is used to approximate P. This is incredibly useful in unsupervised learning tasks where the objective is to uncover structure in data by minimizing the divergence between the true and learned data distributions.
In machine learning, loss functions help models determine how wrong it is and improve itself based on that wrongness. They are mathematical functions that quantify the difference between predicted and actual values in a machine learning model, but this isn’t all they do.
The measure of error from a loss function also serves as a guide during the optimization process by providing feedback to the model on how well it fits the data. Hence, most machine learning models implement a loss function during the optimization phase, where the model parameters are chosen to help the model minimize the error and arrive at an optimal solution – the smaller the error, the better the model.
We can measure the error between two probability distributions using the cross-entropy loss function. For example, let’s assume we’re conducting a binary classification task (a classification task with two classes, 0 and 1).
In this instance, we must use binary cross-entropy, which is the average cross-entropy across all data samples:
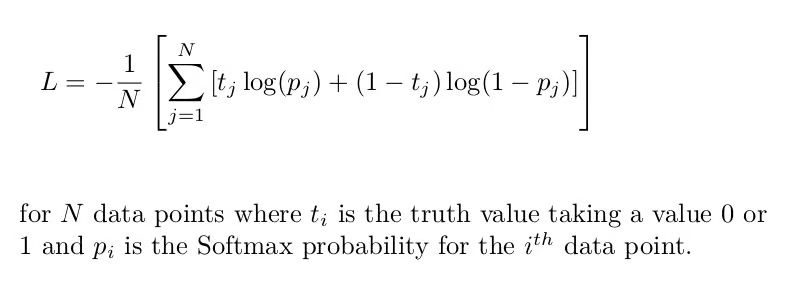
Binary cross entropy formula [Source: Cross-Entropy Loss Function]
If we were to calculate the loss of a single data point where the correct value is y=1, here’s how our equation would look:
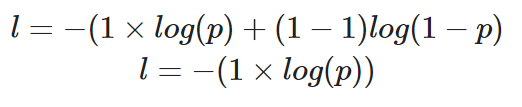
Calculating the binary cross-entropy for a single instance where the true value is 1
The predicted probability, p, determines the value of loss, l. If the value of p is high, the model will be rewarded for making a correct prediction - this will be illustrated with a low value of loss, l.
However, a low predicted probability, p, would infer the model was incorrect, and the binary cross-entropy loss function will reflect this by making the value of l higher.
For a multi-class classification task, cross-entropy (or categorical cross-entropy as it is often referred to) can be extended as follows. In this case, the output layer typically uses a softmax activation function to produce a probability distribution across all classes:
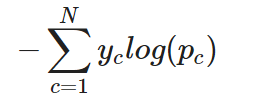
Categorical cross-entropy for a single instance
In other words, to apply cross-entropy to a multi-class classification task, the loss for each class is calculated separately and then summed to determine the total loss.
Cross-entropy loss is the standard choice for classification tasks, but understanding when to use each variant helps you build better models:
| Loss Function | Use Case | Output Activation | Example |
|---|---|---|---|
| Binary Cross-Entropy | Two classes (0 or 1) | Sigmoid | Spam detection, medical diagnosis |
| Categorical Cross-Entropy | Multiple mutually exclusive classes | Softmax | Image classification, sentiment analysis |
| Binary Cross-Entropy (multi-label) | Multiple labels per sample | Sigmoid (per output) | Image tagging, document categorization |
In this part of the tutorial, we will learn how to use the cross-entropy loss function in TensorFlow and PyTorch.
Let’s start by creating the dataset. We will use Scikit learns make_classification function to help us:
import numpy as np
import matplotlib.pyplot as plt
from sklearn.datasets import make_classification
from sklearn.model_selection import train_test_split

# Create training data
X, y = make_classification(
    n_samples=10000,
    n_informative=10,
    random_state=2022
)

# split into train and test
X_new, X_test = X[:9000, :], X[9000:, ]
y_new, y_test = y[:9000], y[9000:]

X_train, X_val, y_train, y_val = train_test_split(
    X_new, y_new,
    test_size=0.3
)
print(f"Train data: {X_train.shape}\n\
Train labels: {y_train.shape}\n\
Test data: {X_test.shape}\n\
Test labels: {y_test.shape}")

"""
Train data: (6300, 20)
Train labels: (6300,)
Test data: (1000, 20)
Test labels: (1000,)
"""The model we will build will consist of an input layer, a hidden layer, and an output layer.
Since this is a binary classification task, we will use binary cross-entropy as our loss function. The output layer uses a sigmoid activation function to produce probabilities between 0 and 1.
import tensorflow as tf

# Build and train model
model = tf.keras.Sequential([
                            tf.keras.layers.Dense(10,
                                                  input_shape=(X_train.shape[1],),
                                                  activation="relu"),
                            tf.keras.layers.Dense(10,
                                                  activation="relu"),
                            tf.keras.layers.Dense(1, activation="sigmoid")
])

model.compile(
    loss="binary_crossentropy", # loss function here
    optimizer="adam",
    metrics=["accuracy"])

history = model.fit(X_train, y_train, epochs=20, validation_data=[X_val, y_val], verbose=0)
Next, we will plot the loss to see whether the model is improving – meaning the error decreases with each epoch until it can no longer improve.
# plotting the loss of the models
fig, ax = plt.subplots(figsize=(8,5))
plt.plot(history.history['loss'])
plt.plot(history.history['val_loss'])
plt.title('model loss')
plt.ylabel('loss')
plt.xlabel('epoch')
plt.xticks(np.arange(0,20, step=1))
plt.legend(['train', 'test'], loc='upper right')
plt.show()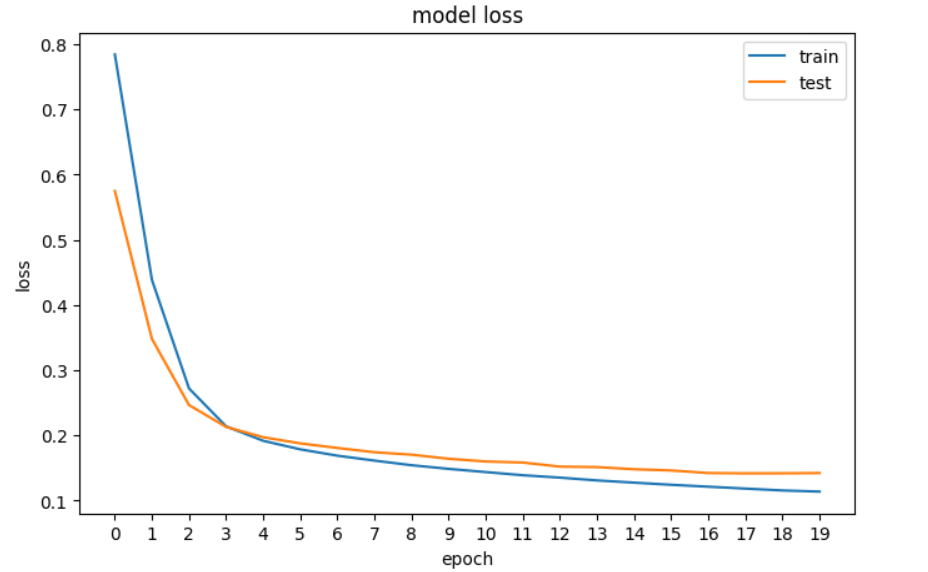
A plot of the loss of our neural network in TensorFlow.
In PyTorch, inputs, outputs, and parameters of the model are encoded using tensors, which means we must convert our Numpy arrays to tensors. That’s the first thing we do in the code below, and then we build the neural network and print its dimensions.
import torch
import torch.nn as nn
import torch.optim as optim

# Convert numpy arrays to tensors
X_train_tensor = torch.tensor(X_train, dtype=torch.float32)
X_val_tensor = torch.tensor(X_val, dtype=torch.float32)
y_train_tensor = torch.tensor(y_train, dtype=torch.float32).reshape(-1, 1)
y_val_tensor = torch.tensor(y_val, dtype=torch.float32).reshape(-1, 1)

# Build the model
input_dim = X_train.shape[1]
hidden_dim = 10
output_dim = 1

model = nn.Sequential(
    nn.Linear(input_dim, hidden_dim),
    nn.ReLU(),
    nn.Linear(hidden_dim, hidden_dim),
    nn.ReLU(),
    nn.Linear(hidden_dim, output_dim),
    nn.Sigmoid()
)

print(model)

"""
Sequential(
  (0): Linear(in_features=20, out_features=10, bias=True)
  (1): ReLU()
  (2): Linear(in_features=10, out_features=10, bias=True)
  (3): ReLU()
  (4): Linear(in_features=10, out_features=1, bias=True)
  (5): Sigmoid()
)
"""
Next, we define the binary cross-entropy loss function and optimizer:
loss_fn = nn.BCELoss()  # binary cross entropy
optimizer = optim.Adam(model.parameters(), lr=0.001)
Now we need to train the model. Here’s the training loop:
# Training loop
n_epochs = 20
train_loss = []
val_loss = []

for epoch in range(n_epochs):
    # Training
    model.train()
    y_pred = model(X_train_tensor)
    loss = loss_fn(y_pred, y_train_tensor)

    optimizer.zero_grad()
    loss.backward()
    optimizer.step()
    train_loss.append(loss.item())

    # Validation
    model.eval()
    with torch.no_grad():
        y_val_pred = model(X_val_tensor)
        v_loss = loss_fn(y_val_pred, y_val_tensor)
        val_loss.append(v_loss.item())
And now to plot the loss:
# plotting the loss of the models
fig, ax = plt.subplots(figsize=(8,5))
plt.plot(train_loss)
plt.plot(val_loss)
plt.title('model loss')
plt.ylabel('loss')
plt.xlabel('epoch')
plt.xticks(np.arange(0,20, step=1))
plt.legend(['train', 'test'], loc='upper right')
plt.show()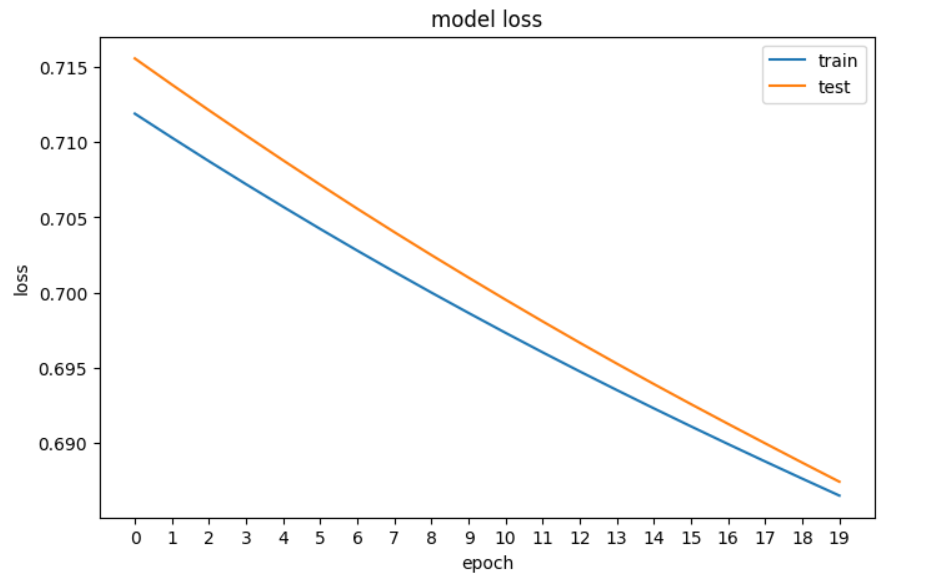
A plot of the loss of our Neural network in PyTorch
Here’s a quick recap of what we’ve learned about cross-entropy loss:
To continue your learning, check out our resources:
Start Your Machine Learning Journey Today!
Track
Track
Course
Tutorial
Richmond Alake
Tutorial
Rajesh Kumar
Tutorial
Dario Radečić
Tutorial
Mark Pedigo
Tutorial
DataCamp Team
Tutorial
Sejal Jaiswal
