
Cours
Statistical Thinking in Python (Part 1)
3 h
186.5K
The sample standard deviation is a statistical measure used to quantify the variation within a dataset. Specifically, it tells us how much individual data points in a sample differ from the sample mean.
Sample standard deviation is important in inferential statistics if you want to draw conclusions about a given population or, as statisticians might put it, to make inferences from a sample to a population. To understand these distinctions, I recommend taking DataCamp’s Introduction to Statistics and Basic Statistics courses to familiarize yourself with statistics concepts. As a final note, if you are serious about statistics and interested in a career using statistics, check out DataCamp’s guide on How to Become a Statistician.
The sample standard deviation is a statistical measure that quantifies the variation or dispersion in a dataset. The sample standard deviation is calculated as the square root of the sample variance, where the sample variance is the sum of the squared differences from the mean, divided by the sample size minus one. We use the sample standard deviation when we want to know how much the data points in a sample differ from the sample mean.
We use a specific formula when calculating the sample standard deviation.
Here is the sample standard deviation formula:
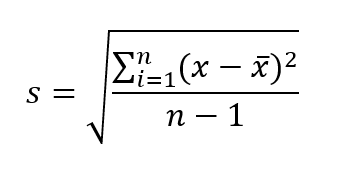
Sample standard deviation formula. Image by Author.
Where:
Note that when calculating the sample standard deviation, we use n-1 in the denominator to correct the sample bias. This is known as Bessel’s correction. If we were interested in the population standard deviation, we would use n in the denominator instead.
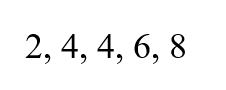
Let us walk through the following example to see how to calculate the sample standard deviation using the formula. Assume you have a data subset with the following values:
You should follow these steps:
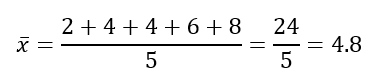
Find the mean of the data points.
Subtract the mean and square the result for each data point
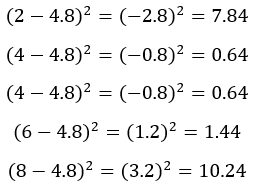
Add the squared differences from the mean.
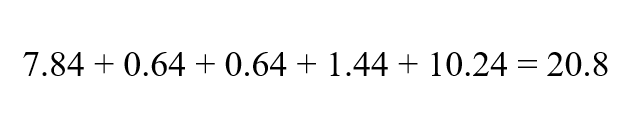
Substitute the values in the formula to get the sample standard deviation.
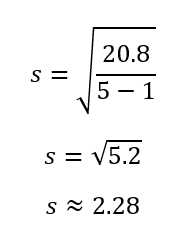
From the above calculation, we see that the standard deviation for the data is approximately 2.28. Now, if calculating the sample standard deviation by hand is not practical or helpful, and you need to use a tool like Excel, check out our tutorial on How to Calculate Standard Deviation in Excel.
Sample standard deviation is a preferred measure of variability when an estimate of the population standard deviation is needed based on a sample. Bessel's correction (n−1) in the formula adjusts the bias and improves the estimate's accuracy since the sample may not perfectly represent the population. Making the denominator smaller increases the calculated variance and standard deviation. This compensates for the tendency of smaller samples to underestimate variability.
The sample standard deviation is important in estimating population parameters. Let's take a look.
Confidence intervals can be calculated using either the sample standard deviation or the population standard deviation, depending on which is available. If the population standard deviation is unknown, the sample standard deviation is used, and a t-distribution is applied to estimate the range of values likely to contain the population mean. A smaller standard deviation from the sample or population leads to a narrower confidence interval, indicating greater precision in the estimate.
In hypothesis testing, either the sample standard deviation or the population standard deviation can be used, depending on which is known. If the population standard deviation is unknown, the sample standard deviation is applied, and the t-distribution is typically used to evaluate the test statistic. When the population standard deviation is known, the z-distribution is used instead, providing more precision. A smaller standard deviation, whether from the sample or population, results in a more sensitive test, making it easier to detect significant differences.
Let’s take a look at some of the terms that are related to sample standard deviation. Confusing these terms can lead to common mistakes.
Sample standard deviation and variance both measure variability in a dataset. However, they express variability differently. The variance of a dataset measures the average of the squared differences between each data point and the mean. Thus, the variance is expressed in squared units. On the other hand, the standard deviation is calculated as the square root of the variance, so the standard deviation is expressed in the same units as the data.
Let's take a look at two scenarios to help differentiate between sample standard deviation and population standard deviation.
The sample standard deviation is used when you use a subset of a large population. Imagine you are conducting a customer satisfaction survey for a retail company. You collect responses from about 200 customers to make inferences about the satisfaction of the retail chain's customer base. In this case, you will use the sample standard deviation for inferences since you are working with a subset of a large population.
The population standard deviation is appropriate when you have the complete data for an entire population. In this case, you will not need to account for the bias since every data point would be accounted for. Now, imagine you are the HR of a company with 50 employees and want to calculate the variability of their salaries. You will use the population standard deviation since you know the salary for each employee.
When using R to calculate standard deviation, the sd() function computes the sample standard deviation by default with n−1 in the denominator.
# Sample standard deviation
data <- c(10, 12, 15, 18, 20)
sample_sd <- sd(data)
print(round(sample_sd, 2))4.12However, Python packages like NumPy and Pandas assume population standard deviation unless otherwise specified. For example, numpy.std() uses n in the denominator by default, treating the data as a population.
# Import numpy library
import numpy as np
data = [10, 12, 15, 18, 20]
population_sd = np.std(data)  # Population standard deviation
print(round(population_sd, 2))3.69If you want the sample standard deviation instead, you can pass ddof=1 to adjust for degrees of freedom.
sample_sd = np.std(data, ddof=1)  # Sample standard deviation
print(round(sample_sd, 2))4.12If you are working with statistics in a programming environment, I would recommend our Statistical Inference with R skill track or the Foundations of Inference in Python course to develop a core set of skills.
Sample standard deviation is an important statistical measure for quantifying variation and making inferences. If you want to advance your knowledge in statistics and data analysis, I recommend checking out DataCamp’s Data Analyst with R and Data Analyst with Python career tracks, which offer comprehensive, industry-relevant skills. Our Data Analysis in Excel course is also suitable if you want to become a business analyst focused on making data-driven decisions.
Learn Statistics with DataCamp
Cours
Cours
Cours
blog
Richie Cotton
6 min
cheat-sheet
Richie Cotton
Tutoriel
Arunn Thevapalan
Tutoriel
Arunn Thevapalan
Tutoriel
Bex Tuychiev
Tutoriel
Josef Waples