Course
Hypothesis testing is a key part of statistics that helps you make informed decisions in a wide range of fields- everything from medicine to economics to social sciences. This guide will walk you through the core concepts, types, steps, and real-world applications of hypothesis testing, ensuring you can confidently interpret and present your statistical findings.
If you're ready to learn more about hypothesis testing, select the course that matches your preferred technology: Hypothesis Testing in Python, Hypothesis Testing in R, or Introduction to Statistics in Google Sheets. Also, take our Introduction to Statistics course, which is technology-agnostic.
What is Hypothesis Testing?
Hypothesis testing is a statistical procedure used to test assumptions or hypotheses about a population parameter. It involves formulating a null hypothesis (H0) and an alternative hypothesis (Ha), collecting data, and determining whether the evidence is strong enough to reject the null hypothesis.
The primary purpose of hypothesis testing is to make inferences about a population based on a sample of data. It allows researchers and analysts to quantify the likelihood that observed differences or relationships in the data occurred by chance rather than reflecting a true effect in the population.
Steps of Hypothesis Testing
Let’s walk through how to do a hypothesis test, one step at a time.
Step 1: State your hypotheses
The first step is to formulate your research question into two competing hypotheses:
- Null Hypothesis (H0): This is the default assumption that there is no effect or difference.
- Alternative Hypothesis (Ha): This is the hypothesis that there is an effect or difference.
For example:
- H0: The mean height of men is equal to the mean height of women.
- Ha: The mean height of men is not equal to the mean height of women.
Step 2: Collect and prepare data
Gather data through experiments, surveys, or observational studies. Ensure the data collection method is designed to test the hypothesis and is representative of the population. This step often involves:
- Defining the population of interest.
- Selecting an appropriate sampling method.
- Determining the sample size.
- Collecting and organizing the data.
Step 3: Choose the appropriate statistical test
Select a statistical test based on the type of data and the hypothesis. The choice depends on factors such as:
- Data type (continuous, categorical, etc.)
- Distribution of the data (normal, non-normal)
- Sample size
- Number of groups being compared
Common tests include:
-
t-tests (for comparing means)
-
chi-square tests (for categorical data)
-
ANOVA (for comparing means of multiple groups)
Step 4: Calculate the test statistic and p-value
Use statistical software or formulas to compute the test statistic and corresponding p-value. This step quantifies how much the sample data deviates from the null hypothesis.
The p-value is an important concept in hypothesis testing. It represents the probability of observing results as extreme as the sample data, assuming the null hypothesis is true.
Step 5: Make a decision
Compare the p-value to the predetermined significance level (α), which is typically set at 0.05. The decision rule is as follows:
- If p-value ≤ α: Reject the null hypothesis, suggesting evidence supports the alternative hypothesis.
- If p-value > α: Fail to reject the null hypothesis, suggesting insufficient evidence to support the alternative hypothesis.
It's important to note that failing to reject the null hypothesis doesn't prove it's true; it simply means there's not enough evidence to conclude otherwise.
Step 6: Present your findings
Report the results, including the test statistic, p-value, and conclusion. Discuss whether the findings support the initial hypothesis and their implications. When presenting results, consider:
- Providing context for the study.
- Clearly stating the hypotheses.
- Reporting the test statistic and p-value.
- Interpreting the results in plain language.
- Discussing the practical significance of the findings.
Types of Hypothesis Tests
Hypothesis tests can be broadly categorized into two main types:
Parametric tests
Parametric tests assume that the data follows a specific probability distribution, typically the normal distribution. These tests are generally more powerful when the assumptions are met. Common parametric tests include:
- t-tests (one-sample, independent samples, paired samples)
- ANOVA (one-way, two-way, repeated measures)
- Z-tests (one-sample, two-sample)
- F-tests (one-way, two-way)
Non-parametric tests
Non-parametric tests don't assume a specific distribution of the data. They are useful when dealing with ordinal data or when the assumptions of parametric tests are violated. Examples include:
- Mann-Whitney U test
- Wilcoxon signed-rank test
- Kruskal-Wallis test
Selecting the appropriate test
When choosing a hypothesis test, researchers consider a few broad categories:
- Data Distribution: Determine if your data is normally distributed, as many tests assume normality.
- Number of Groups: Identify how many groups you're comparing (e.g., one group, two groups, or more).
- Group Independence: Decide if your groups are independent (different subjects) or dependent (same subjects measured multiple times).
- Data Type:
- Continuous (e.g., height, weight),
- Ordinal (e.g., rankings),
- Nominal (e.g., categories without order).
Based on these categories, you can select the appropriate statistical test. For instance, if your data is normally distributed and you have two independent groups with continuous data, you would use an Independent t-test. If your data is not normally distributed with two independent groups and ordinal data, a Mann-Whitney U test is recommended.
To help choose the appropriate test, consider using a hypothesis test flow chart as a general guide:
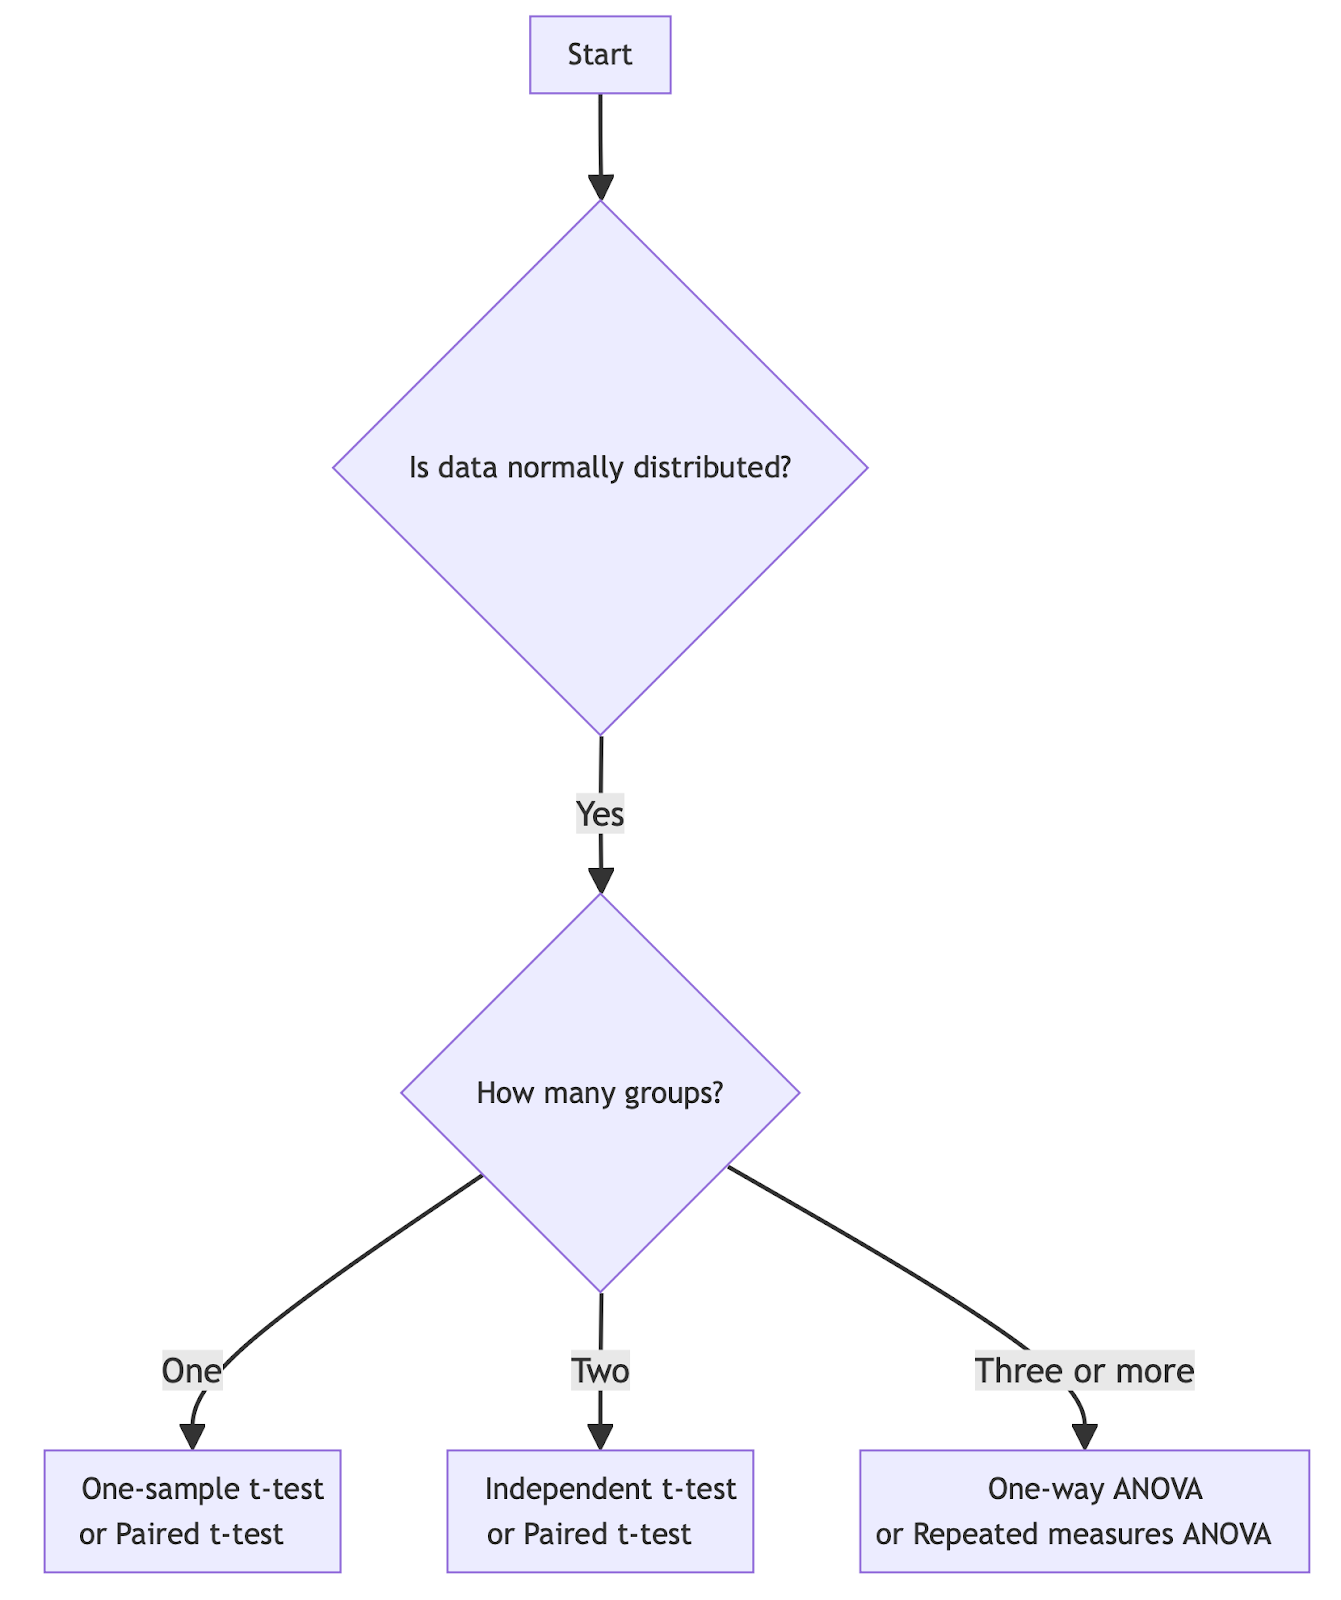
Choosing the right hypothesis test for normally distributed data. Image by Author.
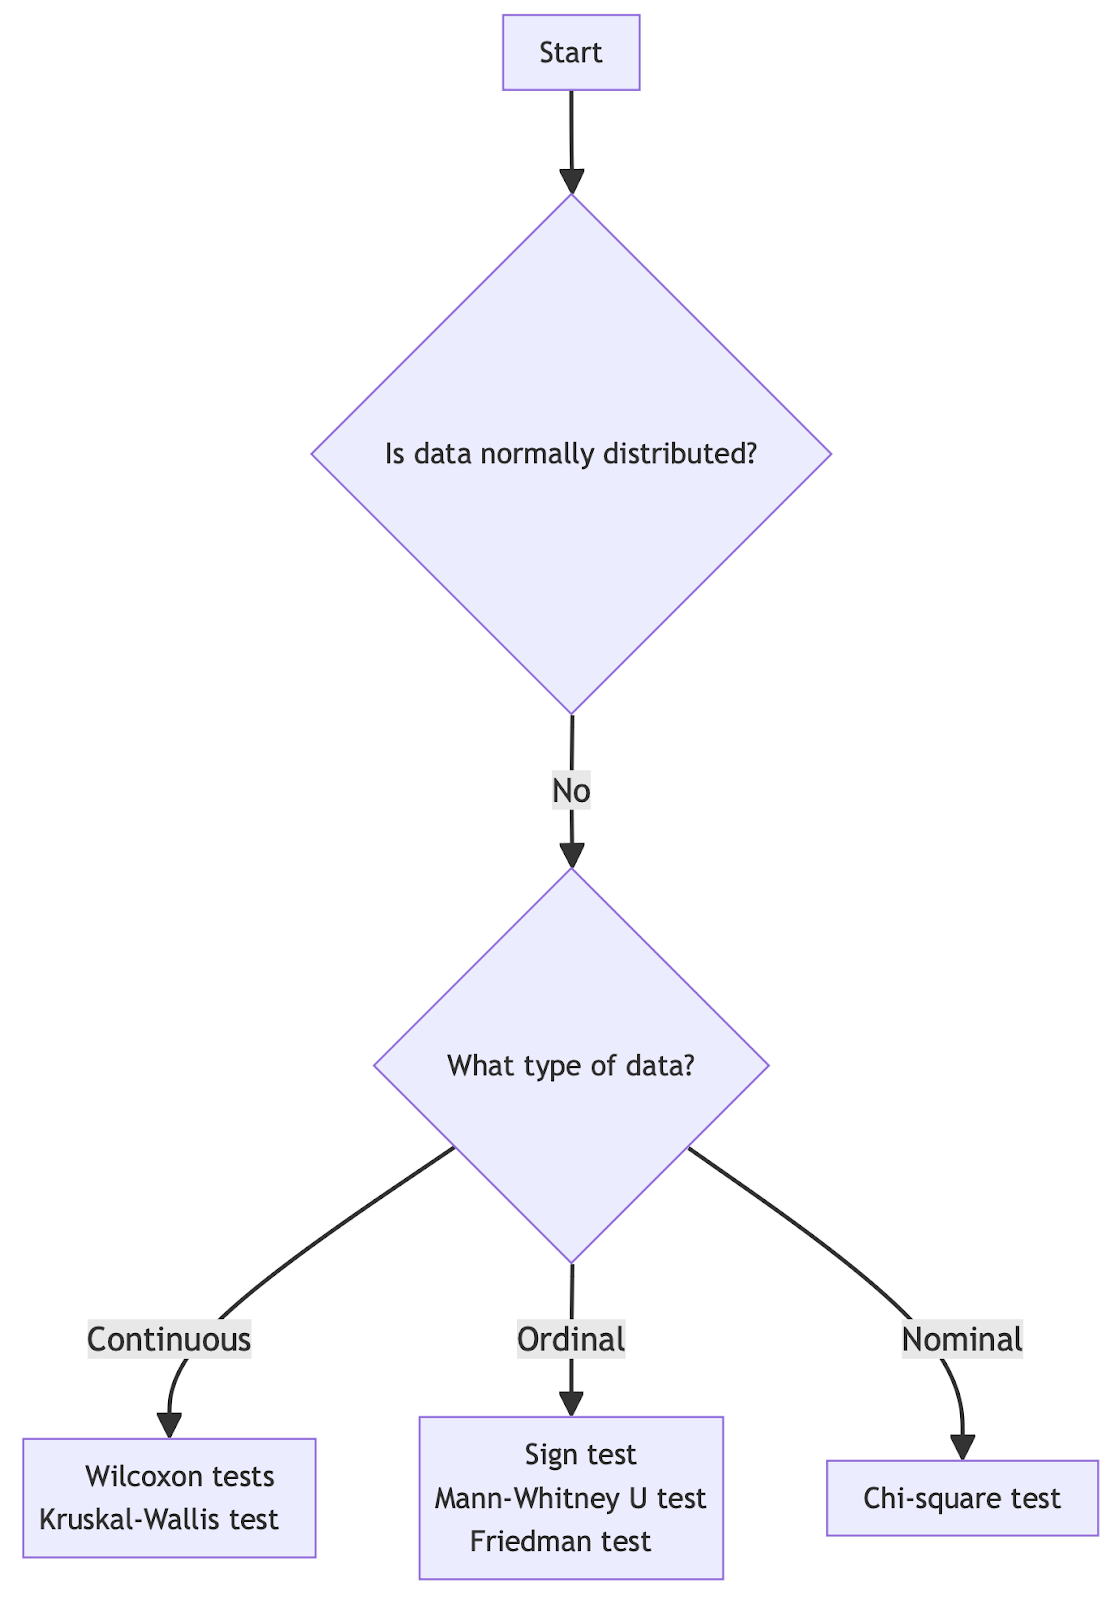
Choosing the right hypothesis test for non-normally distributed data. Image by Author.
Modern Approaches to Hypothesis Testing
In addition to traditional hypothesis testing methods, there are several modern approaches:
Permutation or randomization tests
These tests involve randomly shuffling the observed data many times to create a distribution of possible outcomes under the null hypothesis. They are particularly useful when dealing with small sample sizes or when the assumptions of parametric tests are not met.
Bootstrapping
Bootstrapping is a resampling technique that involves repeatedly sampling with replacement from the original dataset. It can be used to estimate the sampling distribution of a statistic and construct confidence intervals.
Monte Carlo simulation
Monte Carlo methods use repeated random sampling to obtain numerical results. In hypothesis testing, they can be used to estimate p-values for complex statistical models or when analytical solutions are difficult to obtain.
Controlling for Errors
When conducting hypothesis tests, it's best to understand and control for potential errors:
Type I and Type II errors
- Type I Error: Rejecting the null hypothesis when it's actually true (false positive).
- Type II Error: Failing to reject the null hypothesis when it's actually false (false negative).
The significance level (α) directly controls the probability of a Type I error. Decreasing α reduces the chance of Type I errors but increases the risk of Type II errors.
To balance these errors:
- Adjust the significance level based on the consequences of each error type.
- Increase sample size to improve the power of the test.
- Use one-tailed tests when appropriate.
The file drawer effect
The file drawer effect refers to the publication bias where studies with significant results are more likely to be published than those with non-significant results. This can lead to an overestimation of effects in the literature. To mitigate this:
- Consider pre-registering studies.
- Publish all results, significant or not.
- Conduct meta-analyses that account for publication bias.
- Simulate data beforehand.
Glossary of Key Terms and Definitions
- Null Hypothesis (H0): The default assumption that there is no effect or difference.
- Alternative Hypothesis (Ha): The hypothesis that there is an effect or difference.
- P-value: The probability of observing the test results under the null hypothesis.
- Significance Level (α): The threshold for rejecting the null hypothesis, commonly set at 0.05.
- Test Statistic: A standardized value used to compare the observed data with the null hypothesis.
- Type I Error: Rejecting a true null hypothesis (false positive).
- Type II Error: Failing to reject a false null hypothesis (false negative).
- Statistical Power: The probability of correctly rejecting a false null hypothesis.
- Confidence Interval: A range of values that likely contains the true population parameter.
- Effect Size: A measure of the magnitude of the difference or relationship being tested.
Conclusion
Remember that hypothesis testing is just one part of the statistical inference toolkit. Always consider the practical significance of your findings, not just statistical significance. As you gain experience, you'll develop an understanding of when and how to apply these techniques in various real-world scenarios.
To further enhance your statistical expertise, you might explore topics such as How to Become a Statistician in 2024, which offers insights into the evolving field and the skills needed for success. Additionally, practicing the Top 35 Statistics Interview Questions and Answers for 2024 and working through our Practicing Statistics Interview Questions in R course can help you sharpen your skills and prepare for interviews.
Get certified in your dream Data Analyst role
Our certification programs help you stand out and prove your skills are job-ready to potential employers.

As an adept professional in Data Science, Machine Learning, and Generative AI, Vinod dedicates himself to sharing knowledge and empowering aspiring data scientists to succeed in this dynamic field.
Frequently Asked Questions
Why is it important to control the environment when conducting a hypothesis test?
Controlling the environment during a hypothesis test will minimize external variables that could affect the results. This control ensures that any observed effects in the experiment can be more confidently attributed to the independent variable under study, rather than to extraneous factors. This way, the validity of the test results is strengthened.
What is a null hypothesis?
The null hypothesis, often symbolized as H0, is a default assumption that there is no effect or difference between the groups or conditions being tested. It serves as a statement that the researcher seeks to disprove or nullify through statistical analysis. Rejecting or failing to reject the null hypothesis provides key insights into the relationship between variables.
How does the p-value relate to confidence intervals in hypothesis testing?
The p-value and confidence intervals are both tools used to make inferences about the population based on sample data. A p-value indicates the probability of observing results as extreme as those in the sample if the null hypothesis is true. Confidence intervals, on the other hand, provide a range of values within which the true population parameter is likely to fall. If a confidence interval for a mean difference or effect size does not include the null value (e.g., zero difference), it suggests that the null hypothesis can be rejected at the confidence level of the interval, aligning with a low p-value.
What are Type I and Type II errors?
Type I error occurs when the null hypothesis is wrongly rejected, essentially detecting an effect that is not there (false positive). Type II error happens when the null hypothesis is wrongly not rejected, missing an actual effect (false negative). Balancing these errors is crucial for robust statistical analysis.
How does sample size affect hypothesis testing?
Sample size directly impacts the power of a hypothesis test, which is the probability of correctly rejecting a false null hypothesis (avoiding a Type II error). Larger sample sizes generally provide more accurate and reliable estimates of the population parameters, increase the power of the test, and reduce the margin of error in confidence intervals.
What if my sample data is not representative of the population?
If the sample data is not representative of the population, the results of the hypothesis test may be biased and not generalizable to the broader population. This can be a result of flawed sampling methods like selection bias, which may not capture the full diversity or characteristics of the population.
What is the difference between parametric vs. non-parametric tests?
Parametric tests assume that the data follows a specific distribution. Non-parametric tests do not assume any specific distribution for the data. They are used in situations when dealing with ordinal data, data that is not normally distributed, or when sample sizes are small.
What is the difference between statistical significance and practical significance?
While statistical significance tells us about the likelihood of an effect occurring by chance, practical significance addresses the actual impact or relevance of this effect in practical terms. A result can be statistically significant without being practically significant if the effect size is too small to be of any real-world consequence.


