Track
Several important statistical concepts and methods, such as variance, coefficient of variation, and confidence intervals, depend on standard deviation as a foundational measure of variability, thus making it one of the most important tools in statistics for data professionals to master.
If, as you read this article, you discover that you want to brush up on statistics, take our Introduction to Statistics course, which covers many foundational topics with no coding required.
How to Calculate the Standard Deviation in Excel
To calculate standard deviation in Excel, enter your data into a column, then use the STDEV.P() function for a population or the STDEV.S() function for a sample.
The main difference between these functions is that STDEV.P() divides by the total number of data points while STDEV.S() divides by the number of data points minus one (n-1) to account for sample variability.
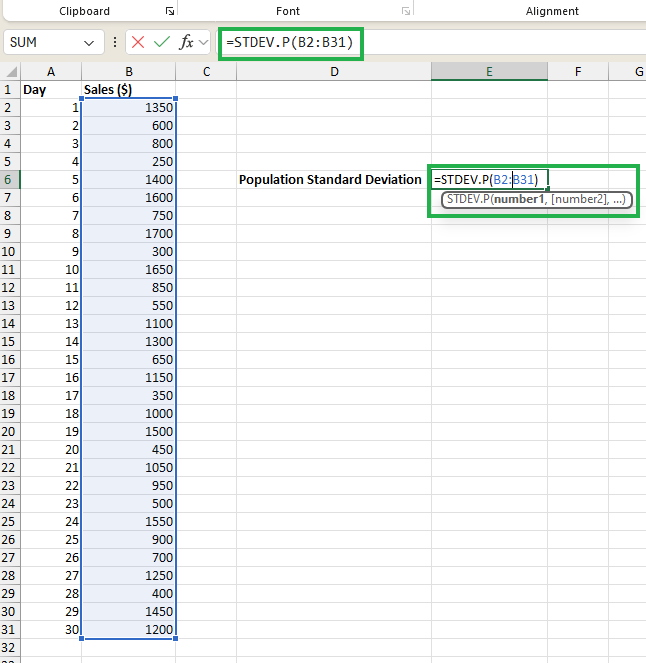
Quick calculation of standard deviation in Excel. Image by Author.
For example, if your data is in cells B2 to B31, type =STDEV.P(B2:B31) to calculate the population standard deviation or =STDEV.S(B2:B31) for the sample standard deviation. Excel will automatically compute and display the standard deviation for your dataset.
Population vs. Sample Standard Deviation in Excel
Standard deviation is a statistical measure that quantifies the amount of variation or dispersion in a set of numerical values. It indicates how much the values in a dataset deviate from the mean (average) of the dataset.
It helps to understand the extent of variability within data—a low standard deviation indicates that the values are close to the mean, suggesting consistency, while a high standard deviation indicates greater variability, suggesting more spread-out data.
STDEV.P() for population standard deviation
The formula for standard deviation depends on whether we are dealing with a population or a sample. The formula for population standard deviation (σ) is as follows:

Population standard deviation. Image by Author.
Where:
-
Nis the total number of data points in the population. -
x_i represents each individual data point. -
μis the mean (average) of the population.
This formula calculates the average of the squared deviations from the mean and then takes the square root of this average.
The STDEV.P() function in Excel calculates the standard deviation for an entire population. This function assumes that the provided arguments include the entire population. The syntax for the STDEV.P() function is as follows:
STDEV.P(number1, [number2], ...)The parameters are:
-
number1: The first number argument corresponds to a population. -
[number2], ...: Optional additional numbers or references that correspond to a population, up to 254 arguments.
STDEV.P() calculates the standard deviation using the population standard deviation formula we learned earlier. This ensures that the calculation reflects the characteristics of the entire population.
We should use STDEV.P() when we have data representing the entire population. For example, when analyzing the test scores of all students in a specific school, STDEV.P() is appropriate because the dataset includes the whole population of interest.
STDEV.S() for sample standard deviation
The formula for sample standard deviation (s) is as follows. Note that for sample standard deviation, we use a lowercase n for convention.

Sample standard deviation equation. Image by Author.
Where:
-
nis the total number of data points in the sample. -
x_i represents each individual data point. -
xˉis the mean (average) of the sample.
The formula is similar to that of the population standard deviation. Still, it uses n - 1 (Bessel’s correction) in the denominator to account for the fact that a sample is being used to estimate the population parameter. This correction makes the sample standard deviation an unbiased estimator of the population standard deviation.
The STDEV.S() function in Excel calculates the standard deviation for a sample of the population. This function assumes that the provided arguments are a sample of the population, not the entire population. The syntax for the STDEV.S() function is as follows:
STDEV.S(number1, [number2], ...)The parameters are:
-
number1: The first number argument corresponds to a sample of the population. -
[number2], ...: Optional additional numbers or references that correspond to a sample, up to 254 arguments.
STDEV.S() calculates the standard deviation by using the formula for the sample standard deviation, accounting for Bessel's correction, as we learned earlier.
In practice, when we have a sample of data, we use STDEV.S() to estimate the standard deviation of the entire population. Suppose we analyze the test scores of a subset of students randomly selected from a school. STDEV.S() is appropriate because our dataset is only a sample of the total student population.
Now that we’ve learned about the functions available in Excel for calculating standard deviation let’s put all our knowledge into practice by using an example.
Working Through an Example of Standard Deviation in Excel
Calculating standard deviation in Excel
Imagine a scenario where, as a data analyst, you’re required to analyze the sales performance of a small retail store. The store owner wants to understand the variability in daily sales over the past month to better manage inventory and staffing levels.
You have collected the daily sales data for 30 days and must calculate the standard deviation to quantify this variability.
Let’s start by tabulating the records in a column, let’s say B2 to B31, in an Excel spreadsheet.
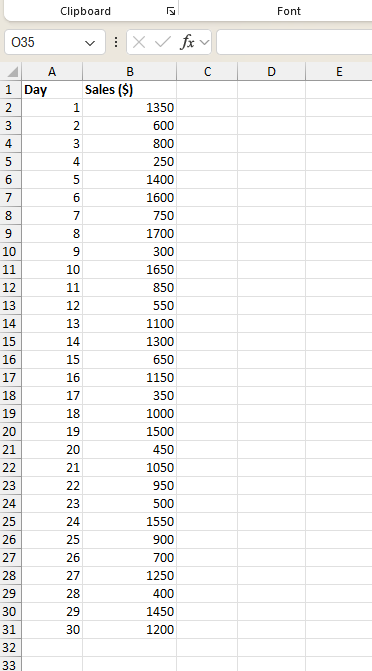
Stores sales dataset. Image by Author.
We can calculate the population standard deviation in the cell E6 by typing the following equation:
=STDEV.P(B2:B31)You will see the calculated population standard deviation in cell E6 as follows:
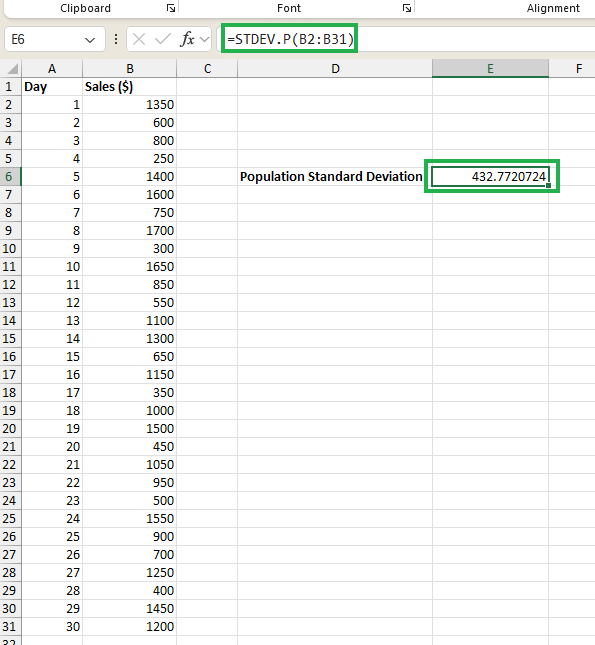
Calculating population standard deviation. Image by Author.
We used the STDEV.P() function because, in our scenario, our entire population for the analysis is the sales data for the last month.
Suppose we’re performing an analysis for an entire year using the last 30 days' data as a sample; then we’ll be using the STDEV.S() function as shown using the equation below:
=STDEV.S(B2:B31)And we’ll be seeing the calculated sample standard deviation below:
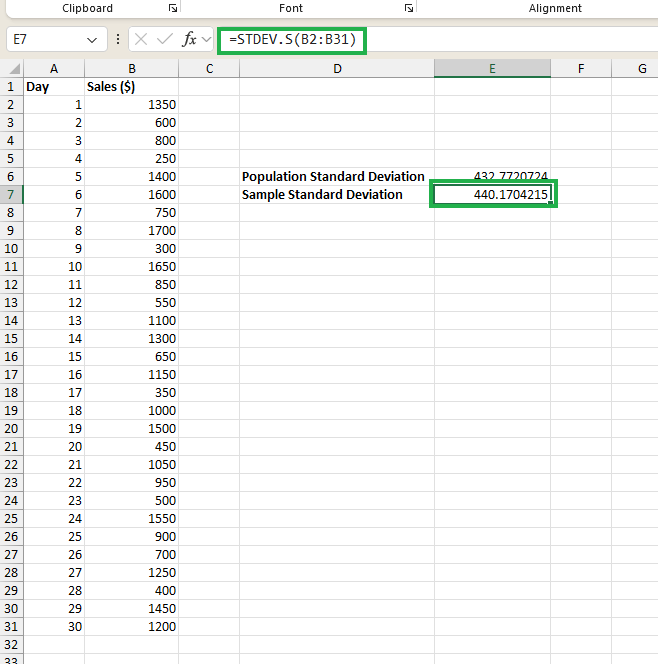
Calculating sample standard deviation. Image by Author.
After calculating the standard deviation, the next step is interpreting the result in a business context.
Interpreting standard deviation values
For a better interpretation of standard deviation values and to supplement our analysis, we can calculate the mean value of our sales data using the equation below:
=AVERAGE(B2:B31)The mean value can be calculated as $975 on cell E7, as seen below:
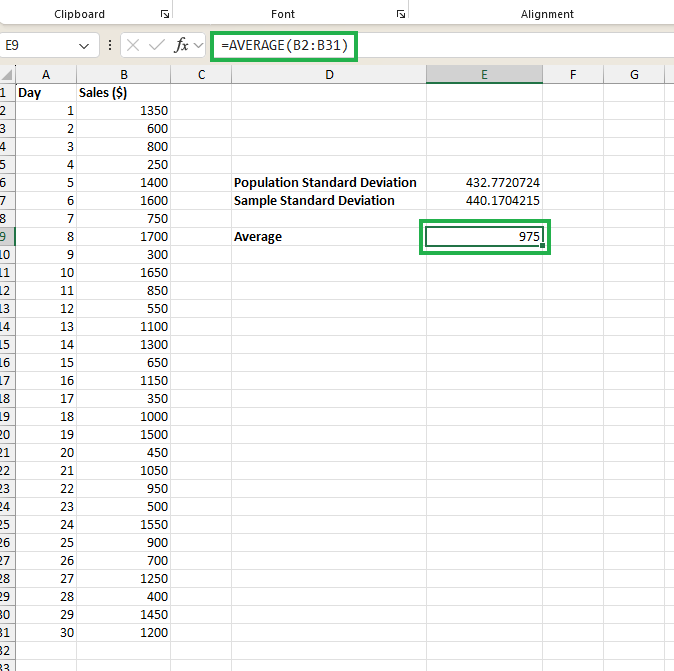
Calculating the average of the dataset. Image by Author.
Along with the average value obtained, we can interpret the standard deviation values as:
- Population Standard Deviation: The population standard deviation of approximately 432.77 indicates that, on average, daily sales vary by about $432.77 from the mean sales value of $975. This figure represents the spread of sales data, as we considered the entire month a complete dataset.
- Sample Standard Deviation: The sample standard deviation of approximately 440.17 is slightly higher than the population standard deviation. This value is relevant if we’re treating the 30 days of data as a sample from a larger population (e.g., all possible future months.)
- Higher Sample Standard Deviation: The slightly higher value in sample standard deviation accounts for the uncertainty in using a sample to estimate the overall variability in sales. It suggests that if we sample another month, we might expect a similar variability in daily sales.
- High Variability in Sales: Both standard deviation values indicate high variability in daily sales, meaning that sales figures tend to fluctuate significantly from the average of $975. This level of variability could impact inventory management and staffing. On some days, sales could be much higher or lower than average, leading to overstocking or understocking if not carefully managed.
Since the standard deviation values suggest that daily sales are inconsistent and vary widely, further analysis or a machine learning model can be built to estimate the sales on a particular day.
The store owner should consider this variability when planning inventory and staffing to avoid potential issues related to overstocking or understaffing.
How to add standard deviation bars In Excel
Adding standard deviation bars to our charts in Excel is a useful way to visually represent our data's variability.
Select the data range, B2 to B31, from our example and go to the Insert tab. Choose your desired chart type as shown in the image below (e.g., line chart) and insert the chart.
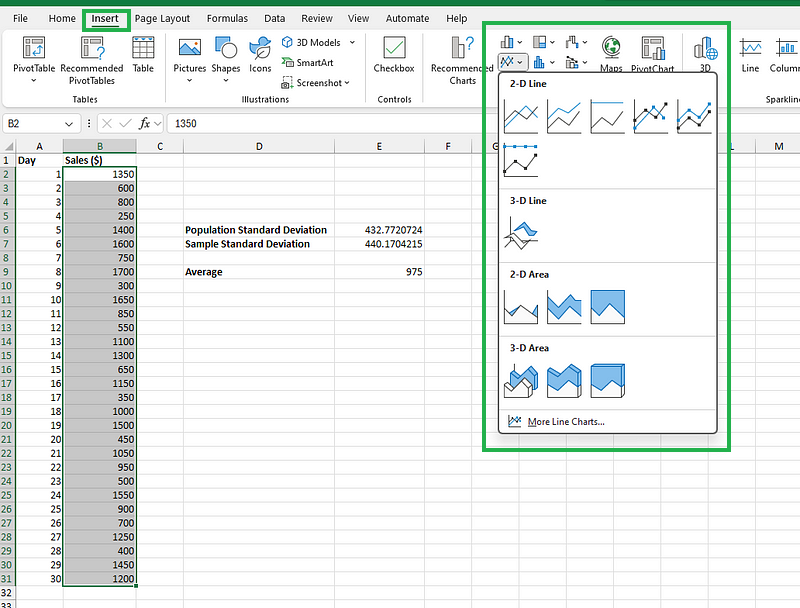
Inserting a chart for the store sales data. Image by Author.
You’ll see a simple line chart below:
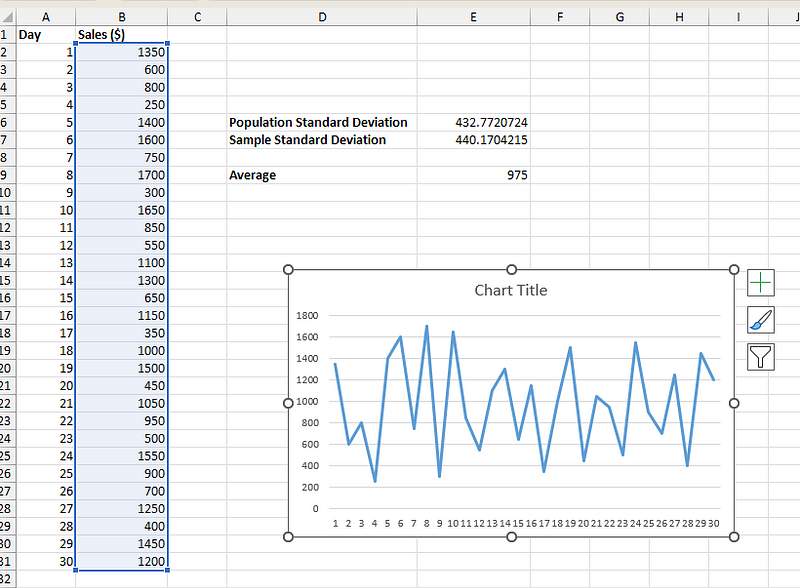
Line chart for store sales data. Image by Author.
Click on the data series in your chart to highlight it. This step is necessary to add error bars to the selected data series. Go to the Chart Design tab that appears when you select the chart. Click on Add Chart Element (found in the Chart Layouts group).
Next, hover over Error Bars and select Standard Deviation to add the standard deviation bars to the line chart.
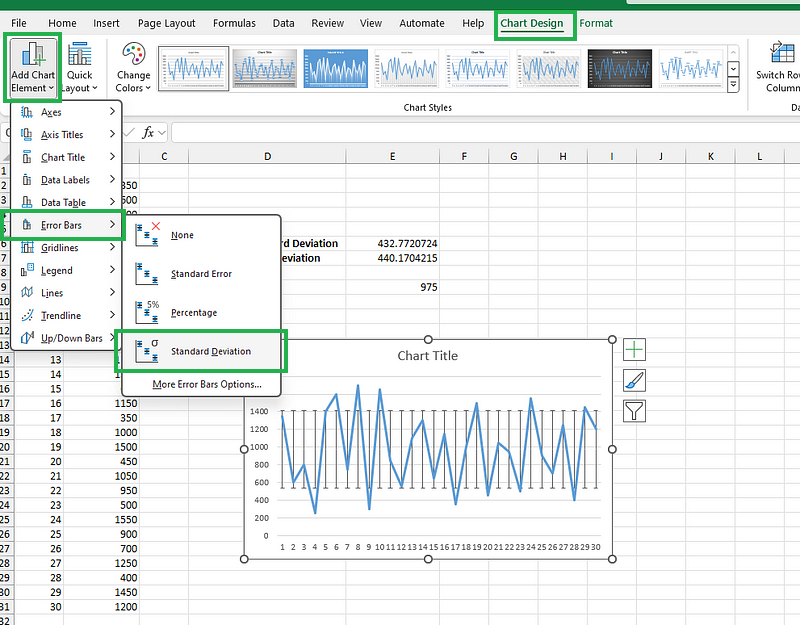
Adding standard deviation bars to the line chart. Image by Author.
You may also hover Error Bars and then click on More Error Bars Options to further format the error bars and adjust the color, width, and line style to match your chart’s design preferences. This can be done in the same panel under the Format Error Bars options. Feel free to play with the chart until you get the plot you’d like to visualize.
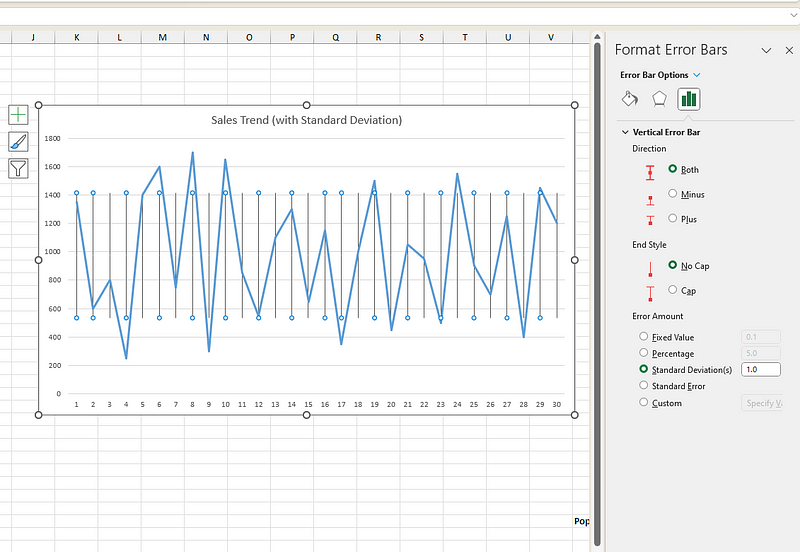
Formatting the standard deviation bars. Image by Author.
Adding standard deviation bars to our charts in Excel provides a clear visual representation of the variability in the data, which helps in effective data analysis and decision-making.
Conclusion
Standard deviation is a fundamental and valuable tool that helps us understand a dataset’s variability. Further, it’s used in several other analyses, such as coefficient of variation, confidence intervals, and ANOVA, making it a must-learn technique for all data professionals.
We encourage you to check out our comprehensive hands-on Excel Fundamentals skill track to further expand your Excel and data analytical skills.

As a senior data scientist, I design, develop, and deploy large-scale machine-learning solutions to help businesses make better data-driven decisions. As a data science writer, I share learnings, career advice, and in-depth hands-on tutorials.
Frequently Asked Questions
When should you use the STDEV.S() function instead of the STDEV.P() function in Excel?
You should use the STDEV.S() function when working with a sample of the population rather than the entire population. Use the STDEV.P() function when your data represents the whole population.
How do you interpret a low standard deviation in a dataset?
A low standard deviation indicates that the values in the dataset are close to the mean, suggesting that the data points are consistently similar to the average value. This implies low variability and high reliability in the data, with fewer deviations from the mean.
Why is standard deviation important in evaluating the accuracy of a regression model?
Standard deviation is important in evaluating the accuracy of a regression model because it quantifies the spread of the residuals, which are the errors in the model's predictions. By calculating the standard deviation of the residuals, analysts can assess how well the regression model fits the data.
What does a high standard deviation indicate about a dataset?
A high standard deviation indicates that the values in the dataset are spread out over a wider range. This means there is greater variability or dispersion from the mean, suggesting inconsistency in the data, with values deviating significantly from the average.
What is the difference between STDEV.P() and STDEV.S() in Excel?
The main difference between STDEV.P() and STDEV.S() lies in their application. STDEV.P() calculates the standard deviation for an entire population and divides it by the total number of data points. In contrast, STDEV.S() calculates the standard deviation for a population sample and divides it by the number of data points minus one (N-1) to account for sample variability, also known as Bessel's correction.
What are the practical applications of standard deviation?
Standard deviation is widely used across multiple fields to measure data variability:
- Finance: Investors use it to assess investment risk and volatility
- Manufacturing: Quality control teams monitor product consistency and defects
- Healthcare: Medical professionals analyze patient metrics like blood pressure and cholesterol levels
- Education: Teachers set grading curves and evaluate test score distributions
- Meteorology: Weather forecasters analyze temperature, precipitation, and climate patterns
How do I calculate standard deviation in Excel for multiple columns?
To calculate standard deviation across multiple columns, select all the data ranges in your formula. For example: =STDEV.S(A2:A10, B2:B10, C2:C10). Excel will calculate the standard deviation treating all selected ranges as one dataset.
Can I calculate standard deviation in Excel while ignoring blank cells?
Yes, both STDEV.S() and STDEV.P() automatically ignore blank cells and text values. They only calculate standard deviation based on numerical values in your selected range, so you don't need to worry about empty cells affecting your results.
What's the difference between standard deviation and variance?
Standard deviation is the square root of variance. Variance measures the average squared deviation from the mean, while standard deviation brings this back to the original units of measurement. In Excel, use VAR.S() or VAR.P() for variance, and STDEV.S() or STDEV.P() for standard deviation.

